
|
|||||
|
 | |
| |
| |
| |
| |
| |
|
Gene: MESD |
Gene summary for MESD |
| Gene information | Species | Human | Gene symbol | MESD | Gene ID | 23184 |
| Gene name | mesoderm development LRP chaperone | |
| Gene Alias | BOCA | |
| Cytomap | 15q25.1 | |
| Gene Type | protein-coding | GO ID | GO:0001503 | UniProtAcc | Q14696 |
Top |
Malignant transformation analysis |
| Identification of the aberrant gene expression in precancerous and cancerous lesions by comparing the gene expression of stem-like cells in diseased tissues with normal stem cells |
| Entrez ID | Symbol | Replicates | Species | Organ | Tissue | Adj P-value | Log2FC | Malignancy |
| 23184 | MESD | LZE2D | Human | Esophagus | HGIN | 6.44e-06 | 6.32e-01 | 0.0642 |
| 23184 | MESD | LZE2T | Human | Esophagus | ESCC | 1.47e-14 | 1.34e+00 | 0.082 |
| 23184 | MESD | LZE3D | Human | Esophagus | HGIN | 8.88e-07 | 8.48e-01 | 0.0668 |
| 23184 | MESD | LZE4T | Human | Esophagus | ESCC | 8.08e-37 | 8.17e-01 | 0.0811 |
| 23184 | MESD | LZE5T | Human | Esophagus | ESCC | 4.24e-14 | 6.52e-01 | 0.0514 |
| 23184 | MESD | LZE7T | Human | Esophagus | ESCC | 7.39e-21 | 1.01e+00 | 0.0667 |
| 23184 | MESD | LZE8T | Human | Esophagus | ESCC | 9.50e-36 | 9.29e-01 | 0.067 |
| 23184 | MESD | LZE20T | Human | Esophagus | ESCC | 3.87e-19 | 5.17e-01 | 0.0662 |
| 23184 | MESD | LZE21D1 | Human | Esophagus | HGIN | 2.75e-06 | 6.78e-01 | 0.0632 |
| 23184 | MESD | LZE22D1 | Human | Esophagus | HGIN | 1.24e-04 | 2.38e-01 | 0.0595 |
| 23184 | MESD | LZE22T | Human | Esophagus | ESCC | 1.54e-17 | 7.78e-01 | 0.068 |
| 23184 | MESD | LZE24T | Human | Esophagus | ESCC | 2.92e-27 | 6.03e-01 | 0.0596 |
| 23184 | MESD | LZE22D3 | Human | Esophagus | HGIN | 4.92e-04 | 5.85e-01 | 0.0653 |
| 23184 | MESD | LZE21T | Human | Esophagus | ESCC | 2.11e-16 | 5.66e-01 | 0.0655 |
| 23184 | MESD | LZE6T | Human | Esophagus | ESCC | 2.36e-17 | 7.73e-01 | 0.0845 |
| 23184 | MESD | S014 | Human | Liver | HCC | 1.84e-50 | 1.75e+00 | 0.2254 |
| 23184 | MESD | S015 | Human | Liver | HCC | 5.79e-41 | 1.93e+00 | 0.2375 |
| 23184 | MESD | S016 | Human | Liver | HCC | 2.93e-59 | 1.95e+00 | 0.2243 |
| 23184 | MESD | S027 | Human | Liver | HCC | 1.72e-19 | 1.49e+00 | 0.2446 |
| 23184 | MESD | S028 | Human | Liver | HCC | 4.47e-46 | 1.61e+00 | 0.2503 |
| Page: 1 2 |
| Tissue | Expression Dynamics | Abbreviation |
| Esophagus |  | ESCC: Esophageal squamous cell carcinoma |
| HGIN: High-grade intraepithelial neoplasias | ||
| LGIN: Low-grade intraepithelial neoplasias | ||
| Liver |  | HCC: Hepatocellular carcinoma |
| NAFLD: Non-alcoholic fatty liver disease | ||
| Thyroid | 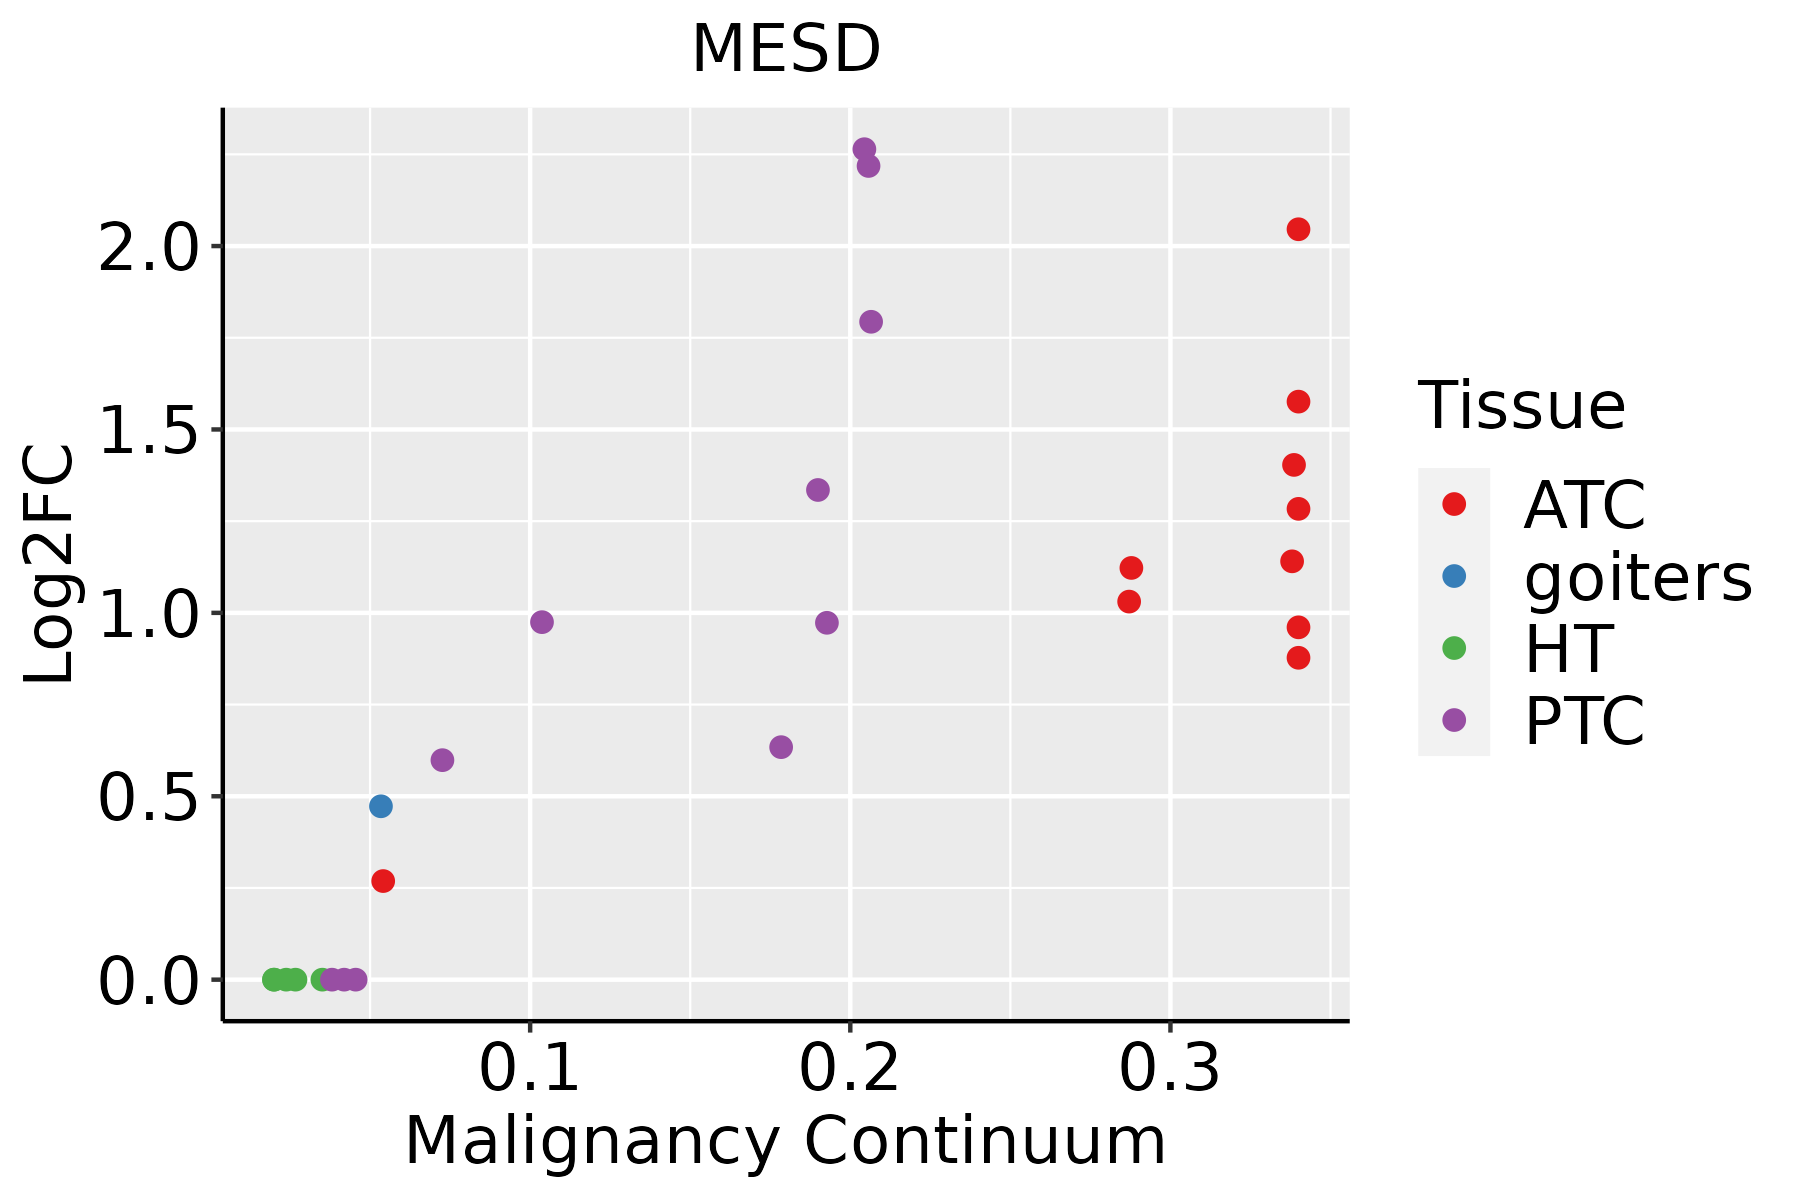 | ATC: Anaplastic thyroid cancer |
| HT: Hashimoto's thyroiditis | ||
| PTC: Papillary thyroid cancer |
| ∗log2FC in expression of this searched gene in stem-like cells from each diseased tissue sample relative to stem-like cells in normal samples in each tissue plotted against the malignancy continuum. Samples are colored based on if they are from different disease stage. |
Top |
Malignant transformation related pathway analysis |
| Find out the enriched GO biological processes and KEGG pathways involved in transition from healthy to precancer to cancer |
| Tissue | Disease Stage | Enriched GO biological Processes |
| Colorectum | AD |  |
| Colorectum | SER |  |
| Colorectum | MSS |  |
| Colorectum | MSI-H |  |
| Colorectum | FAP |  |
| ∗Top 15 enriched GO BP terms are showed in the bar plot of each disease state in each tissue. Each row represents a significant GO biological process which is colored according to the -log10(p.adjust). |
| Page: 1 2 3 4 5 6 7 8 9 |
| GO ID | Tissue | Disease Stage | Description | Gene Ratio | Bg Ratio | pvalue | p.adjust | Count |
| GO:0006457112 | Thyroid | PTC | protein folding | 137/5968 | 212/18723 | 8.29e-23 | 2.01e-20 | 137 |
| GO:1903829113 | Thyroid | PTC | positive regulation of cellular protein localization | 162/5968 | 276/18723 | 2.40e-20 | 3.52e-18 | 162 |
| GO:0016055110 | Thyroid | PTC | Wnt signaling pathway | 217/5968 | 444/18723 | 3.71e-14 | 2.30e-12 | 217 |
| GO:0198738110 | Thyroid | PTC | cell-cell signaling by wnt | 217/5968 | 446/18723 | 6.68e-14 | 3.73e-12 | 217 |
| GO:190547525 | Thyroid | PTC | regulation of protein localization to membrane | 91/5968 | 175/18723 | 2.41e-08 | 5.43e-07 | 91 |
| GO:0001503110 | Thyroid | PTC | ossification | 176/5968 | 408/18723 | 9.26e-07 | 1.40e-05 | 176 |
| GO:190547725 | Thyroid | PTC | positive regulation of protein localization to membrane | 55/5968 | 106/18723 | 1.45e-05 | 1.55e-04 | 55 |
| GO:00991738 | Thyroid | PTC | postsynapse organization | 77/5968 | 168/18723 | 1.01e-04 | 8.25e-04 | 77 |
| GO:00508089 | Thyroid | PTC | synapse organization | 161/5968 | 426/18723 | 5.11e-03 | 2.36e-02 | 161 |
| GO:000645728 | Thyroid | goiters | protein folding | 33/497 | 212/18723 | 2.09e-16 | 8.64e-14 | 33 |
| GO:000150324 | Thyroid | goiters | ossification | 25/497 | 408/18723 | 1.00e-04 | 3.16e-03 | 25 |
| GO:1903909 | Thyroid | goiters | regulation of receptor clustering | 3/497 | 12/18723 | 3.42e-03 | 4.97e-02 | 3 |
| GO:000645733 | Thyroid | ATC | protein folding | 140/6293 | 212/18723 | 3.46e-22 | 8.09e-20 | 140 |
| GO:1903829210 | Thyroid | ATC | positive regulation of cellular protein localization | 167/6293 | 276/18723 | 3.32e-20 | 5.38e-18 | 167 |
| GO:001605525 | Thyroid | ATC | Wnt signaling pathway | 234/6293 | 444/18723 | 4.64e-17 | 4.31e-15 | 234 |
| GO:019873825 | Thyroid | ATC | cell-cell signaling by wnt | 234/6293 | 446/18723 | 9.26e-17 | 8.25e-15 | 234 |
| GO:000150332 | Thyroid | ATC | ossification | 206/6293 | 408/18723 | 9.23e-13 | 3.95e-11 | 206 |
| GO:1905475111 | Thyroid | ATC | regulation of protein localization to membrane | 96/6293 | 175/18723 | 5.55e-09 | 1.22e-07 | 96 |
| GO:1905477111 | Thyroid | ATC | positive regulation of protein localization to membrane | 58/6293 | 106/18723 | 6.14e-06 | 6.42e-05 | 58 |
| GO:009917314 | Thyroid | ATC | postsynapse organization | 78/6293 | 168/18723 | 3.66e-04 | 2.26e-03 | 78 |
| Page: 1 2 3 |
| Pathway ID | Tissue | Disease Stage | Description | Gene Ratio | Bg Ratio | pvalue | p.adjust | qvalue | Count |
| Page: 1 |
Top |
Cell-cell communication analysis |
| Identification of potential cell-cell interactions between two cell types and their ligand-receptor pairs for different disease states |
| Ligand | Receptor | LRpair | Pathway | Tissue | Disease Stage |
| Page: 1 |
Top |
Single-cell gene regulatory network inference analysis |
| Find out the significant the regulons (TFs) and the target genes of each regulon across cell types for different disease states |
| TF | Cell Type | Tissue | Disease Stage | Target Gene | RSS | Regulon Activity |
| ∗The dot plots of a searched regulon are shown for all cell subpopulations in each disease state of each tissue based on the regulon specific score inferred using pySCENIC and by calculating the average expression. |
| Page: 1 |
Top |
Somatic mutation of malignant transformation related genes |
| Annotation of somatic variants for genes involved in malignant transformation |
| Hugo Symbol | Variant Class | Variant Classification | dbSNP RS | HGVSc | HGVSp | HGVSp Short | SWISSPROT | BIOTYPE | SIFT | PolyPhen | Tumor Sample Barcode | Tissue | Histology | Sex | Age | Stage | Therapy Types | Drugs | Outcome |
| Page: 1 |
Top |
Related drugs of malignant transformation related genes |
| Identification of chemicals and drugs interact with genes involved in malignant transfromation |
| (DGIdb 4.0) |
| Entrez ID | Symbol | Category | Interaction Types | Drug Claim Name | Drug Name | PMIDs |
| Page: 1 |

Copyright 2023-Present -The University of Texas Health Science Center at Houston |