
|
|||||
|
 | |
| |
| |
| |
| |
| |
|
Gene: MDN1 |
Gene summary for MDN1 |
| Gene information | Species | Human | Gene symbol | MDN1 | Gene ID | 23195 |
| Gene name | midasin AAA ATPase 1 | |
| Gene Alias | Rea1 | |
| Cytomap | 6q15 | |
| Gene Type | protein-coding | GO ID | GO:0000027 | UniProtAcc | Q9NU22 |
Top |
Malignant transformation analysis |
| Identification of the aberrant gene expression in precancerous and cancerous lesions by comparing the gene expression of stem-like cells in diseased tissues with normal stem cells |
| Entrez ID | Symbol | Replicates | Species | Organ | Tissue | Adj P-value | Log2FC | Malignancy |
| 23195 | MDN1 | CCI_2 | Human | Cervix | CC | 1.62e-03 | 5.71e-01 | 0.5249 |
| 23195 | MDN1 | CCI_3 | Human | Cervix | CC | 6.04e-07 | 6.25e-01 | 0.516 |
| 23195 | MDN1 | AEH-subject4 | Human | Endometrium | AEH | 3.50e-02 | 2.48e-01 | -0.2657 |
| 23195 | MDN1 | EEC-subject2 | Human | Endometrium | EEC | 8.42e-03 | 1.49e-01 | -0.2607 |
| 23195 | MDN1 | GSM6177620_NYU_UCEC1_lib1_lib1 | Human | Endometrium | EEC | 7.25e-07 | 1.93e-02 | -0.1869 |
| 23195 | MDN1 | GSM6177620_NYU_UCEC1_lib2_lib2 | Human | Endometrium | EEC | 4.89e-03 | -3.45e-02 | -0.1875 |
| 23195 | MDN1 | GSM6177620_NYU_UCEC1_lib3_lib3 | Human | Endometrium | EEC | 7.79e-03 | -2.96e-02 | -0.1883 |
| 23195 | MDN1 | GSM6177621_NYU_UCEC2_lib1_lib1 | Human | Endometrium | EEC | 2.00e-06 | 9.07e-02 | -0.1934 |
| 23195 | MDN1 | GSM6177622_NYU_UCEC3_lib1_lib1 | Human | Endometrium | EEC | 1.30e-12 | -5.42e-02 | -0.1917 |
| 23195 | MDN1 | GSM6177622_NYU_UCEC3_lib2_lib2 | Human | Endometrium | EEC | 1.72e-06 | -6.61e-02 | -0.1916 |
| 23195 | MDN1 | LZE4T | Human | Esophagus | ESCC | 1.98e-04 | 1.92e-01 | 0.0811 |
| 23195 | MDN1 | LZE7T | Human | Esophagus | ESCC | 8.90e-04 | 2.66e-01 | 0.0667 |
| 23195 | MDN1 | LZE24T | Human | Esophagus | ESCC | 1.02e-04 | 2.23e-01 | 0.0596 |
| 23195 | MDN1 | LZE21T | Human | Esophagus | ESCC | 1.95e-02 | 2.75e-01 | 0.0655 |
| 23195 | MDN1 | P1T-E | Human | Esophagus | ESCC | 4.29e-02 | 2.09e-01 | 0.0875 |
| 23195 | MDN1 | P2T-E | Human | Esophagus | ESCC | 7.72e-13 | 2.13e-01 | 0.1177 |
| 23195 | MDN1 | P4T-E | Human | Esophagus | ESCC | 2.74e-03 | 1.01e-01 | 0.1323 |
| 23195 | MDN1 | P5T-E | Human | Esophagus | ESCC | 6.67e-05 | 1.19e-01 | 0.1327 |
| 23195 | MDN1 | P8T-E | Human | Esophagus | ESCC | 9.45e-13 | 1.47e-01 | 0.0889 |
| 23195 | MDN1 | P9T-E | Human | Esophagus | ESCC | 3.70e-05 | 6.67e-02 | 0.1131 |
| Page: 1 2 3 4 5 |
| Tissue | Expression Dynamics | Abbreviation |
| Cervix | 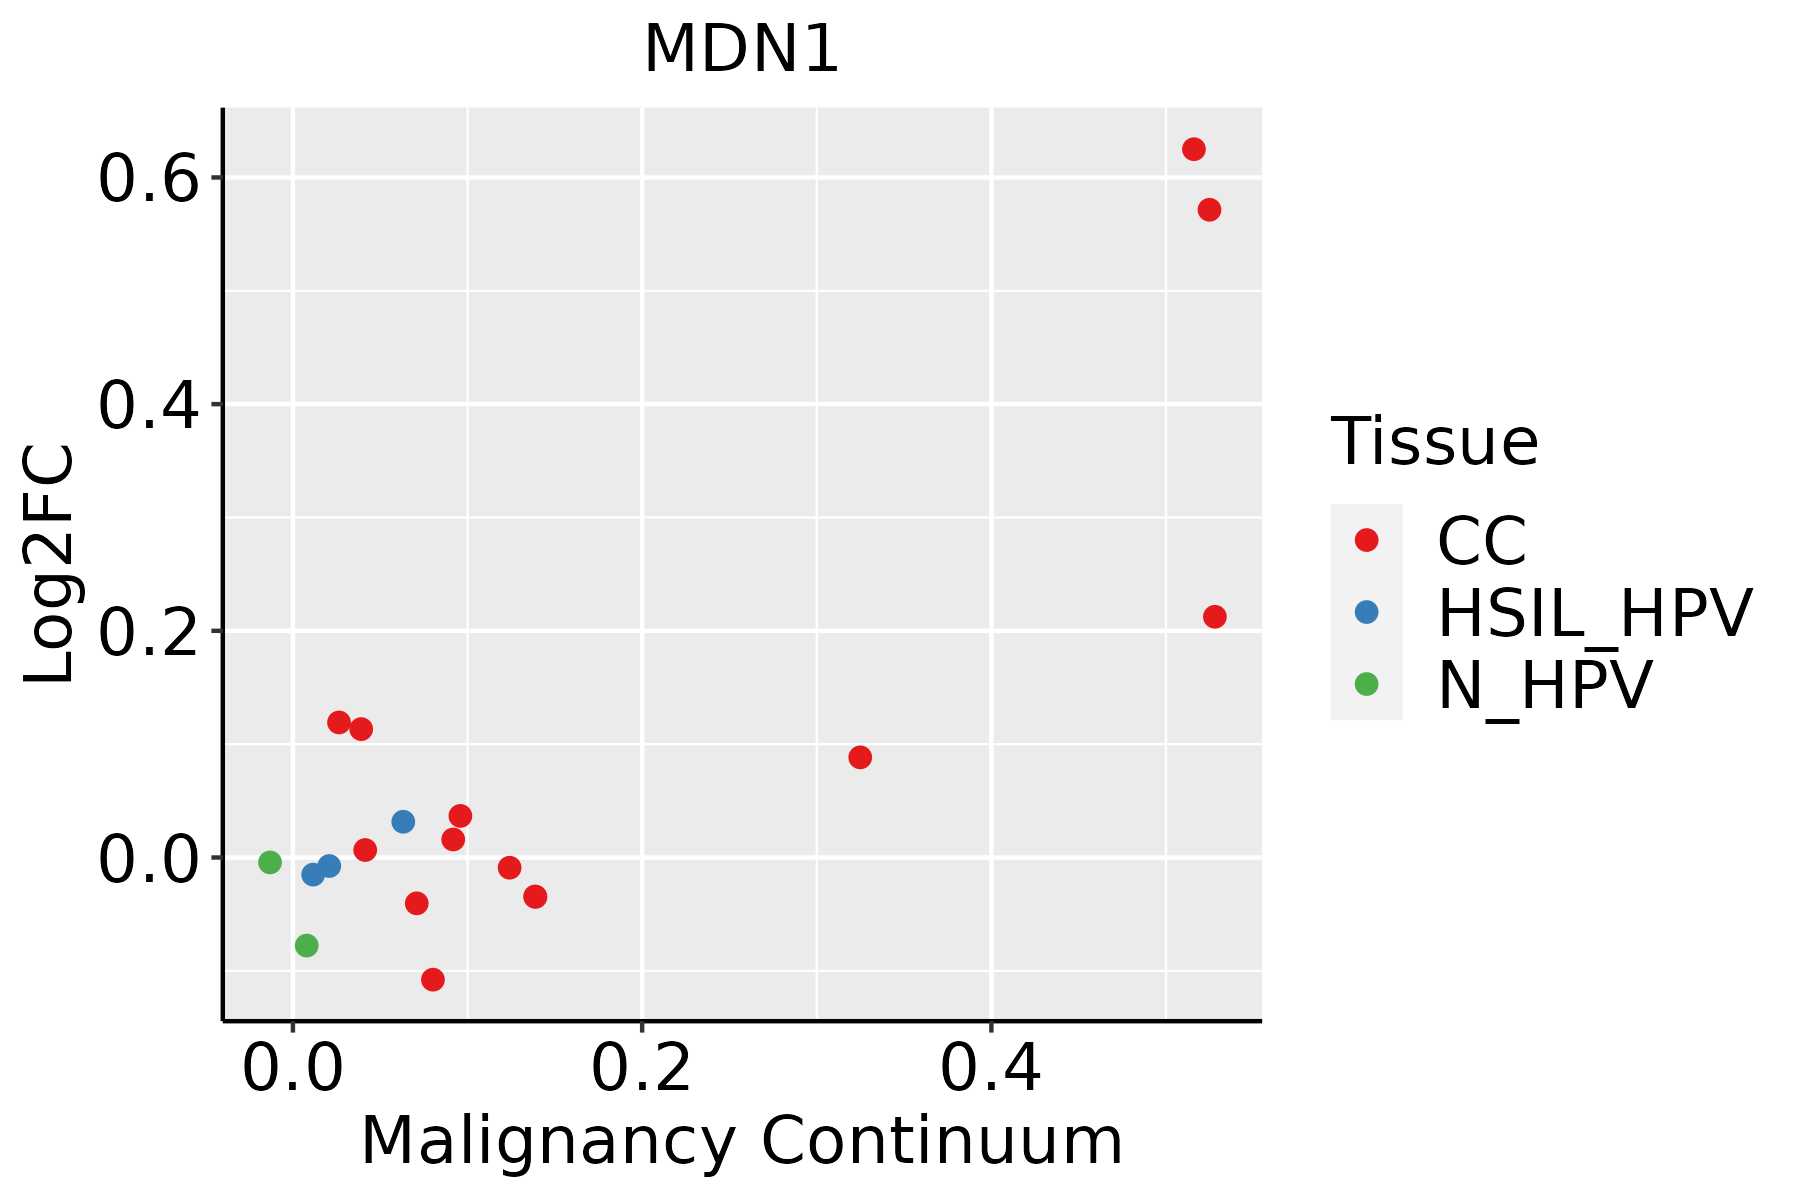 | CC: Cervix cancer |
| HSIL_HPV: HPV-infected high-grade squamous intraepithelial lesions | ||
| N_HPV: HPV-infected normal cervix | ||
| Endometrium | 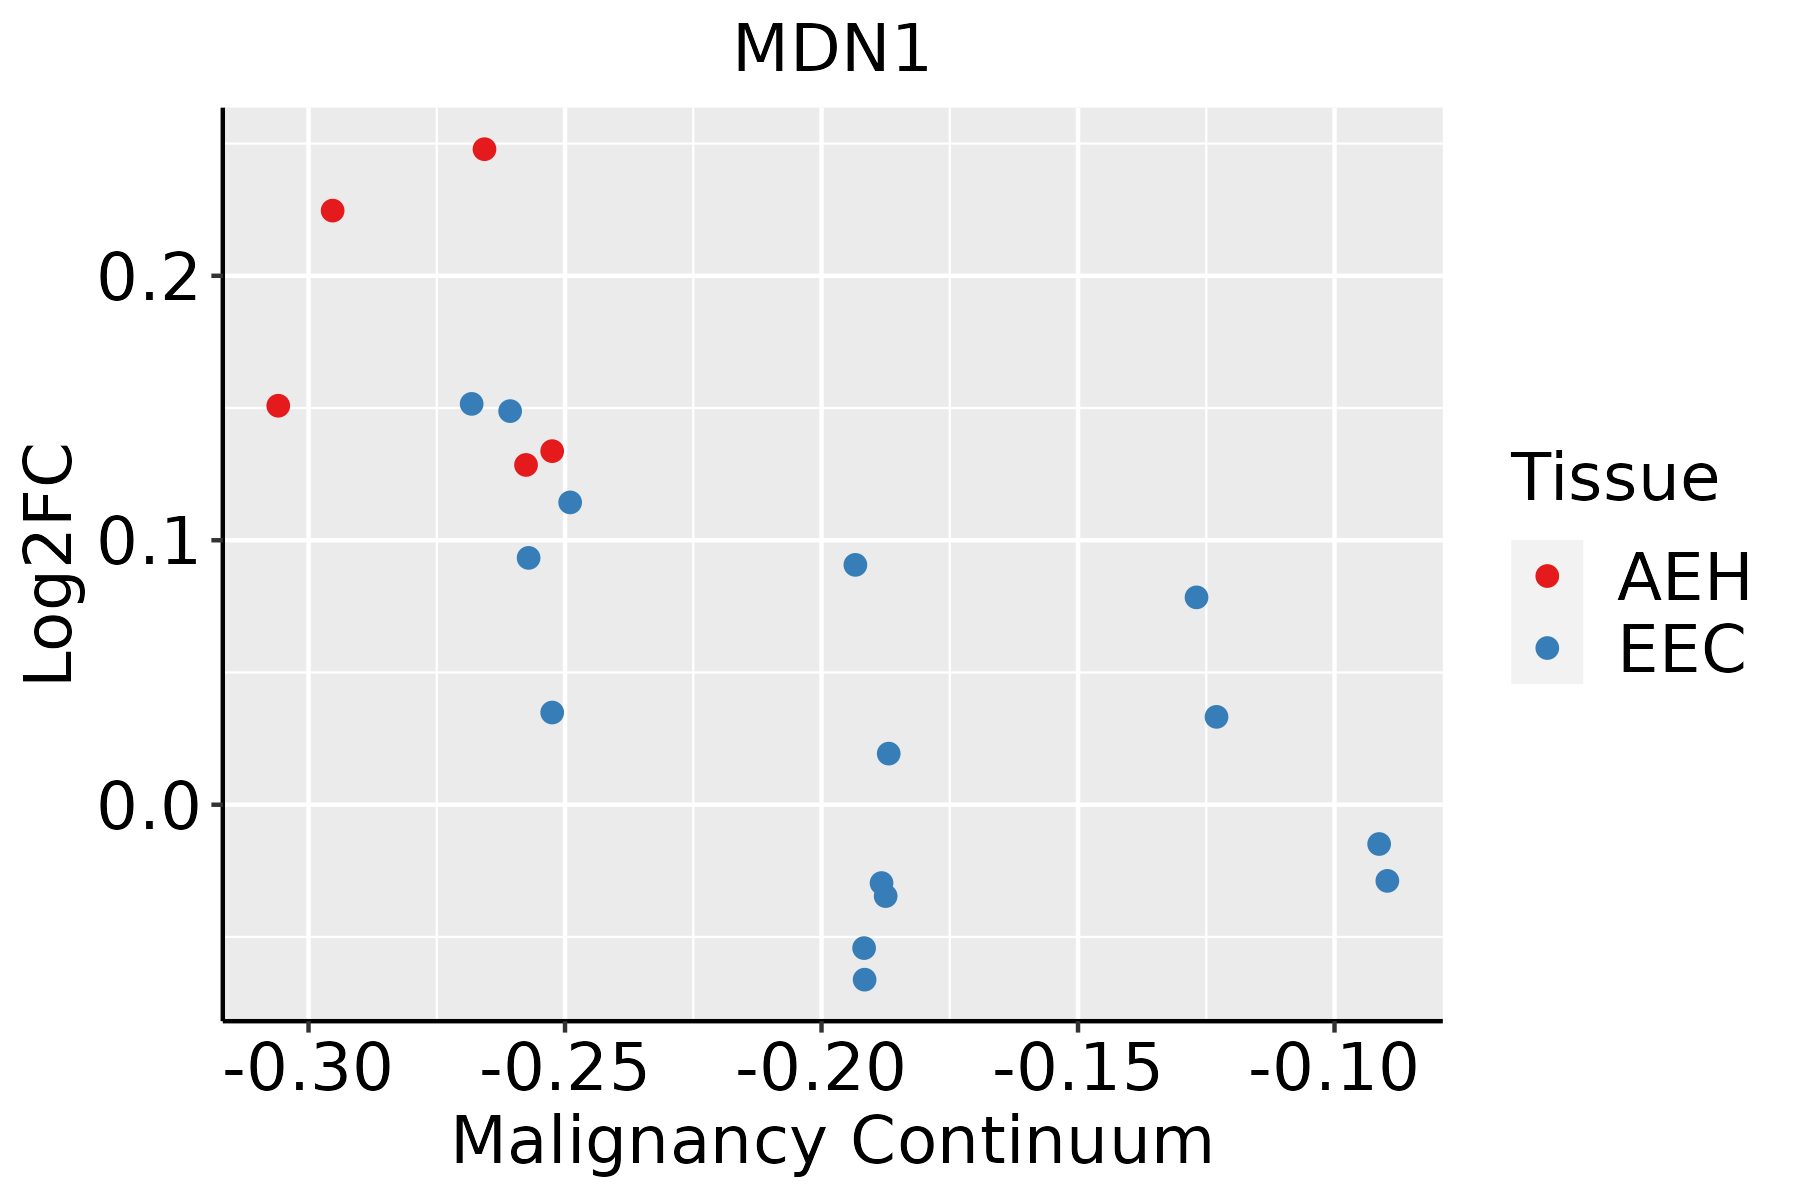 | AEH: Atypical endometrial hyperplasia |
| EEC: Endometrioid Cancer | ||
| Esophagus |  | ESCC: Esophageal squamous cell carcinoma |
| HGIN: High-grade intraepithelial neoplasias | ||
| LGIN: Low-grade intraepithelial neoplasias | ||
| Liver |  | HCC: Hepatocellular carcinoma |
| NAFLD: Non-alcoholic fatty liver disease | ||
| Prostate |  | BPH: Benign Prostatic Hyperplasia |
| Thyroid | 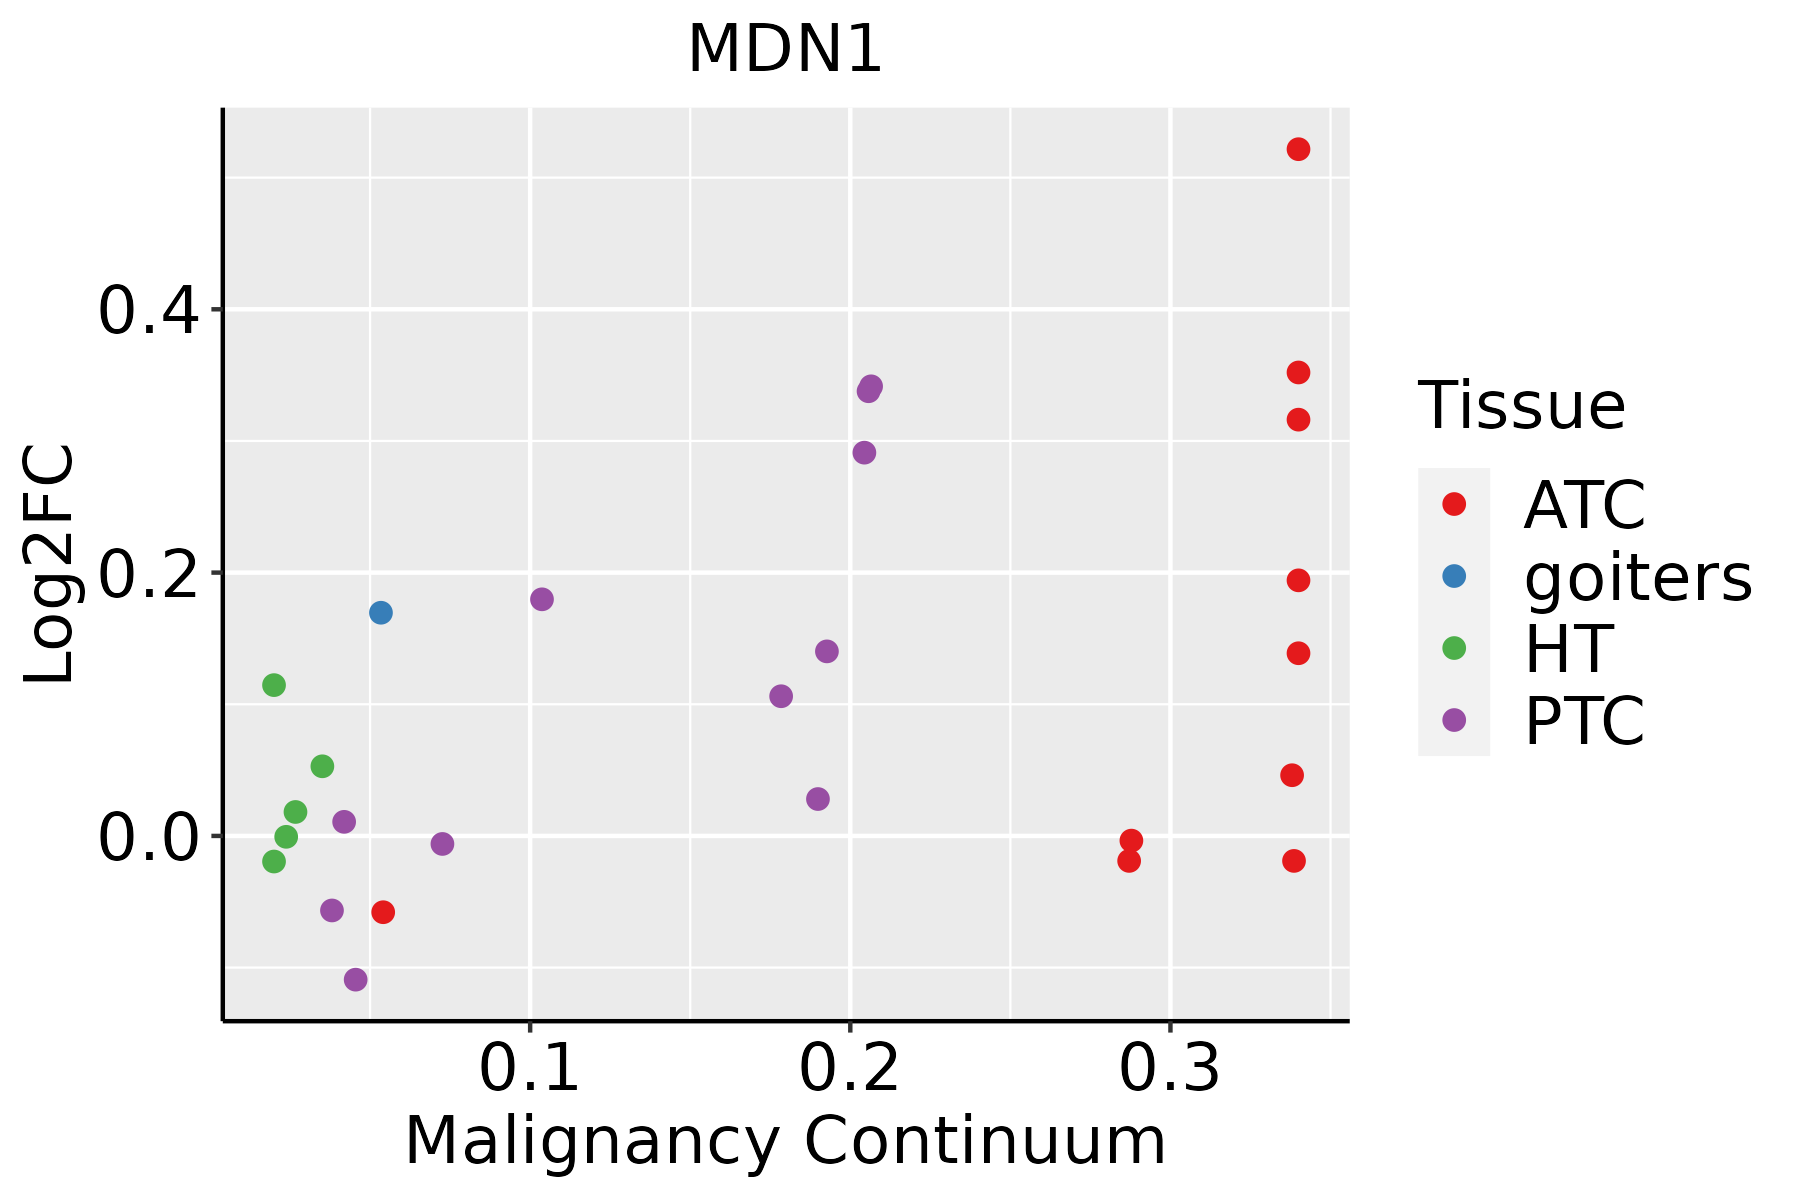 | ATC: Anaplastic thyroid cancer |
| HT: Hashimoto's thyroiditis | ||
| PTC: Papillary thyroid cancer |
| ∗log2FC in expression of this searched gene in stem-like cells from each diseased tissue sample relative to stem-like cells in normal samples in each tissue plotted against the malignancy continuum. Samples are colored based on if they are from different disease stage. |
Top |
Malignant transformation related pathway analysis |
| Find out the enriched GO biological processes and KEGG pathways involved in transition from healthy to precancer to cancer |
| Tissue | Disease Stage | Enriched GO biological Processes |
| Colorectum | AD |  |
| Colorectum | SER |  |
| Colorectum | MSS |  |
| Colorectum | MSI-H |  |
| Colorectum | FAP |  |
| ∗Top 15 enriched GO BP terms are showed in the bar plot of each disease state in each tissue. Each row represents a significant GO biological process which is colored according to the -log10(p.adjust). |
| Page: 1 2 3 4 5 6 7 8 9 |
| GO ID | Tissue | Disease Stage | Description | Gene Ratio | Bg Ratio | pvalue | p.adjust | Count |
| GO:002261817 | Endometrium | EEC | ribonucleoprotein complex assembly | 63/2168 | 220/18723 | 4.16e-12 | 7.56e-10 | 63 |
| GO:004227317 | Endometrium | EEC | ribosomal large subunit biogenesis | 30/2168 | 72/18723 | 8.19e-11 | 1.07e-08 | 30 |
| GO:004225517 | Endometrium | EEC | ribosome assembly | 26/2168 | 61/18723 | 8.15e-10 | 7.51e-08 | 26 |
| GO:004225417 | Endometrium | EEC | ribosome biogenesis | 68/2168 | 299/18723 | 2.90e-08 | 1.68e-06 | 68 |
| GO:000002717 | Endometrium | EEC | ribosomal large subunit assembly | 12/2168 | 27/18723 | 1.84e-05 | 3.43e-04 | 12 |
| GO:000636416 | Endometrium | EEC | rRNA processing | 48/2168 | 225/18723 | 1.88e-05 | 3.50e-04 | 48 |
| GO:001607216 | Endometrium | EEC | rRNA metabolic process | 49/2168 | 236/18723 | 3.27e-05 | 5.62e-04 | 49 |
| GO:003447012 | Endometrium | EEC | ncRNA processing | 63/2168 | 395/18723 | 5.20e-03 | 3.26e-02 | 63 |
| GO:0022613111 | Esophagus | ESCC | ribonucleoprotein complex biogenesis | 365/8552 | 463/18723 | 1.74e-49 | 1.11e-45 | 365 |
| GO:0042254111 | Esophagus | ESCC | ribosome biogenesis | 252/8552 | 299/18723 | 3.27e-44 | 1.04e-40 | 252 |
| GO:003447015 | Esophagus | ESCC | ncRNA processing | 300/8552 | 395/18723 | 3.09e-35 | 3.26e-32 | 300 |
| GO:0016072110 | Esophagus | ESCC | rRNA metabolic process | 197/8552 | 236/18723 | 1.31e-33 | 1.18e-30 | 197 |
| GO:0006364110 | Esophagus | ESCC | rRNA processing | 189/8552 | 225/18723 | 4.88e-33 | 3.87e-30 | 189 |
| GO:003466012 | Esophagus | ESCC | ncRNA metabolic process | 346/8552 | 485/18723 | 4.35e-31 | 2.51e-28 | 346 |
| GO:014001414 | Esophagus | ESCC | mitotic nuclear division | 218/8552 | 287/18723 | 6.17e-26 | 1.78e-23 | 218 |
| GO:005165617 | Esophagus | ESCC | establishment of organelle localization | 273/8552 | 390/18723 | 9.13e-23 | 1.81e-20 | 273 |
| GO:000007011 | Esophagus | ESCC | mitotic sister chromatid segregation | 138/8552 | 168/18723 | 1.37e-22 | 2.63e-20 | 138 |
| GO:00008194 | Esophagus | ESCC | sister chromatid segregation | 157/8552 | 202/18723 | 8.41e-21 | 1.33e-18 | 157 |
| GO:000705911 | Esophagus | ESCC | chromosome segregation | 238/8552 | 346/18723 | 1.72e-18 | 1.82e-16 | 238 |
| GO:0071826111 | Esophagus | ESCC | ribonucleoprotein complex subunit organization | 166/8552 | 227/18723 | 2.94e-17 | 2.42e-15 | 166 |
| Page: 1 2 3 4 5 6 7 8 9 10 11 12 |
| Pathway ID | Tissue | Disease Stage | Description | Gene Ratio | Bg Ratio | pvalue | p.adjust | qvalue | Count |
| Page: 1 |
Top |
Cell-cell communication analysis |
| Identification of potential cell-cell interactions between two cell types and their ligand-receptor pairs for different disease states |
| Ligand | Receptor | LRpair | Pathway | Tissue | Disease Stage |
| Page: 1 |
Top |
Single-cell gene regulatory network inference analysis |
| Find out the significant the regulons (TFs) and the target genes of each regulon across cell types for different disease states |
| TF | Cell Type | Tissue | Disease Stage | Target Gene | RSS | Regulon Activity |
| ∗The dot plots of a searched regulon are shown for all cell subpopulations in each disease state of each tissue based on the regulon specific score inferred using pySCENIC and by calculating the average expression. |
| Page: 1 |
Top |
Somatic mutation of malignant transformation related genes |
| Annotation of somatic variants for genes involved in malignant transformation |
| Hugo Symbol | Variant Class | Variant Classification | dbSNP RS | HGVSc | HGVSp | HGVSp Short | SWISSPROT | BIOTYPE | SIFT | PolyPhen | Tumor Sample Barcode | Tissue | Histology | Sex | Age | Stage | Therapy Types | Drugs | Outcome |
| MDN1 | SNV | Missense_Mutation | novel | c.14416N>C | p.Asp4806His | p.D4806H | Q9NU22 | protein_coding | deleterious(0) | possibly_damaging(0.635) | TCGA-5L-AAT1-01 | Breast | breast invasive carcinoma | Female | <65 | III/IV | Hormone Therapy | letrozol | SD |
| MDN1 | SNV | Missense_Mutation | c.1267N>T | p.Leu423Phe | p.L423F | Q9NU22 | protein_coding | deleterious(0) | probably_damaging(0.981) | TCGA-A2-A04T-01 | Breast | breast invasive carcinoma | Female | <65 | I/II | Chemotherapy | cyclophosphamide | SD | |
| MDN1 | SNV | Missense_Mutation | c.14490G>C | p.Lys4830Asn | p.K4830N | Q9NU22 | protein_coding | tolerated(0.17) | benign(0.01) | TCGA-A2-A04W-01 | Breast | breast invasive carcinoma | Female | <65 | I/II | Chemotherapy | cytoxan | SD | |
| MDN1 | SNV | Missense_Mutation | c.6601G>C | p.Glu2201Gln | p.E2201Q | Q9NU22 | protein_coding | tolerated(0.18) | benign(0.097) | TCGA-A8-A06R-01 | Breast | breast invasive carcinoma | Female | >=65 | I/II | Chemotherapy | 5-fluorouracil | CR | |
| MDN1 | SNV | Missense_Mutation | c.16616A>G | p.Asp5539Gly | p.D5539G | Q9NU22 | protein_coding | deleterious(0) | probably_damaging(0.996) | TCGA-A8-A081-01 | Breast | breast invasive carcinoma | Female | >=65 | I/II | Unknown | Unknown | SD | |
| MDN1 | SNV | Missense_Mutation | c.12696N>T | p.Leu4232Phe | p.L4232F | Q9NU22 | protein_coding | deleterious(0.05) | probably_damaging(0.997) | TCGA-A8-A095-01 | Breast | breast invasive carcinoma | Female | <65 | I/II | Chemotherapy | 5-fluorouracil | CR | |
| MDN1 | SNV | Missense_Mutation | rs748817931 | c.11174N>A | p.Arg3725Gln | p.R3725Q | Q9NU22 | protein_coding | tolerated(0.17) | benign(0.009) | TCGA-A8-A09Z-01 | Breast | breast invasive carcinoma | Female | >=65 | I/II | Unknown | Unknown | SD |
| MDN1 | SNV | Missense_Mutation | c.11986G>C | p.Glu3996Gln | p.E3996Q | Q9NU22 | protein_coding | tolerated(0.08) | benign(0.079) | TCGA-AC-A23H-01 | Breast | breast invasive carcinoma | Female | >=65 | I/II | Unknown | Unknown | PD | |
| MDN1 | SNV | Missense_Mutation | c.10722C>A | p.Phe3574Leu | p.F3574L | Q9NU22 | protein_coding | tolerated(0.25) | benign(0.212) | TCGA-AC-A23H-01 | Breast | breast invasive carcinoma | Female | >=65 | I/II | Unknown | Unknown | PD | |
| MDN1 | SNV | Missense_Mutation | c.9646G>C | p.Glu3216Gln | p.E3216Q | Q9NU22 | protein_coding | tolerated(0.26) | benign(0.007) | TCGA-AC-A23H-01 | Breast | breast invasive carcinoma | Female | >=65 | I/II | Unknown | Unknown | PD |
| Page: 1 2 3 4 5 6 7 8 9 10 11 12 13 14 15 16 17 18 19 20 21 22 23 24 25 26 27 28 29 30 31 32 33 34 35 36 37 38 39 40 41 42 43 44 45 46 47 48 49 50 51 52 53 54 55 |
Top |
Related drugs of malignant transformation related genes |
| Identification of chemicals and drugs interact with genes involved in malignant transfromation |
| (DGIdb 4.0) |
| Entrez ID | Symbol | Category | Interaction Types | Drug Claim Name | Drug Name | PMIDs |
| Page: 1 |

Copyright 2023-Present -The University of Texas Health Science Center at Houston |