
|
|||||
|
 | |
| |
| |
| |
| |
| |
|
Gene: MAPKAPK3 |
Gene summary for MAPKAPK3 |
| Gene information | Species | Human | Gene symbol | MAPKAPK3 | Gene ID | 7867 |
| Gene name | MAPK activated protein kinase 3 | |
| Gene Alias | 3PK | |
| Cytomap | 3p21.2 | |
| Gene Type | protein-coding | GO ID | GO:0000165 | UniProtAcc | A0A024R2W7 |
Top |
Malignant transformation analysis |
| Identification of the aberrant gene expression in precancerous and cancerous lesions by comparing the gene expression of stem-like cells in diseased tissues with normal stem cells |
| Entrez ID | Symbol | Replicates | Species | Organ | Tissue | Adj P-value | Log2FC | Malignancy |
| 7867 | MAPKAPK3 | LZE4T | Human | Esophagus | ESCC | 6.94e-03 | 9.99e-02 | 0.0811 |
| 7867 | MAPKAPK3 | LZE22T | Human | Esophagus | ESCC | 1.17e-02 | 1.89e-01 | 0.068 |
| 7867 | MAPKAPK3 | LZE24T | Human | Esophagus | ESCC | 3.76e-07 | 1.36e-01 | 0.0596 |
| 7867 | MAPKAPK3 | LZE6T | Human | Esophagus | ESCC | 1.14e-02 | 2.04e-01 | 0.0845 |
| 7867 | MAPKAPK3 | P2T-E | Human | Esophagus | ESCC | 3.32e-11 | 1.18e-01 | 0.1177 |
| 7867 | MAPKAPK3 | P4T-E | Human | Esophagus | ESCC | 7.49e-08 | 2.71e-01 | 0.1323 |
| 7867 | MAPKAPK3 | P5T-E | Human | Esophagus | ESCC | 2.30e-04 | 1.03e-01 | 0.1327 |
| 7867 | MAPKAPK3 | P8T-E | Human | Esophagus | ESCC | 5.02e-07 | 5.04e-02 | 0.0889 |
| 7867 | MAPKAPK3 | P9T-E | Human | Esophagus | ESCC | 1.08e-05 | 9.33e-02 | 0.1131 |
| 7867 | MAPKAPK3 | P10T-E | Human | Esophagus | ESCC | 7.94e-10 | 7.22e-02 | 0.116 |
| 7867 | MAPKAPK3 | P11T-E | Human | Esophagus | ESCC | 1.01e-02 | 2.32e-01 | 0.1426 |
| 7867 | MAPKAPK3 | P12T-E | Human | Esophagus | ESCC | 1.94e-14 | 2.34e-01 | 0.1122 |
| 7867 | MAPKAPK3 | P15T-E | Human | Esophagus | ESCC | 6.25e-08 | 1.74e-01 | 0.1149 |
| 7867 | MAPKAPK3 | P16T-E | Human | Esophagus | ESCC | 3.41e-13 | 2.37e-01 | 0.1153 |
| 7867 | MAPKAPK3 | P17T-E | Human | Esophagus | ESCC | 2.83e-04 | 2.37e-01 | 0.1278 |
| 7867 | MAPKAPK3 | P20T-E | Human | Esophagus | ESCC | 1.60e-09 | 1.03e-01 | 0.1124 |
| 7867 | MAPKAPK3 | P21T-E | Human | Esophagus | ESCC | 7.11e-27 | 5.70e-01 | 0.1617 |
| 7867 | MAPKAPK3 | P22T-E | Human | Esophagus | ESCC | 7.45e-18 | 1.67e-01 | 0.1236 |
| 7867 | MAPKAPK3 | P23T-E | Human | Esophagus | ESCC | 2.01e-12 | 2.74e-01 | 0.108 |
| 7867 | MAPKAPK3 | P24T-E | Human | Esophagus | ESCC | 4.11e-17 | 3.30e-01 | 0.1287 |
| Page: 1 2 3 4 5 |
| Tissue | Expression Dynamics | Abbreviation |
| Esophagus |  | ESCC: Esophageal squamous cell carcinoma |
| HGIN: High-grade intraepithelial neoplasias | ||
| LGIN: Low-grade intraepithelial neoplasias | ||
| Liver |  | HCC: Hepatocellular carcinoma |
| NAFLD: Non-alcoholic fatty liver disease | ||
| Oral Cavity | 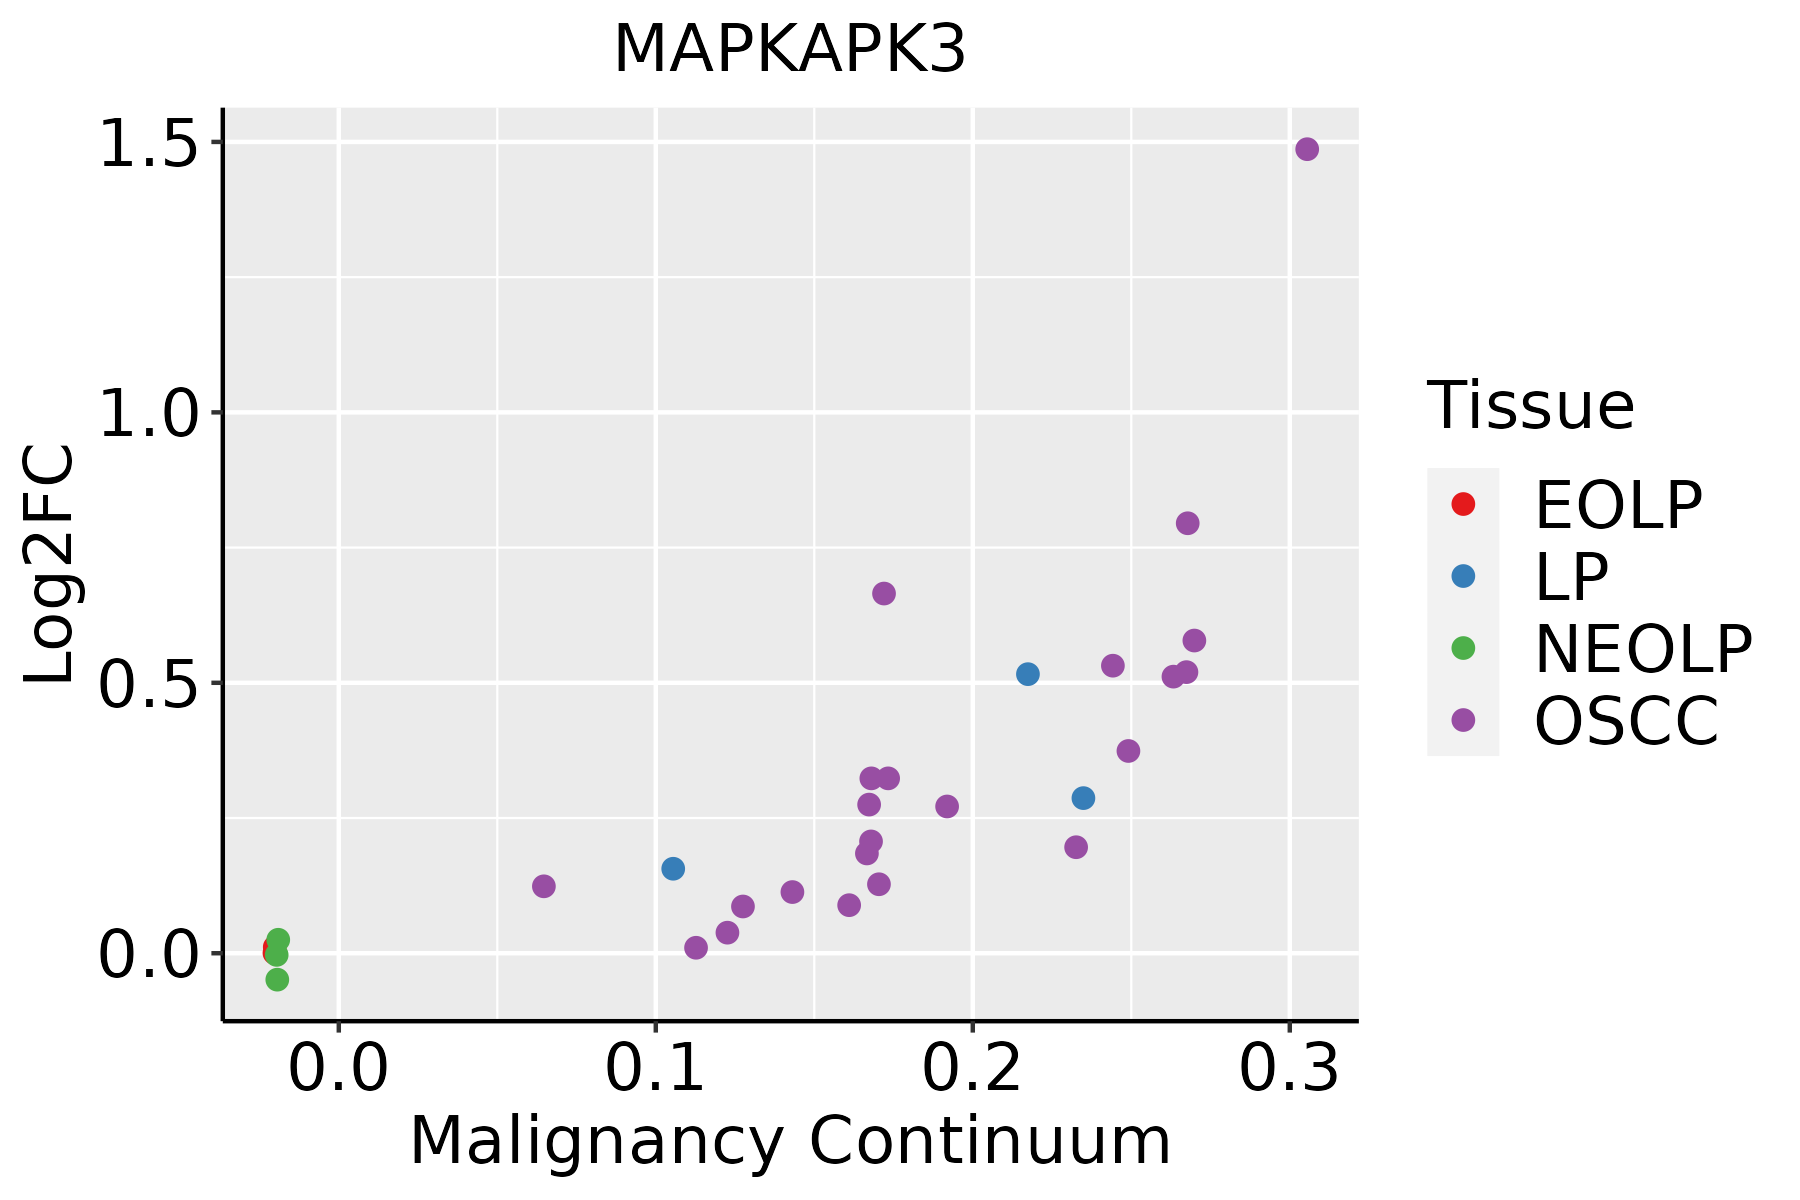 | EOLP: Erosive Oral lichen planus |
| LP: leukoplakia | ||
| NEOLP: Non-erosive oral lichen planus | ||
| OSCC: Oral squamous cell carcinoma | ||
| Skin | 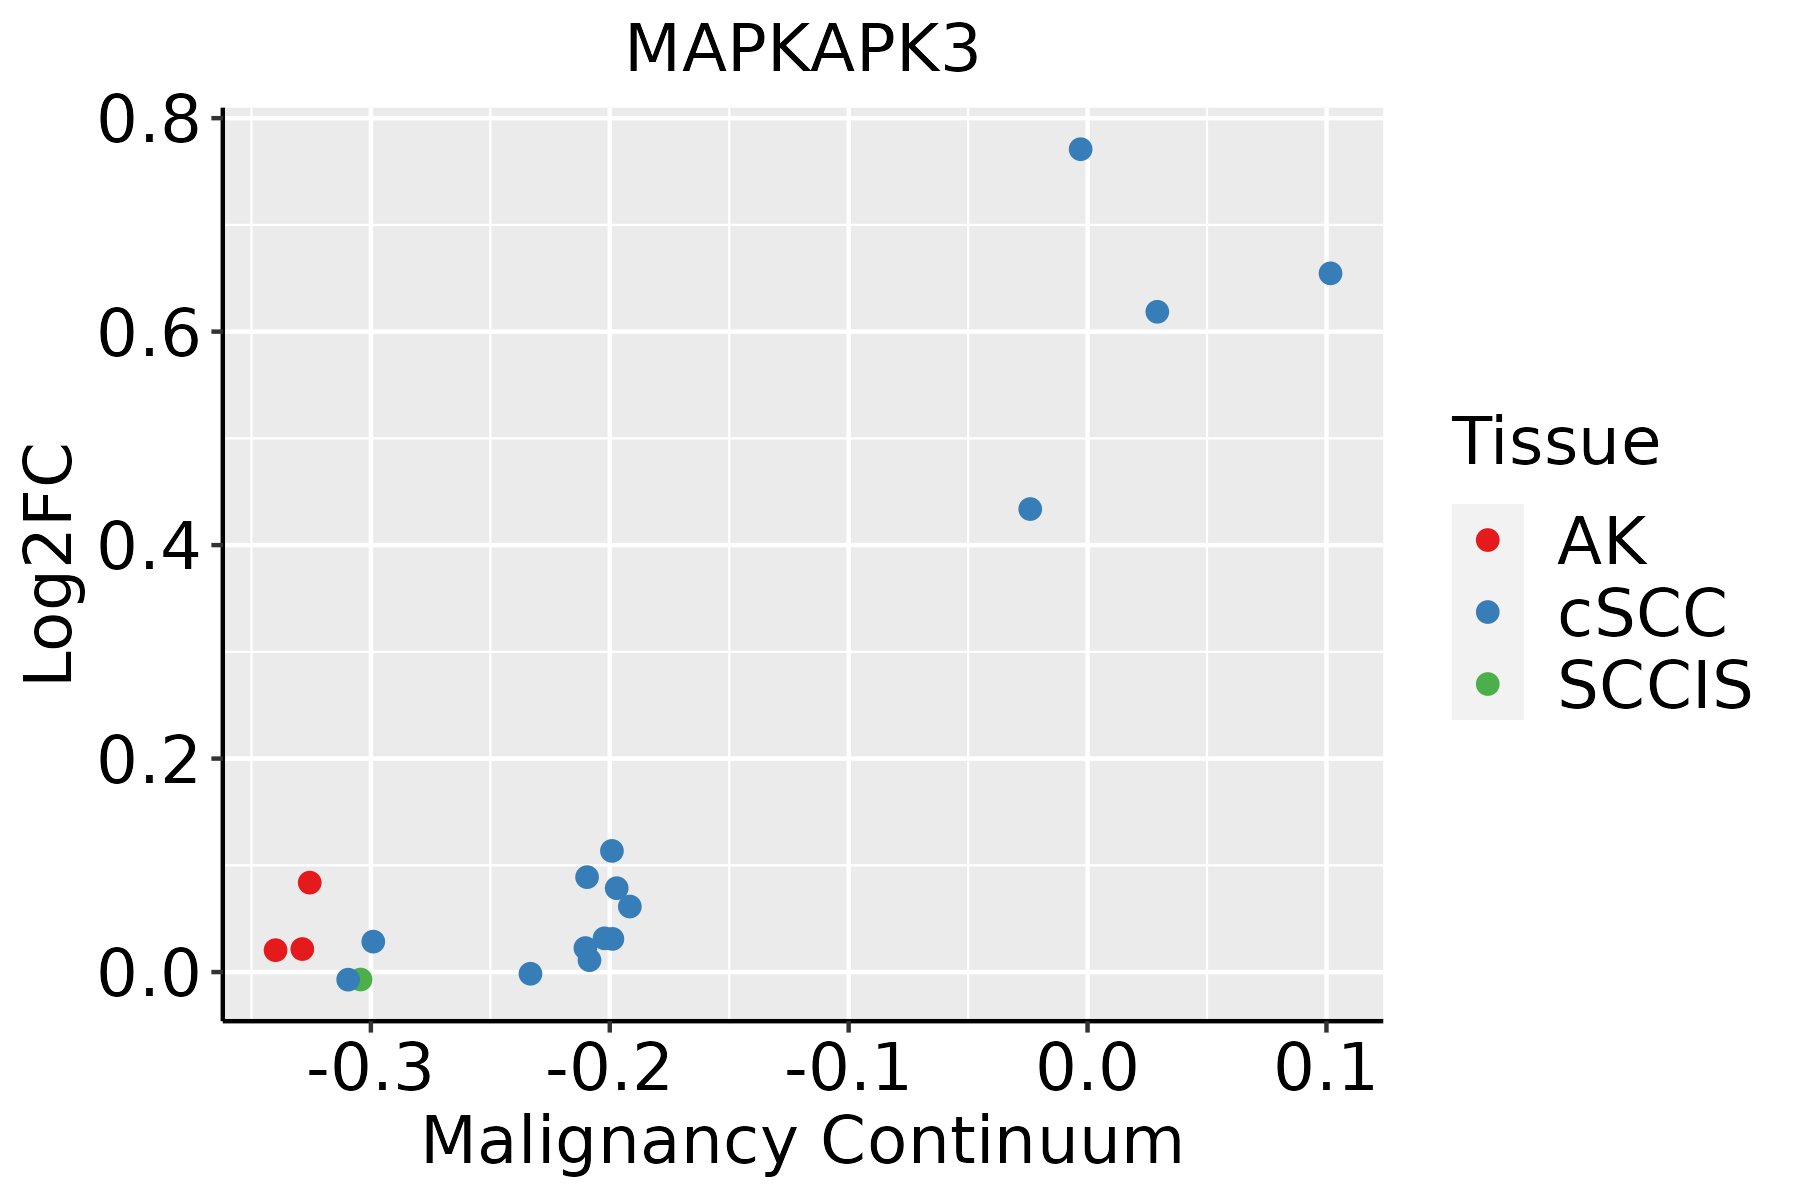 | AK: Actinic keratosis |
| cSCC: Cutaneous squamous cell carcinoma | ||
| SCCIS:squamous cell carcinoma in situ | ||
| Thyroid | 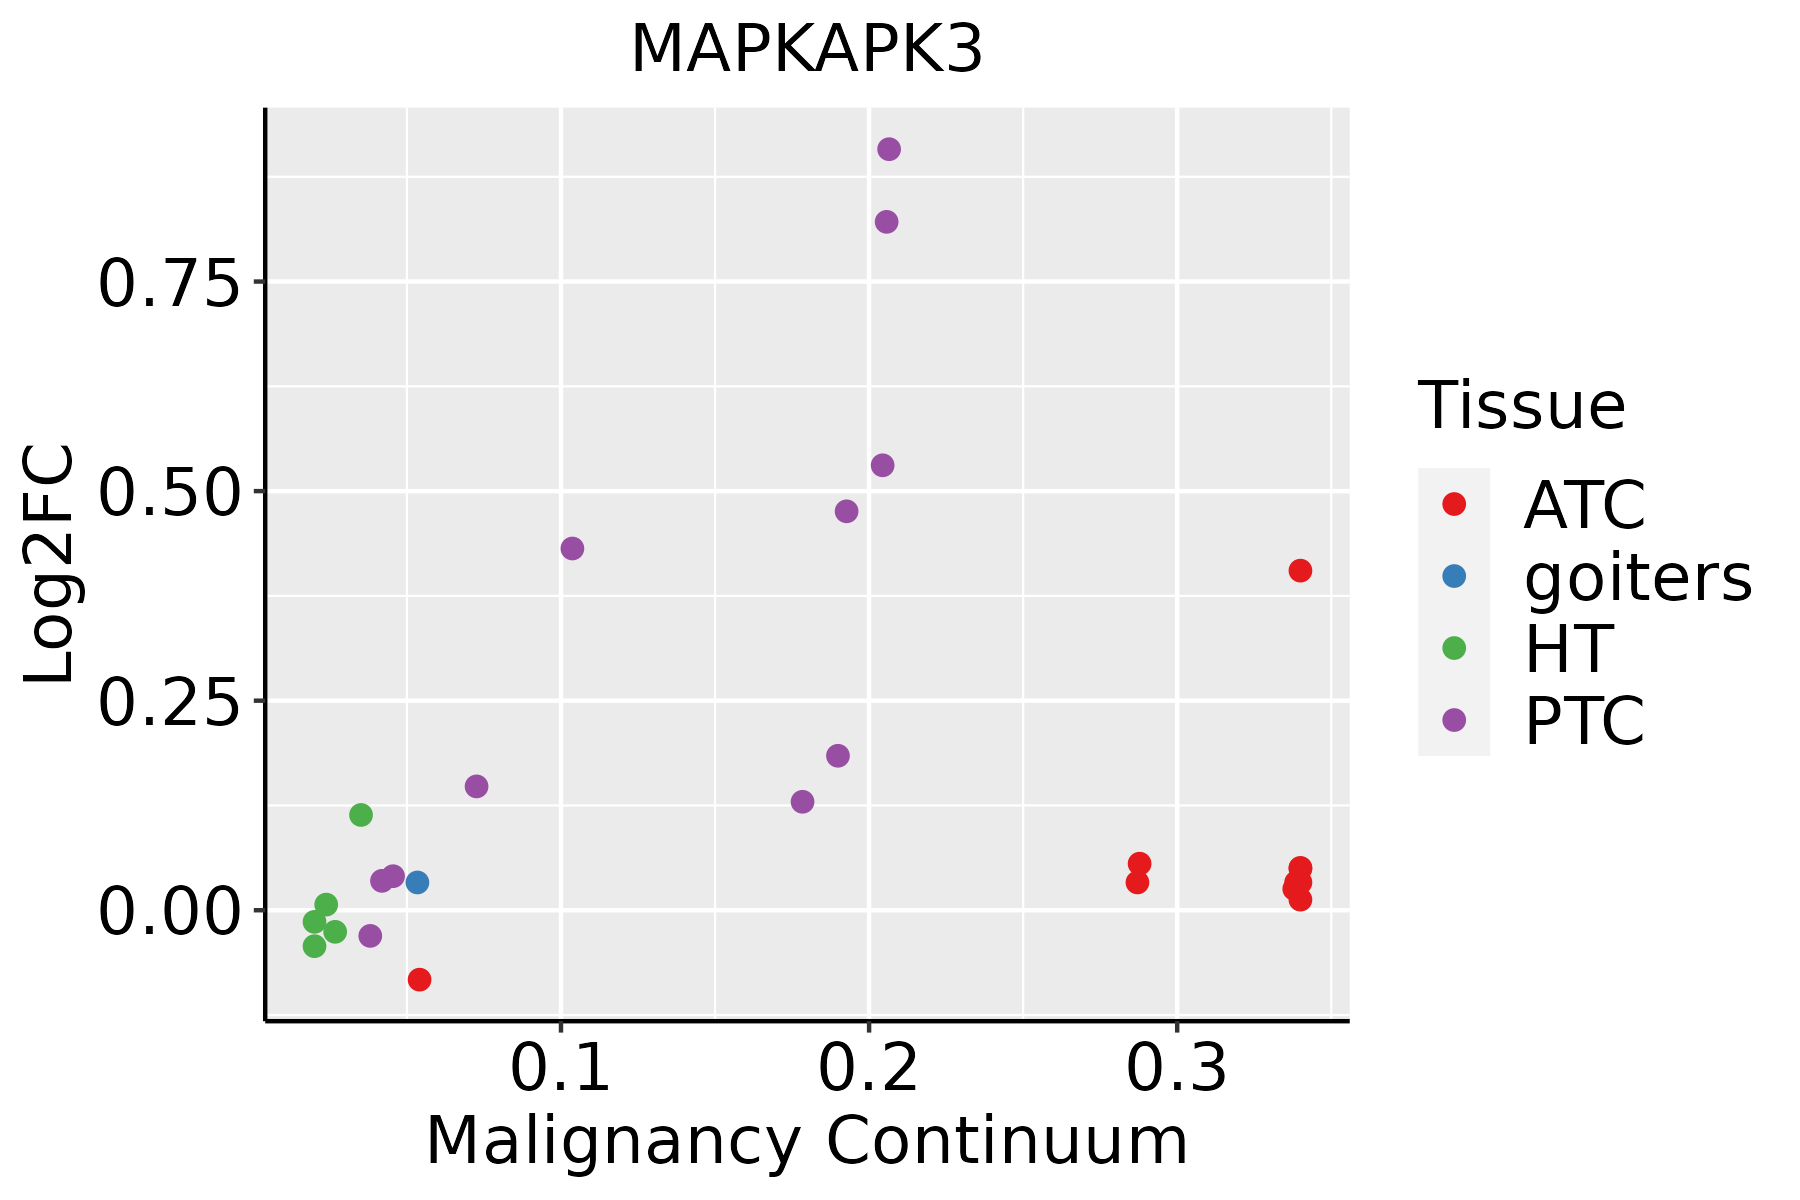 | ATC: Anaplastic thyroid cancer |
| HT: Hashimoto's thyroiditis | ||
| PTC: Papillary thyroid cancer |
| ∗log2FC in expression of this searched gene in stem-like cells from each diseased tissue sample relative to stem-like cells in normal samples in each tissue plotted against the malignancy continuum. Samples are colored based on if they are from different disease stage. |
Top |
Malignant transformation related pathway analysis |
| Find out the enriched GO biological processes and KEGG pathways involved in transition from healthy to precancer to cancer |
| Tissue | Disease Stage | Enriched GO biological Processes |
| Colorectum | AD |  |
| Colorectum | SER |  |
| Colorectum | MSS |  |
| Colorectum | MSI-H |  |
| Colorectum | FAP |  |
| ∗Top 15 enriched GO BP terms are showed in the bar plot of each disease state in each tissue. Each row represents a significant GO biological process which is colored according to the -log10(p.adjust). |
| Page: 1 2 3 4 5 6 7 8 9 |
| GO ID | Tissue | Disease Stage | Description | Gene Ratio | Bg Ratio | pvalue | p.adjust | Count |
| GO:00069072 | Oral cavity | OSCC | pinocytosis | 16/7305 | 22/18723 | 1.40e-03 | 6.79e-03 | 16 |
| GO:00022243 | Oral cavity | OSCC | toll-like receptor signaling pathway | 63/7305 | 121/18723 | 2.36e-03 | 1.04e-02 | 63 |
| GO:00027646 | Oral cavity | OSCC | immune response-regulating signaling pathway | 212/7305 | 468/18723 | 2.93e-03 | 1.27e-02 | 212 |
| GO:004677715 | Skin | cSCC | protein autophosphorylation | 84/4864 | 227/18723 | 1.53e-04 | 1.35e-03 | 84 |
| GO:001820923 | Skin | cSCC | peptidyl-serine modification | 108/4864 | 338/18723 | 7.73e-03 | 3.60e-02 | 108 |
| GO:004677716 | Thyroid | PTC | protein autophosphorylation | 110/5968 | 227/18723 | 1.25e-07 | 2.44e-06 | 110 |
| GO:001810518 | Thyroid | PTC | peptidyl-serine phosphorylation | 143/5968 | 315/18723 | 2.94e-07 | 5.04e-06 | 143 |
| GO:001820916 | Thyroid | PTC | peptidyl-serine modification | 151/5968 | 338/18723 | 4.61e-07 | 7.51e-06 | 151 |
| GO:00022215 | Thyroid | PTC | pattern recognition receptor signaling pathway | 77/5968 | 172/18723 | 2.56e-04 | 1.84e-03 | 77 |
| GO:00069074 | Thyroid | PTC | pinocytosis | 14/5968 | 22/18723 | 2.16e-03 | 1.15e-02 | 14 |
| GO:001810519 | Thyroid | ATC | peptidyl-serine phosphorylation | 153/6293 | 315/18723 | 2.28e-08 | 4.42e-07 | 153 |
| GO:001820917 | Thyroid | ATC | peptidyl-serine modification | 161/6293 | 338/18723 | 5.23e-08 | 9.44e-07 | 161 |
| GO:004677717 | Thyroid | ATC | protein autophosphorylation | 114/6293 | 227/18723 | 1.54e-07 | 2.49e-06 | 114 |
| GO:000222114 | Thyroid | ATC | pattern recognition receptor signaling pathway | 80/6293 | 172/18723 | 2.89e-04 | 1.84e-03 | 80 |
| GO:000690712 | Thyroid | ATC | pinocytosis | 13/6293 | 22/18723 | 1.25e-02 | 4.38e-02 | 13 |
| Page: 1 2 |
| Pathway ID | Tissue | Disease Stage | Description | Gene Ratio | Bg Ratio | pvalue | p.adjust | qvalue | Count |
| hsa0401014 | Oral cavity | OSCC | MAPK signaling pathway | 165/3704 | 302/8465 | 7.11e-05 | 2.74e-04 | 1.40e-04 | 165 |
| hsa04370 | Oral cavity | OSCC | VEGF signaling pathway | 37/3704 | 59/8465 | 2.53e-03 | 6.62e-03 | 3.37e-03 | 37 |
| hsa0401015 | Oral cavity | OSCC | MAPK signaling pathway | 165/3704 | 302/8465 | 7.11e-05 | 2.74e-04 | 1.40e-04 | 165 |
| hsa043701 | Oral cavity | OSCC | VEGF signaling pathway | 37/3704 | 59/8465 | 2.53e-03 | 6.62e-03 | 3.37e-03 | 37 |
| Page: 1 |
Top |
Cell-cell communication analysis |
| Identification of potential cell-cell interactions between two cell types and their ligand-receptor pairs for different disease states |
| Ligand | Receptor | LRpair | Pathway | Tissue | Disease Stage |
| Page: 1 |
Top |
Single-cell gene regulatory network inference analysis |
| Find out the significant the regulons (TFs) and the target genes of each regulon across cell types for different disease states |
| TF | Cell Type | Tissue | Disease Stage | Target Gene | RSS | Regulon Activity |
| ∗The dot plots of a searched regulon are shown for all cell subpopulations in each disease state of each tissue based on the regulon specific score inferred using pySCENIC and by calculating the average expression. |
| Page: 1 |
Top |
Somatic mutation of malignant transformation related genes |
| Annotation of somatic variants for genes involved in malignant transformation |
| Hugo Symbol | Variant Class | Variant Classification | dbSNP RS | HGVSc | HGVSp | HGVSp Short | SWISSPROT | BIOTYPE | SIFT | PolyPhen | Tumor Sample Barcode | Tissue | Histology | Sex | Age | Stage | Therapy Types | Drugs | Outcome |
| MAPKAPK3 | SNV | Missense_Mutation | c.405N>A | p.Asp135Glu | p.D135E | Q16644 | protein_coding | tolerated(0.2) | benign(0.072) | TCGA-BH-A18H-01 | Breast | breast invasive carcinoma | Female | <65 | I/II | Chemotherapy | adriamycin | CR | |
| MAPKAPK3 | SNV | Missense_Mutation | rs759497061 | c.335G>A | p.Arg112His | p.R112H | Q16644 | protein_coding | deleterious(0) | probably_damaging(0.939) | TCGA-2W-A8YY-01 | Cervix | cervical & endocervical cancer | Female | <65 | I/II | Chemotherapy | cisplatin | CR |
| MAPKAPK3 | SNV | Missense_Mutation | c.952G>A | p.Ala318Thr | p.A318T | Q16644 | protein_coding | tolerated(0.33) | benign(0.013) | TCGA-IR-A3LA-01 | Cervix | cervical & endocervical cancer | Female | <65 | I/II | Chemotherapy | cisplatin | CR | |
| MAPKAPK3 | SNV | Missense_Mutation | novel | c.1118N>A | p.Ser373Tyr | p.S373Y | Q16644 | protein_coding | deleterious(0.01) | benign(0.254) | TCGA-VS-A8EL-01 | Cervix | cervical & endocervical cancer | Female | <65 | I/II | Chemotherapy | cisplatin | CR |
| MAPKAPK3 | SNV | Missense_Mutation | novel | c.539A>C | p.Asp180Ala | p.D180A | Q16644 | protein_coding | deleterious(0.02) | benign(0.309) | TCGA-AA-A01I-01 | Colorectum | colon adenocarcinoma | Male | >=65 | I/II | Unknown | Unknown | SD |
| MAPKAPK3 | SNV | Missense_Mutation | rs372421280 | c.541N>A | p.Ala181Thr | p.A181T | Q16644 | protein_coding | tolerated(0.11) | benign(0.014) | TCGA-AZ-4615-01 | Colorectum | colon adenocarcinoma | Male | >=65 | III/IV | Chemotherapy | xeloda | PD |
| MAPKAPK3 | SNV | Missense_Mutation | c.1112N>A | p.Gly371Asp | p.G371D | Q16644 | protein_coding | tolerated(0.09) | benign(0.001) | TCGA-G4-6628-01 | Colorectum | colon adenocarcinoma | Male | >=65 | I/II | Unknown | Unknown | SD | |
| MAPKAPK3 | SNV | Missense_Mutation | novel | c.800A>C | p.Asn267Thr | p.N267T | Q16644 | protein_coding | tolerated(0.1) | benign(0.025) | TCGA-AJ-A3BG-01 | Endometrium | uterine corpus endometrioid carcinoma | Female | >=65 | I/II | Chemotherapy | carboplatin | PD |
| MAPKAPK3 | SNV | Missense_Mutation | c.1056N>T | p.Lys352Asn | p.K352N | Q16644 | protein_coding | deleterious(0.02) | possibly_damaging(0.87) | TCGA-AP-A0LM-01 | Endometrium | uterine corpus endometrioid carcinoma | Female | <65 | III/IV | Chemotherapy | cisplatin | SD | |
| MAPKAPK3 | SNV | Missense_Mutation | novel | c.316N>G | p.Asn106Asp | p.N106D | Q16644 | protein_coding | deleterious(0) | probably_damaging(1) | TCGA-AX-A05Z-01 | Endometrium | uterine corpus endometrioid carcinoma | Female | <65 | III/IV | Chemotherapy | adriamycin | SD |
| Page: 1 2 3 |
Top |
Related drugs of malignant transformation related genes |
| Identification of chemicals and drugs interact with genes involved in malignant transfromation |
| (DGIdb 4.0) |
| Entrez ID | Symbol | Category | Interaction Types | Drug Claim Name | Drug Name | PMIDs |
| 7867 | MAPKAPK3 | ENZYME, KINASE, SERINE THREONINE KINASE, DRUGGABLE GENOME, TRANSCRIPTION FACTOR | inhibitor | 249565857 | ||
| 7867 | MAPKAPK3 | ENZYME, KINASE, SERINE THREONINE KINASE, DRUGGABLE GENOME, TRANSCRIPTION FACTOR | LAUROGUADINE | LAUROGUADINE |
| Page: 1 |

Copyright 2023-Present -The University of Texas Health Science Center at Houston |