| Tissue | Expression Dynamics | Abbreviation |
| Cervix |  | CC: Cervix cancer |
| HSIL_HPV: HPV-infected high-grade squamous intraepithelial lesions |
| N_HPV: HPV-infected normal cervix |
| Colorectum (GSE201348) |  | FAP: Familial adenomatous polyposis |
| CRC: Colorectal cancer |
| Colorectum (HTA11) |  | AD: Adenomas |
| SER: Sessile serrated lesions |
| MSI-H: Microsatellite-high colorectal cancer |
| MSS: Microsatellite stable colorectal cancer |
| Endometrium | 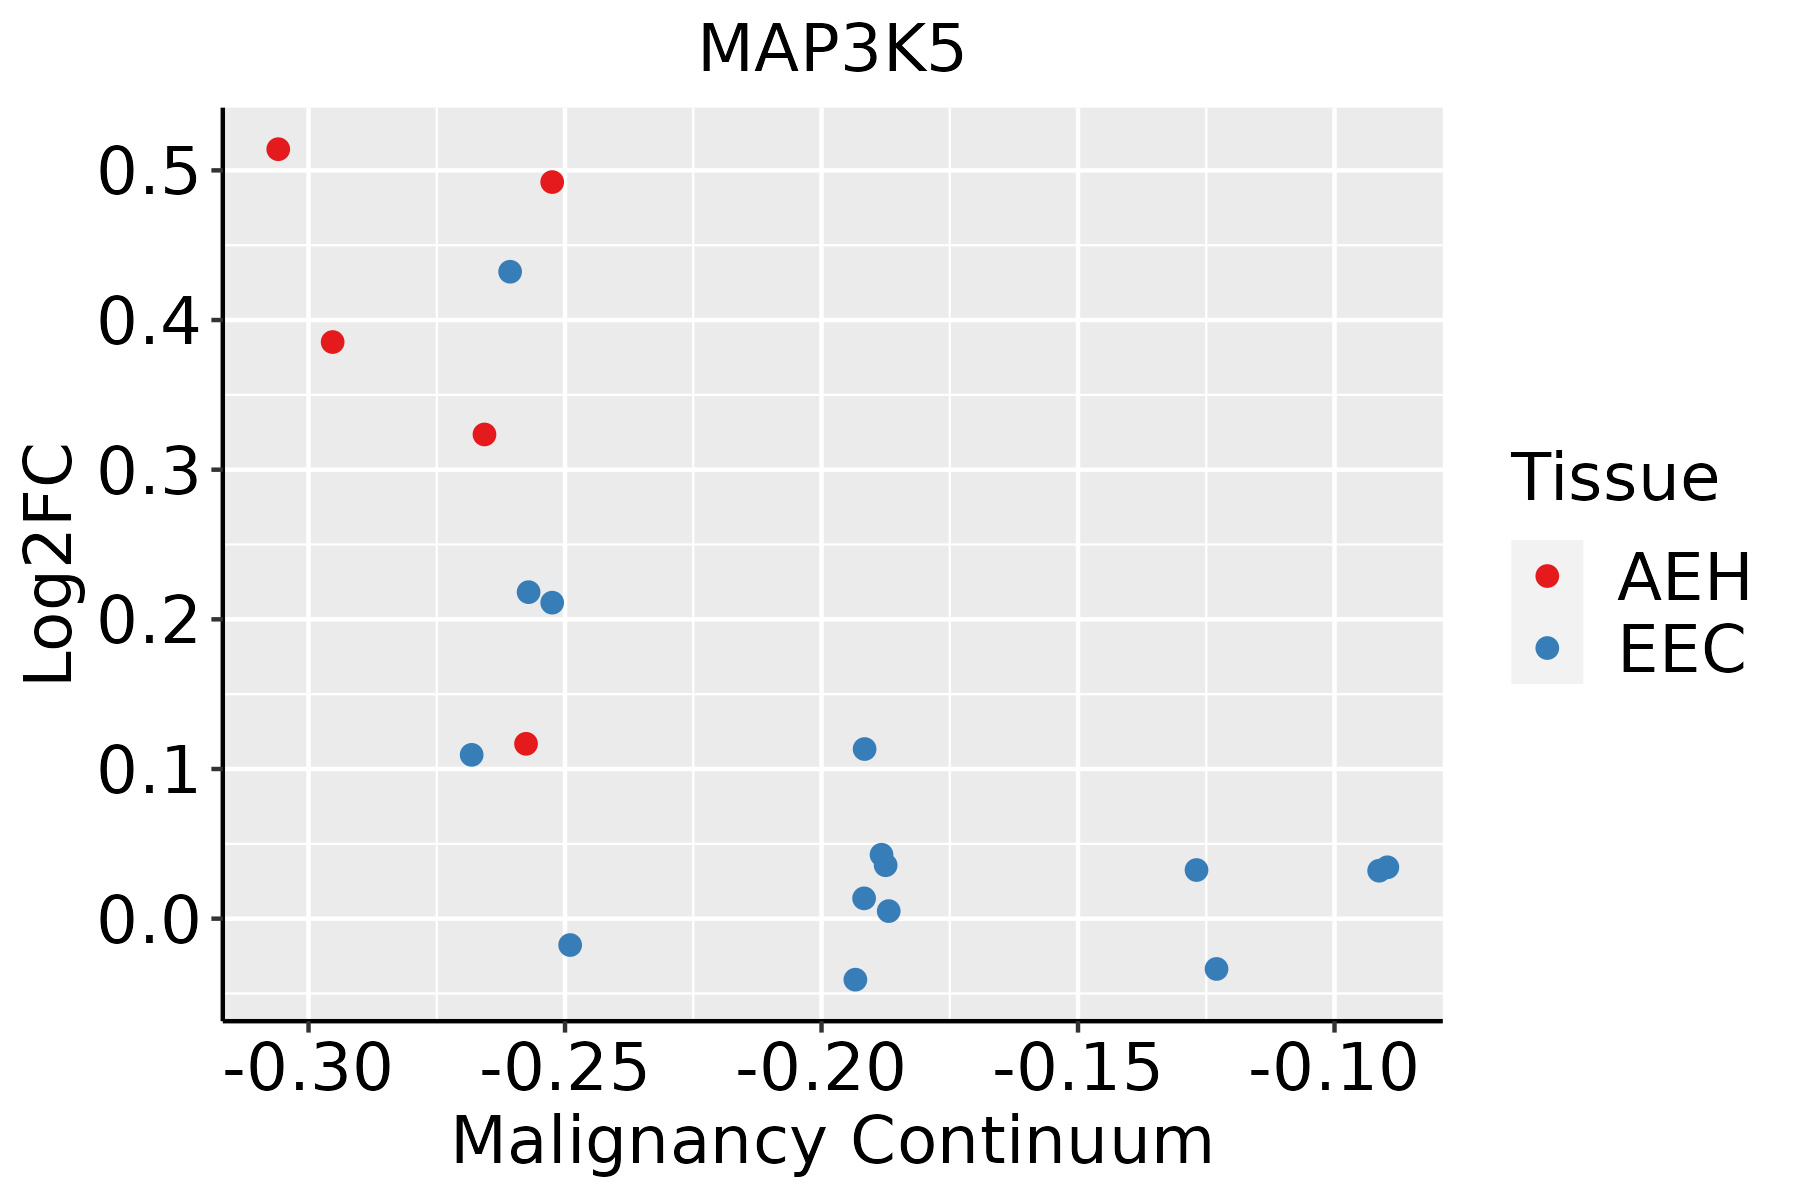 | AEH: Atypical endometrial hyperplasia |
| EEC: Endometrioid Cancer |
| Liver | 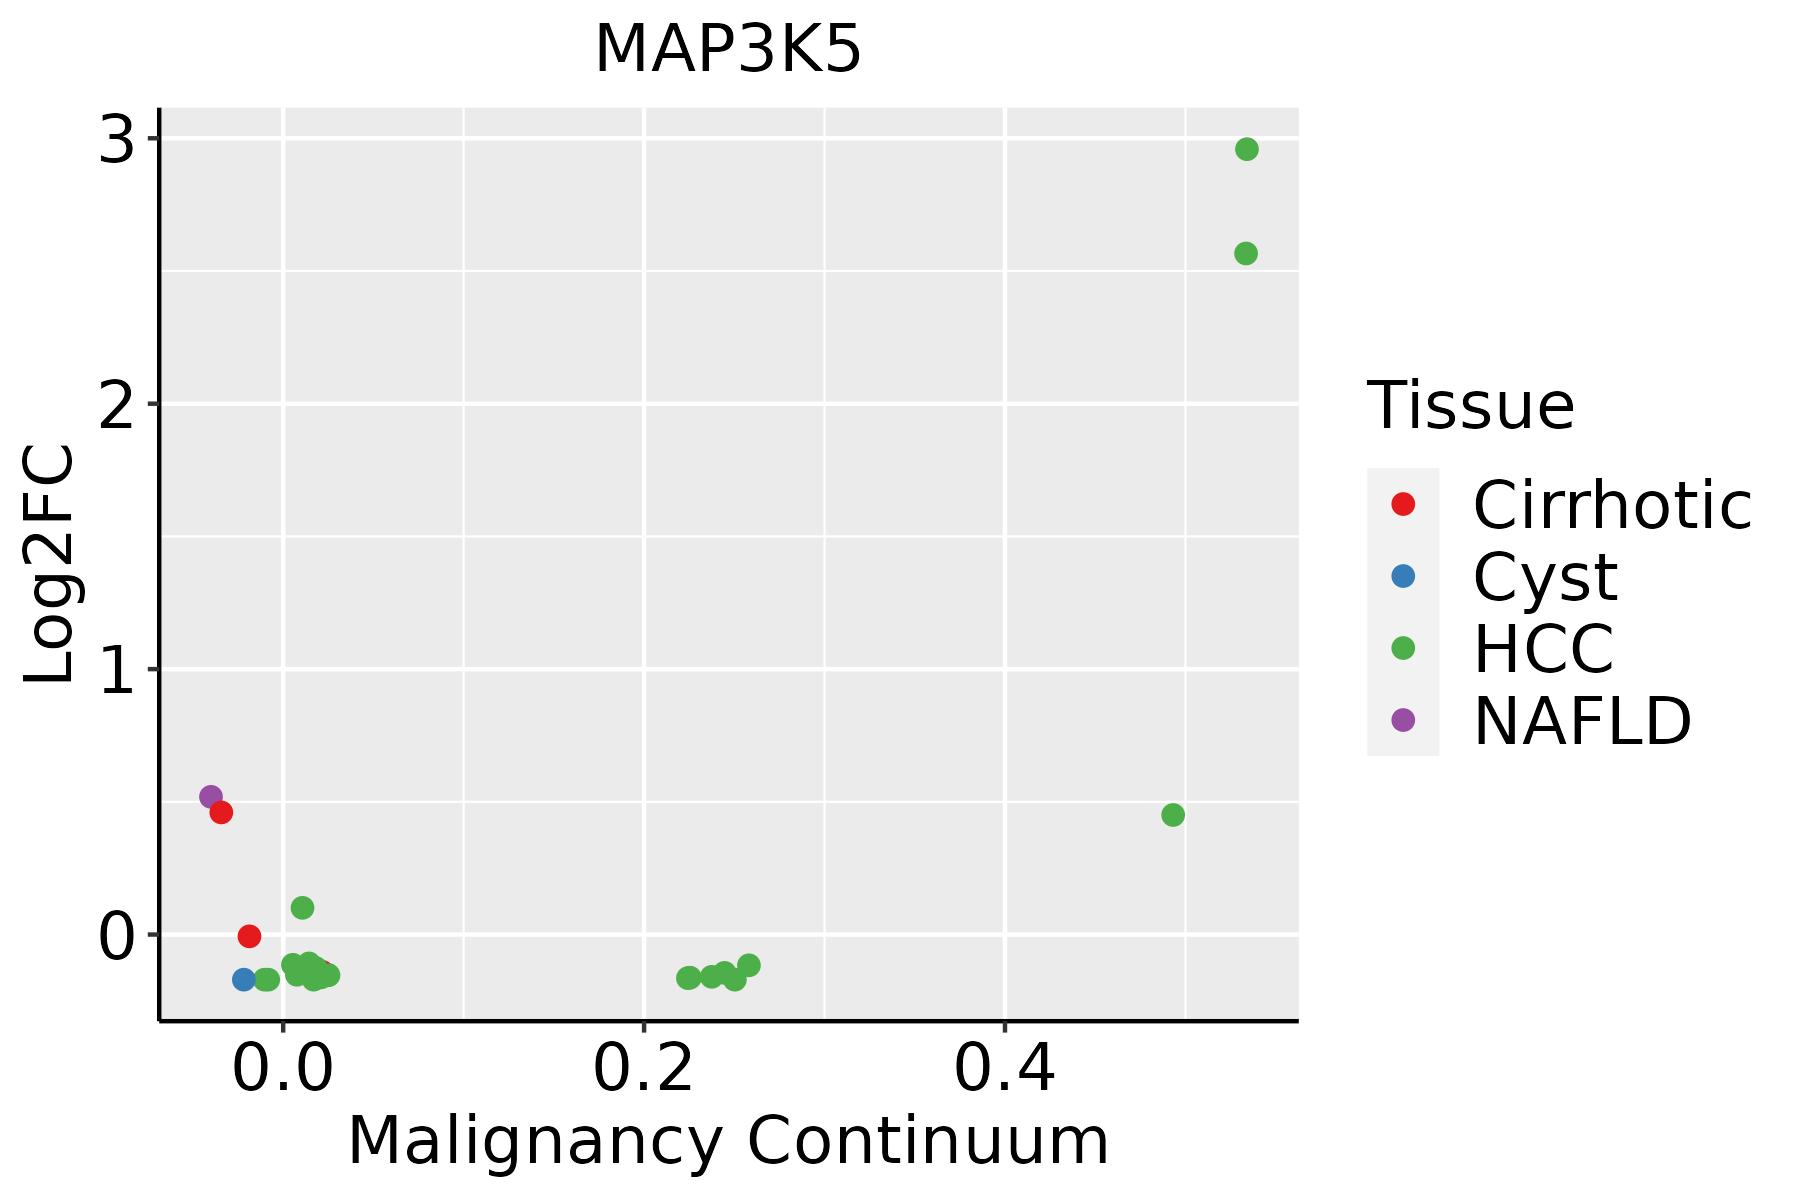 | HCC: Hepatocellular carcinoma |
| NAFLD: Non-alcoholic fatty liver disease |
| Lung | 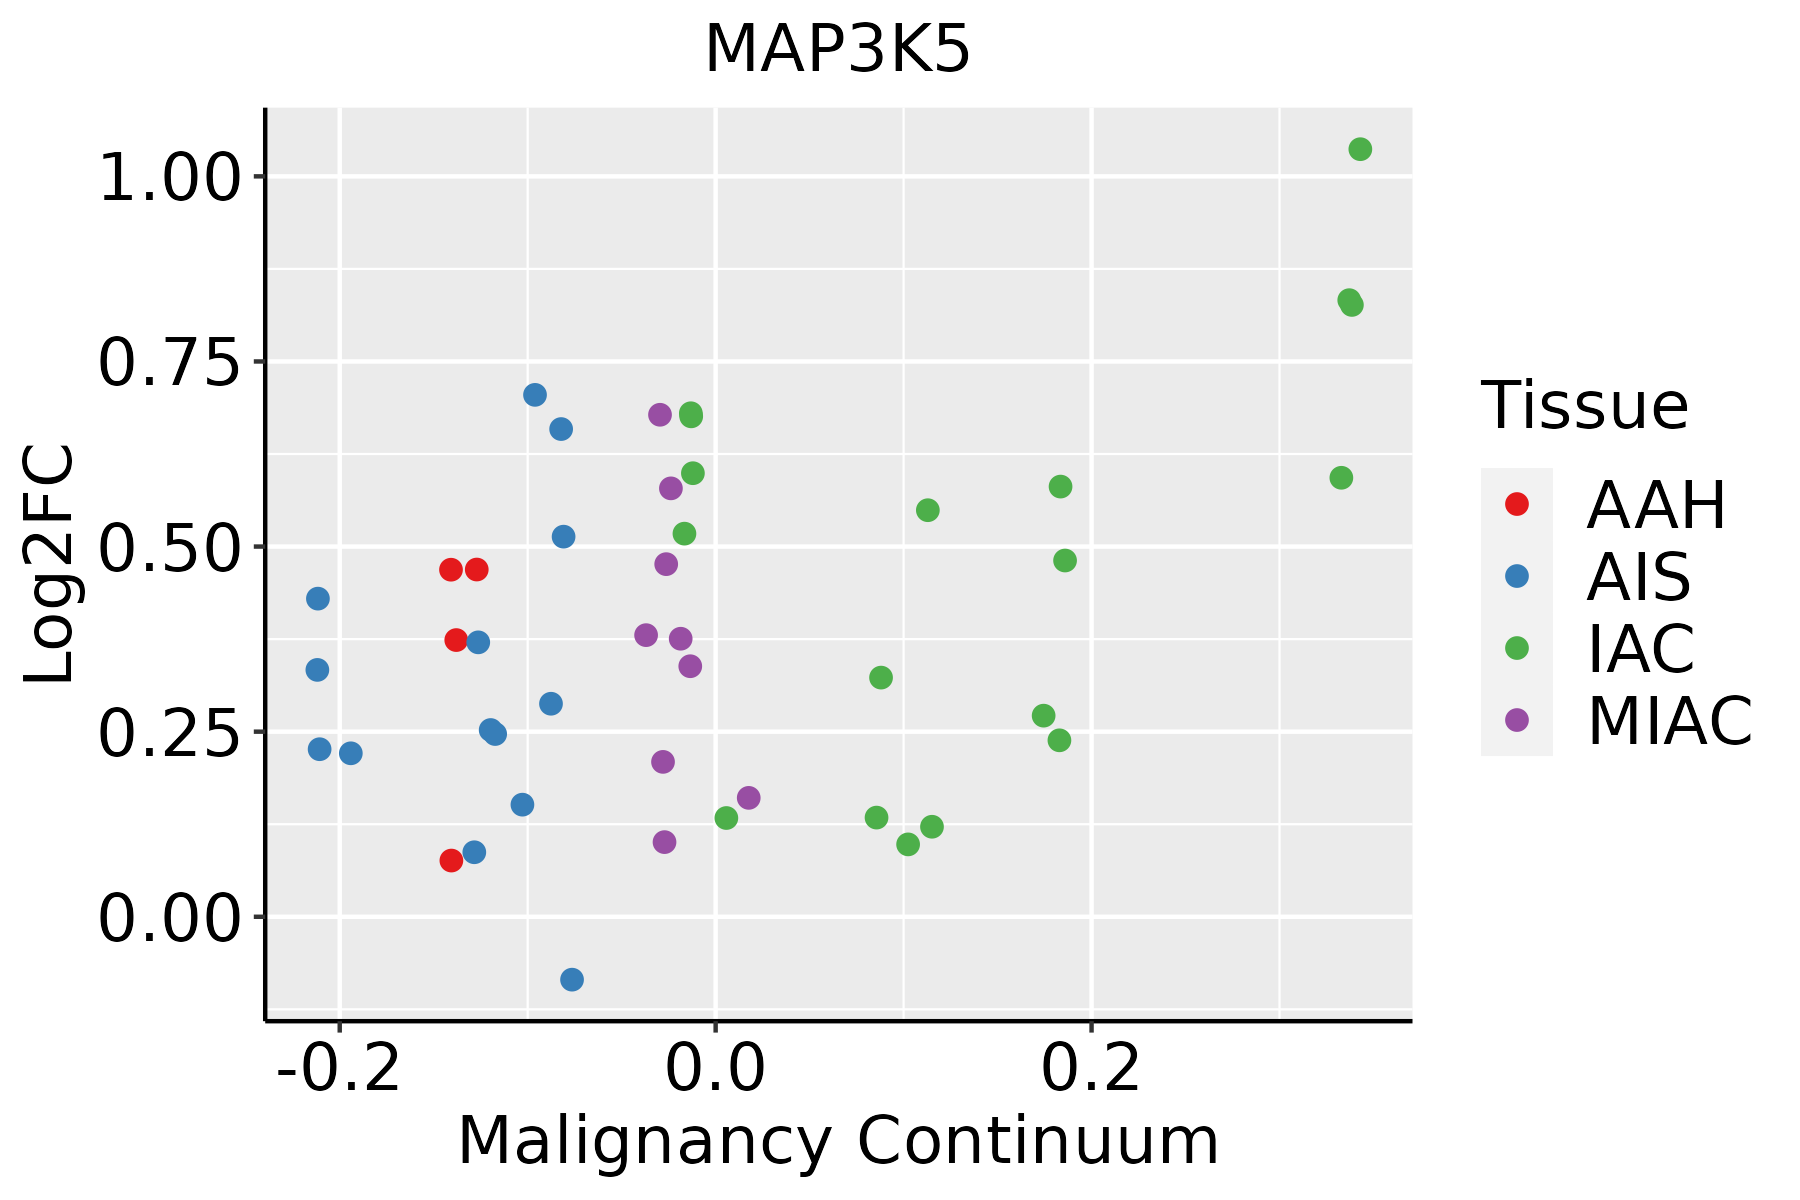 | AAH: Atypical adenomatous hyperplasia |
| AIS: Adenocarcinoma in situ |
| IAC: Invasive lung adenocarcinoma |
| MIA: Minimally invasive adenocarcinoma |
| Oral Cavity | 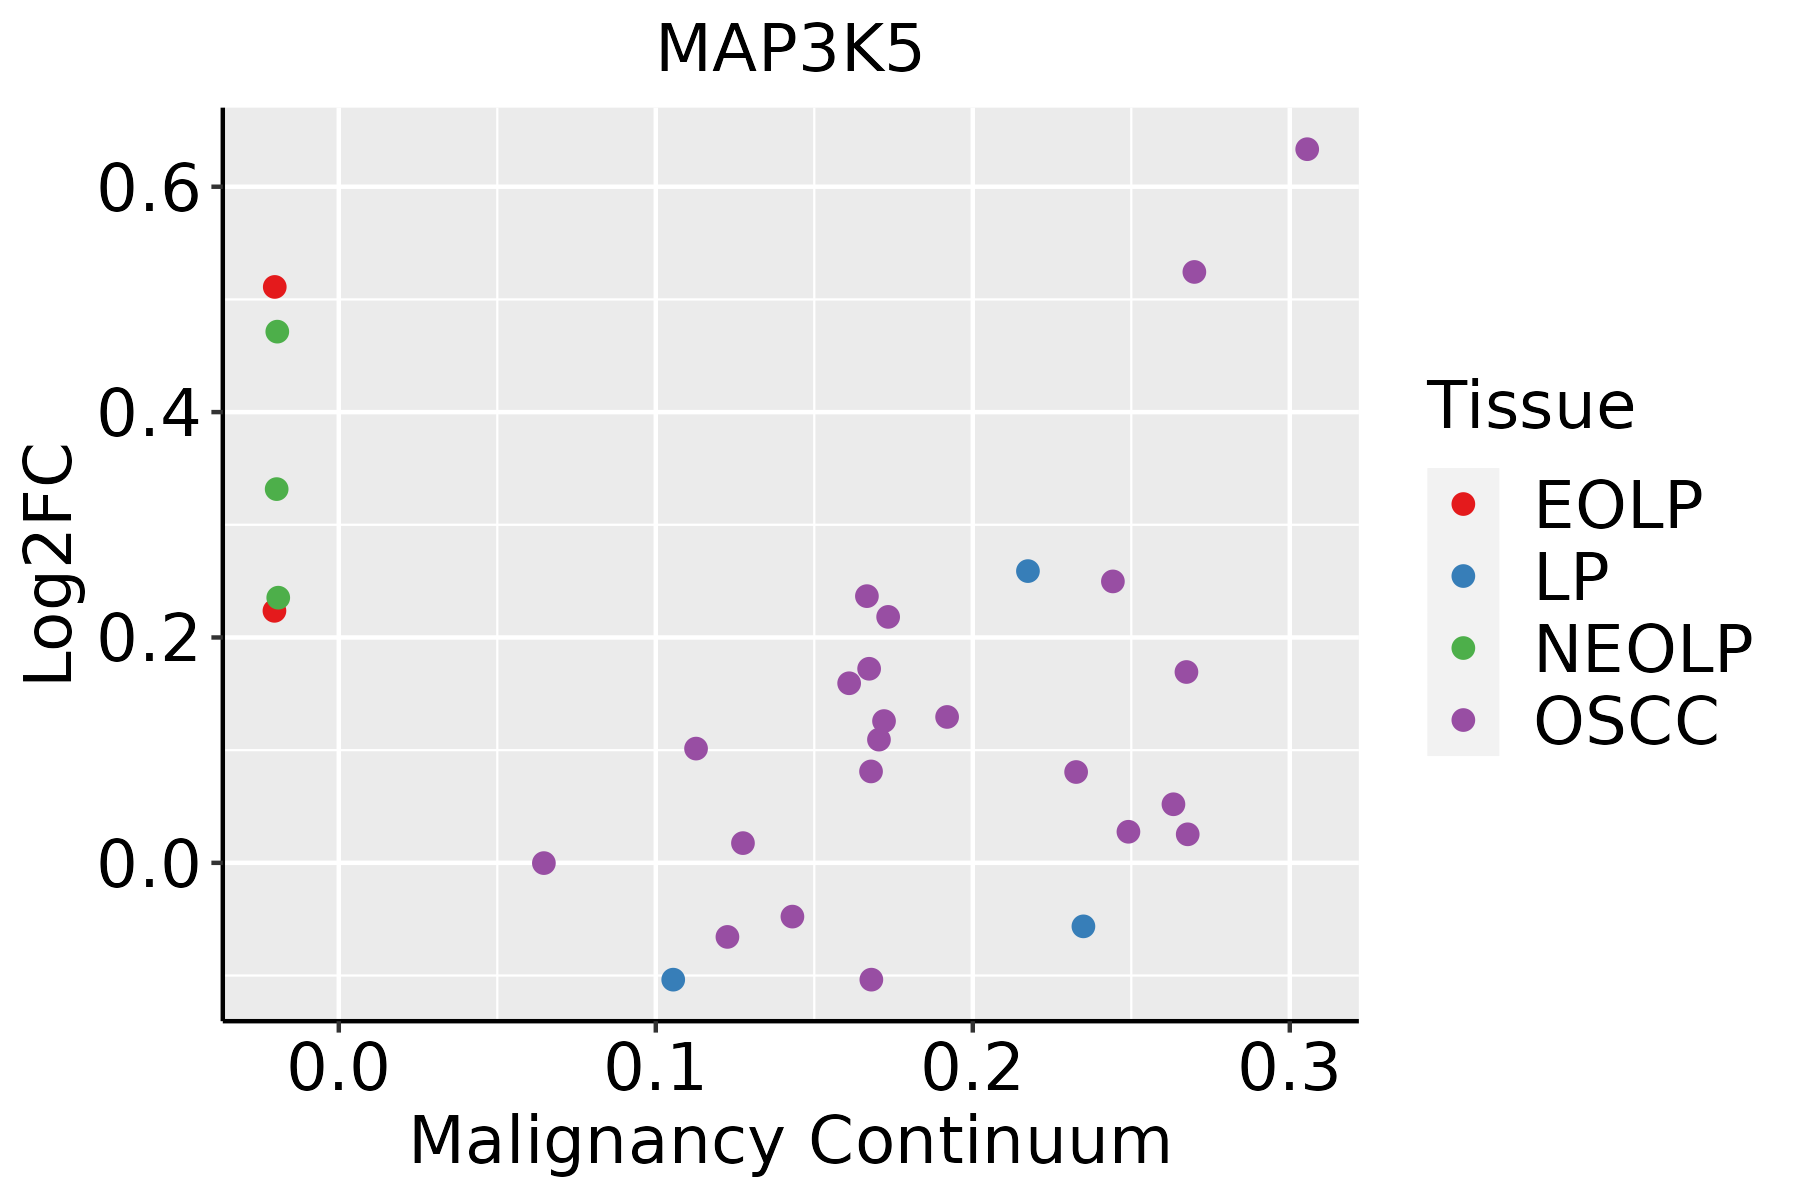 | EOLP: Erosive Oral lichen planus |
| LP: leukoplakia |
| NEOLP: Non-erosive oral lichen planus |
| OSCC: Oral squamous cell carcinoma |
| Prostate | 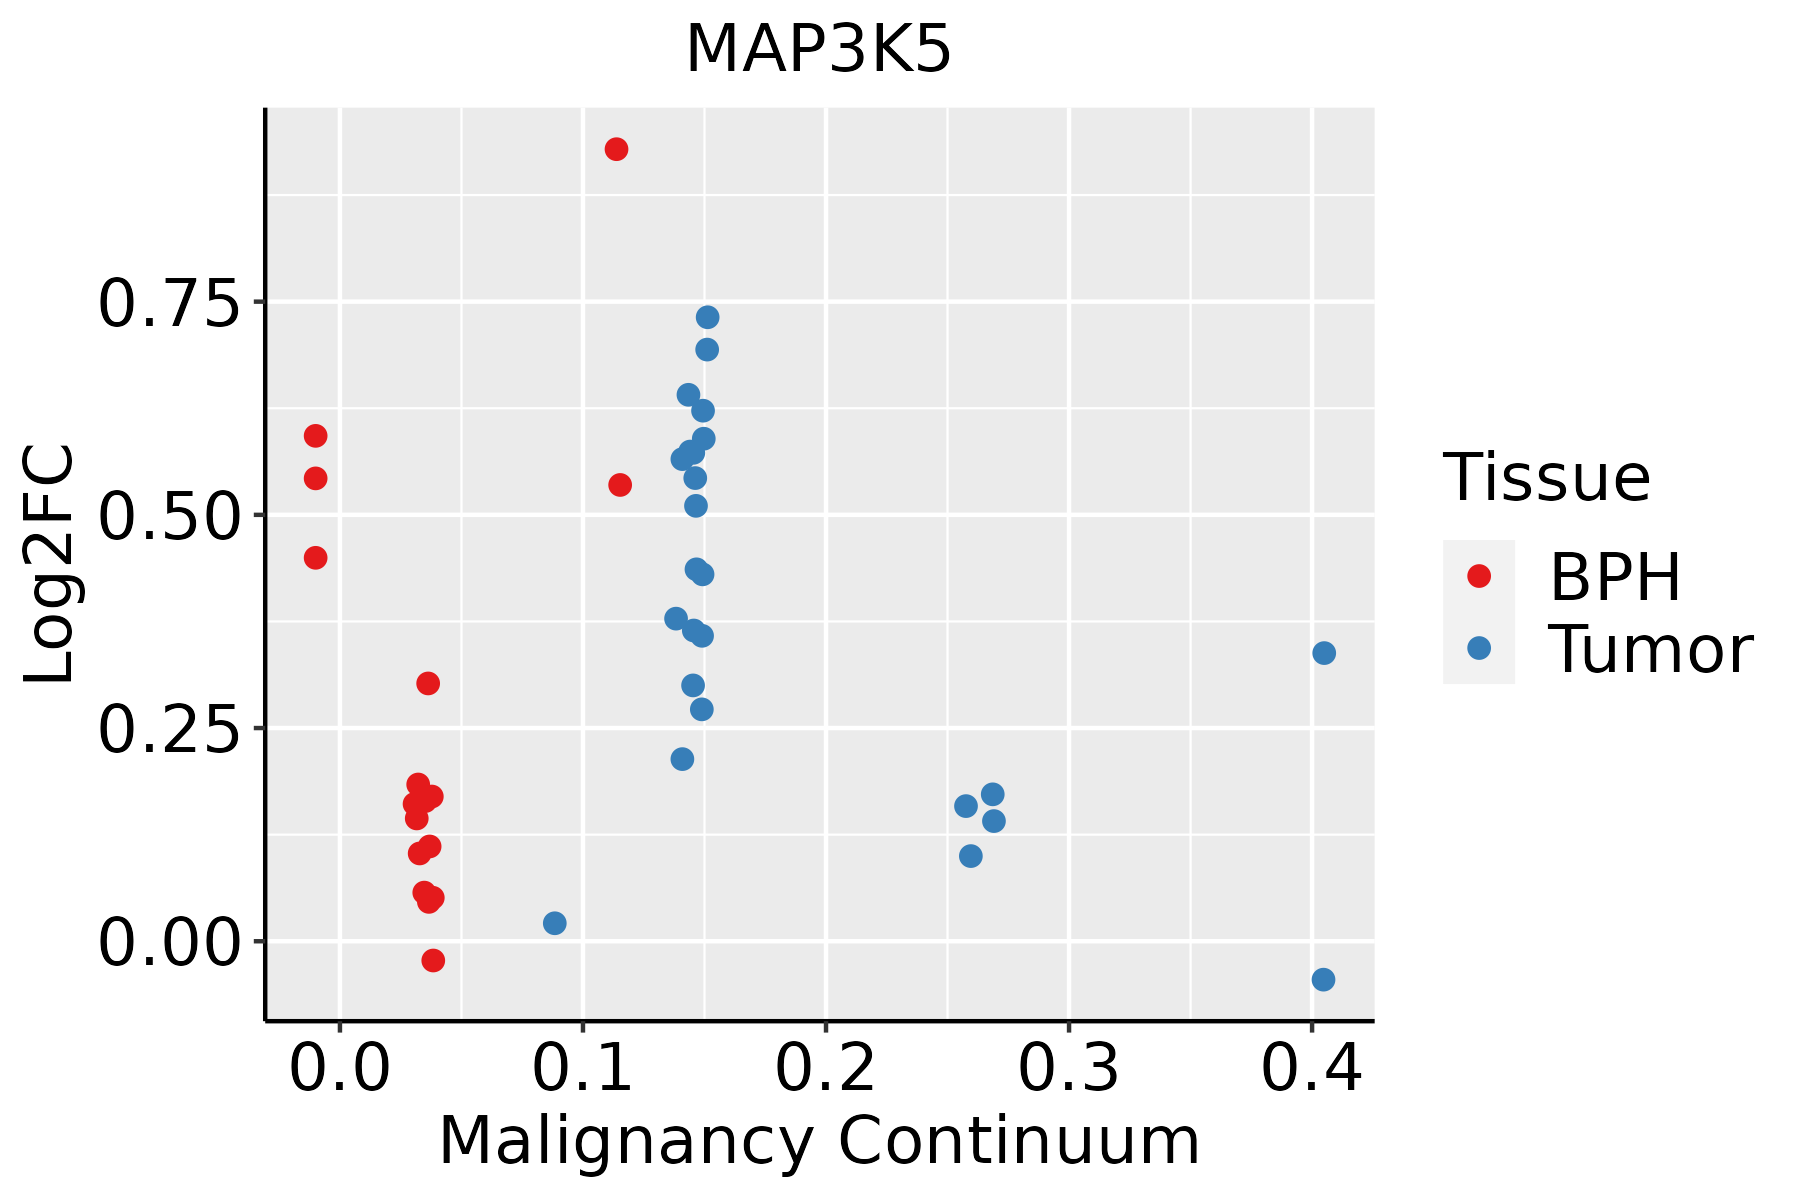 | BPH: Benign Prostatic Hyperplasia |
| Thyroid |  | ATC: Anaplastic thyroid cancer |
| HT: Hashimoto's thyroiditis |
| PTC: Papillary thyroid cancer |
| GO ID | Tissue | Disease Stage | Description | Gene Ratio | Bg Ratio | pvalue | p.adjust | Count |
| GO:00514038 | Cervix | CC | stress-activated MAPK cascade | 55/2311 | 239/18723 | 2.96e-06 | 8.31e-05 | 55 |
| GO:003459910 | Cervix | CC | cellular response to oxidative stress | 63/2311 | 288/18723 | 3.58e-06 | 9.50e-05 | 63 |
| GO:003166710 | Cervix | CC | response to nutrient levels | 92/2311 | 474/18723 | 5.80e-06 | 1.42e-04 | 92 |
| GO:003497610 | Cervix | CC | response to endoplasmic reticulum stress | 57/2311 | 256/18723 | 5.81e-06 | 1.42e-04 | 57 |
| GO:20010569 | Cervix | CC | positive regulation of cysteine-type endopeptidase activity | 38/2311 | 148/18723 | 6.94e-06 | 1.65e-04 | 38 |
| GO:00703027 | Cervix | CC | regulation of stress-activated protein kinase signaling cascade | 46/2311 | 195/18723 | 9.35e-06 | 2.11e-04 | 46 |
| GO:00092678 | Cervix | CC | cellular response to starvation | 39/2311 | 156/18723 | 1.04e-05 | 2.32e-04 | 39 |
| GO:00432809 | Cervix | CC | positive regulation of cysteine-type endopeptidase activity involved in apoptotic process | 34/2311 | 129/18723 | 1.13e-05 | 2.45e-04 | 34 |
| GO:00700599 | Cervix | CC | intrinsic apoptotic signaling pathway in response to endoplasmic reticulum stress | 21/2311 | 63/18723 | 1.18e-05 | 2.51e-04 | 21 |
| GO:00425948 | Cervix | CC | response to starvation | 46/2311 | 197/18723 | 1.24e-05 | 2.59e-04 | 46 |
| GO:00316698 | Cervix | CC | cellular response to nutrient levels | 49/2311 | 215/18723 | 1.32e-05 | 2.68e-04 | 49 |
| GO:00346129 | Cervix | CC | response to tumor necrosis factor | 55/2311 | 253/18723 | 1.75e-05 | 3.32e-04 | 55 |
| GO:00713569 | Cervix | CC | cellular response to tumor necrosis factor | 51/2311 | 229/18723 | 1.75e-05 | 3.32e-04 | 51 |
| GO:00719025 | Cervix | CC | positive regulation of protein serine/threonine kinase activity | 46/2311 | 200/18723 | 1.87e-05 | 3.47e-04 | 46 |
| GO:00075695 | Cervix | CC | cell aging | 34/2311 | 132/18723 | 1.92e-05 | 3.53e-04 | 34 |
| GO:00434104 | Cervix | CC | positive regulation of MAPK cascade | 90/2311 | 480/18723 | 2.92e-05 | 4.83e-04 | 90 |
| GO:00328727 | Cervix | CC | regulation of stress-activated MAPK cascade | 44/2311 | 192/18723 | 3.09e-05 | 5.10e-04 | 44 |
| GO:007099710 | Cervix | CC | neuron death | 70/2311 | 361/18723 | 7.50e-05 | 1.03e-03 | 70 |
| GO:190121610 | Cervix | CC | positive regulation of neuron death | 26/2311 | 97/18723 | 8.64e-05 | 1.15e-03 | 26 |
| GO:00903981 | Cervix | CC | cellular senescence | 25/2311 | 93/18723 | 1.11e-04 | 1.40e-03 | 25 |
| Pathway ID | Tissue | Disease Stage | Description | Gene Ratio | Bg Ratio | pvalue | p.adjust | qvalue | Count |
| hsa0520820 | Cervix | CC | Chemical carcinogenesis - reactive oxygen species | 92/1267 | 223/8465 | 4.71e-22 | 5.09e-20 | 3.01e-20 | 92 |
| hsa0501220 | Cervix | CC | Parkinson disease | 102/1267 | 266/8465 | 1.81e-21 | 1.47e-19 | 8.66e-20 | 102 |
| hsa0501018 | Cervix | CC | Alzheimer disease | 113/1267 | 384/8465 | 9.67e-14 | 3.92e-12 | 2.32e-12 | 113 |
| hsa0501618 | Cervix | CC | Huntington disease | 94/1267 | 306/8465 | 8.49e-13 | 3.06e-11 | 1.81e-11 | 94 |
| hsa0502218 | Cervix | CC | Pathways of neurodegeneration - multiple diseases | 128/1267 | 476/8465 | 2.87e-12 | 9.29e-11 | 5.50e-11 | 128 |
| hsa0493218 | Cervix | CC | Non-alcoholic fatty liver disease | 58/1267 | 155/8465 | 3.58e-12 | 1.05e-10 | 6.23e-11 | 58 |
| hsa0471420 | Cervix | CC | Thermogenesis | 76/1267 | 232/8465 | 4.29e-12 | 1.16e-10 | 6.85e-11 | 76 |
| hsa0501418 | Cervix | CC | Amyotrophic lateral sclerosis | 103/1267 | 364/8465 | 1.79e-11 | 4.47e-10 | 2.64e-10 | 103 |
| hsa0541820 | Cervix | CC | Fluid shear stress and atherosclerosis | 50/1267 | 139/8465 | 5.71e-10 | 1.32e-08 | 7.81e-09 | 50 |
| hsa0541720 | Cervix | CC | Lipid and atherosclerosis | 65/1267 | 215/8465 | 6.47e-09 | 1.10e-07 | 6.52e-08 | 65 |
| hsa0414120 | Cervix | CC | Protein processing in endoplasmic reticulum | 55/1267 | 174/8465 | 1.74e-08 | 2.68e-07 | 1.58e-07 | 55 |
| hsa0453020 | Cervix | CC | Tight junction | 49/1267 | 169/8465 | 1.87e-06 | 1.78e-05 | 1.05e-05 | 49 |
| hsa0407110 | Cervix | CC | Sphingolipid signaling pathway | 35/1267 | 121/8465 | 5.70e-05 | 3.93e-04 | 2.32e-04 | 35 |
| hsa042109 | Cervix | CC | Apoptosis | 36/1267 | 136/8465 | 3.21e-04 | 1.68e-03 | 9.91e-04 | 36 |
| hsa0472214 | Cervix | CC | Neurotrophin signaling pathway | 32/1267 | 119/8465 | 5.01e-04 | 2.42e-03 | 1.43e-03 | 32 |
| hsa0501716 | Cervix | CC | Spinocerebellar ataxia | 35/1267 | 143/8465 | 1.77e-03 | 7.21e-03 | 4.26e-03 | 35 |
| hsa046686 | Cervix | CC | TNF signaling pathway | 28/1267 | 114/8465 | 4.60e-03 | 1.62e-02 | 9.59e-03 | 28 |
| hsa040109 | Cervix | CC | MAPK signaling pathway | 62/1267 | 302/8465 | 4.89e-03 | 1.67e-02 | 9.86e-03 | 62 |
| hsa05208110 | Cervix | CC | Chemical carcinogenesis - reactive oxygen species | 92/1267 | 223/8465 | 4.71e-22 | 5.09e-20 | 3.01e-20 | 92 |
| hsa05012110 | Cervix | CC | Parkinson disease | 102/1267 | 266/8465 | 1.81e-21 | 1.47e-19 | 8.66e-20 | 102 |
| Hugo Symbol | Variant Class | Variant Classification | dbSNP RS | HGVSc | HGVSp | HGVSp Short | SWISSPROT | BIOTYPE | SIFT | PolyPhen | Tumor Sample Barcode | Tissue | Histology | Sex | Age | Stage | Therapy Types | Drugs | Outcome |
| MAP3K5 | SNV | Missense_Mutation | rs771379166 | c.3427C>T | p.Arg1143Trp | p.R1143W | Q99683 | protein_coding | deleterious(0) | probably_damaging(0.993) | TCGA-AC-A23H-01 | Breast | breast invasive carcinoma | Female | >=65 | I/II | Unknown | Unknown | PD |
| MAP3K5 | SNV | Missense_Mutation | | c.1276N>A | p.Glu426Lys | p.E426K | Q99683 | protein_coding | deleterious(0) | probably_damaging(0.995) | TCGA-AC-A2B8-01 | Breast | breast invasive carcinoma | Female | >=65 | I/II | Chemotherapy | chemo | PD |
| MAP3K5 | SNV | Missense_Mutation | | c.3040C>T | p.Arg1014Trp | p.R1014W | Q99683 | protein_coding | deleterious(0.02) | probably_damaging(0.993) | TCGA-AN-A046-01 | Breast | breast invasive carcinoma | Female | >=65 | I/II | Unknown | Unknown | SD |
| MAP3K5 | SNV | Missense_Mutation | | c.702N>C | p.Leu234Phe | p.L234F | Q99683 | protein_coding | tolerated(0.08) | possibly_damaging(0.883) | TCGA-AN-A0AR-01 | Breast | breast invasive carcinoma | Female | <65 | I/II | Unknown | Unknown | SD |
| MAP3K5 | SNV | Missense_Mutation | novel | c.1307N>A | p.Ala436Glu | p.A436E | Q99683 | protein_coding | deleterious(0) | probably_damaging(0.999) | TCGA-AN-A0FZ-01 | Breast | breast invasive carcinoma | Female | <65 | III/IV | Unknown | Unknown | SD |
| MAP3K5 | SNV | Missense_Mutation | novel | c.1531N>T | p.Leu511Phe | p.L511F | Q99683 | protein_coding | deleterious(0) | probably_damaging(0.998) | TCGA-BH-A0B7-01 | Breast | breast invasive carcinoma | Female | <65 | I/II | Chemotherapy | adriamycin | CR |
| MAP3K5 | SNV | Missense_Mutation | novel | c.2311N>A | p.Gly771Ser | p.G771S | Q99683 | protein_coding | deleterious(0) | possibly_damaging(0.896) | TCGA-BH-A0BL-01 | Breast | breast invasive carcinoma | Female | <65 | I/II | Chemotherapy | adriamycin | CR |
| MAP3K5 | SNV | Missense_Mutation | | c.1276G>A | p.Glu426Lys | p.E426K | Q99683 | protein_coding | deleterious(0) | probably_damaging(0.995) | TCGA-BH-A0DZ-01 | Breast | breast invasive carcinoma | Female | <65 | I/II | Chemotherapy | docetaxel | SD |
| MAP3K5 | SNV | Missense_Mutation | novel | c.3817G>A | p.Ala1273Thr | p.A1273T | Q99683 | protein_coding | tolerated(0.79) | benign(0.257) | TCGA-E2-A14R-01 | Breast | breast invasive carcinoma | Female | <65 | I/II | Chemotherapy | doxorubicin | PD |
| MAP3K5 | SNV | Missense_Mutation | novel | c.850C>G | p.Arg284Gly | p.R284G | Q99683 | protein_coding | deleterious(0) | probably_damaging(0.997) | TCGA-GI-A2C9-01 | Breast | breast invasive carcinoma | Female | <65 | I/II | Unspecific | | SD |
| Entrez ID | Symbol | Category | Interaction Types | Drug Claim Name | Drug Name | PMIDs |
| 4217 | MAP3K5 | SERINE THREONINE KINASE, KINASE, DRUGGABLE GENOME, EXTERNAL SIDE OF PLASMA MEMBRANE, TRANSCRIPTION FACTOR, ENZYME | | GS-4997 | SELONSERTIB | |
| 4217 | MAP3K5 | SERINE THREONINE KINASE, KINASE, DRUGGABLE GENOME, EXTERNAL SIDE OF PLASMA MEMBRANE, TRANSCRIPTION FACTOR, ENZYME | inhibitor | 249565756 | | |
| 4217 | MAP3K5 | SERINE THREONINE KINASE, KINASE, DRUGGABLE GENOME, EXTERNAL SIDE OF PLASMA MEMBRANE, TRANSCRIPTION FACTOR, ENZYME | | GS-4977 | | |
| 4217 | MAP3K5 | SERINE THREONINE KINASE, KINASE, DRUGGABLE GENOME, EXTERNAL SIDE OF PLASMA MEMBRANE, TRANSCRIPTION FACTOR, ENZYME | inhibitor | 249565813 | | |
| 4217 | MAP3K5 | SERINE THREONINE KINASE, KINASE, DRUGGABLE GENOME, EXTERNAL SIDE OF PLASMA MEMBRANE, TRANSCRIPTION FACTOR, ENZYME | inhibitor | 385612190 | | |
| 4217 | MAP3K5 | SERINE THREONINE KINASE, KINASE, DRUGGABLE GENOME, EXTERNAL SIDE OF PLASMA MEMBRANE, TRANSCRIPTION FACTOR, ENZYME | inhibitor | CHEMBL3545429 | SELONSERTIB | |
| 4217 | MAP3K5 | SERINE THREONINE KINASE, KINASE, DRUGGABLE GENOME, EXTERNAL SIDE OF PLASMA MEMBRANE, TRANSCRIPTION FACTOR, ENZYME | | hydroxyurea | HYDROXYUREA | 23556445 |
| 4217 | MAP3K5 | SERINE THREONINE KINASE, KINASE, DRUGGABLE GENOME, EXTERNAL SIDE OF PLASMA MEMBRANE, TRANSCRIPTION FACTOR, ENZYME | inhibitor | 315661125 | SELONSERTIB | |
| 4217 | MAP3K5 | SERINE THREONINE KINASE, KINASE, DRUGGABLE GENOME, EXTERNAL SIDE OF PLASMA MEMBRANE, TRANSCRIPTION FACTOR, ENZYME | inhibitor | 404859049 | | |


