
|
|||||
|
 | |
| |
| |
| |
| |
| |
|
Gene: LYST |
Gene summary for LYST |
| Gene information | Species | Human | Gene symbol | LYST | Gene ID | 1130 |
| Gene name | lysosomal trafficking regulator | |
| Gene Alias | CHS | |
| Cytomap | 1q42.3 | |
| Gene Type | protein-coding | GO ID | GO:0001562 | UniProtAcc | Q99698 |
Top |
Malignant transformation analysis |
| Identification of the aberrant gene expression in precancerous and cancerous lesions by comparing the gene expression of stem-like cells in diseased tissues with normal stem cells |
| Entrez ID | Symbol | Replicates | Species | Organ | Tissue | Adj P-value | Log2FC | Malignancy |
| 1130 | LYST | LZE4T | Human | Esophagus | ESCC | 2.88e-12 | 4.21e-01 | 0.0811 |
| 1130 | LYST | LZE7T | Human | Esophagus | ESCC | 1.54e-02 | 1.52e-01 | 0.0667 |
| 1130 | LYST | LZE8T | Human | Esophagus | ESCC | 3.54e-04 | 1.39e-01 | 0.067 |
| 1130 | LYST | LZE20T | Human | Esophagus | ESCC | 1.94e-03 | 1.03e-01 | 0.0662 |
| 1130 | LYST | LZE24T | Human | Esophagus | ESCC | 4.74e-08 | 1.78e-01 | 0.0596 |
| 1130 | LYST | LZE21T | Human | Esophagus | ESCC | 2.09e-02 | 1.92e-01 | 0.0655 |
| 1130 | LYST | LZE6T | Human | Esophagus | ESCC | 1.10e-04 | 1.74e-01 | 0.0845 |
| 1130 | LYST | P1T-E | Human | Esophagus | ESCC | 4.77e-03 | 8.41e-02 | 0.0875 |
| 1130 | LYST | P2T-E | Human | Esophagus | ESCC | 1.57e-37 | 7.56e-01 | 0.1177 |
| 1130 | LYST | P4T-E | Human | Esophagus | ESCC | 4.33e-03 | 1.42e-01 | 0.1323 |
| 1130 | LYST | P5T-E | Human | Esophagus | ESCC | 5.50e-18 | 5.48e-01 | 0.1327 |
| 1130 | LYST | P8T-E | Human | Esophagus | ESCC | 3.98e-04 | 1.31e-01 | 0.0889 |
| 1130 | LYST | P9T-E | Human | Esophagus | ESCC | 1.40e-17 | 2.83e-01 | 0.1131 |
| 1130 | LYST | P10T-E | Human | Esophagus | ESCC | 1.15e-19 | 2.68e-01 | 0.116 |
| 1130 | LYST | P11T-E | Human | Esophagus | ESCC | 4.95e-14 | 6.02e-01 | 0.1426 |
| 1130 | LYST | P12T-E | Human | Esophagus | ESCC | 2.10e-03 | 1.68e-01 | 0.1122 |
| 1130 | LYST | P15T-E | Human | Esophagus | ESCC | 3.67e-08 | 2.18e-01 | 0.1149 |
| 1130 | LYST | P16T-E | Human | Esophagus | ESCC | 2.40e-63 | 1.35e+00 | 0.1153 |
| 1130 | LYST | P19T-E | Human | Esophagus | ESCC | 3.09e-03 | 1.56e-01 | 0.1662 |
| 1130 | LYST | P20T-E | Human | Esophagus | ESCC | 1.79e-10 | 1.29e-01 | 0.1124 |
| Page: 1 2 3 4 5 6 |
| Tissue | Expression Dynamics | Abbreviation |
| Esophagus | 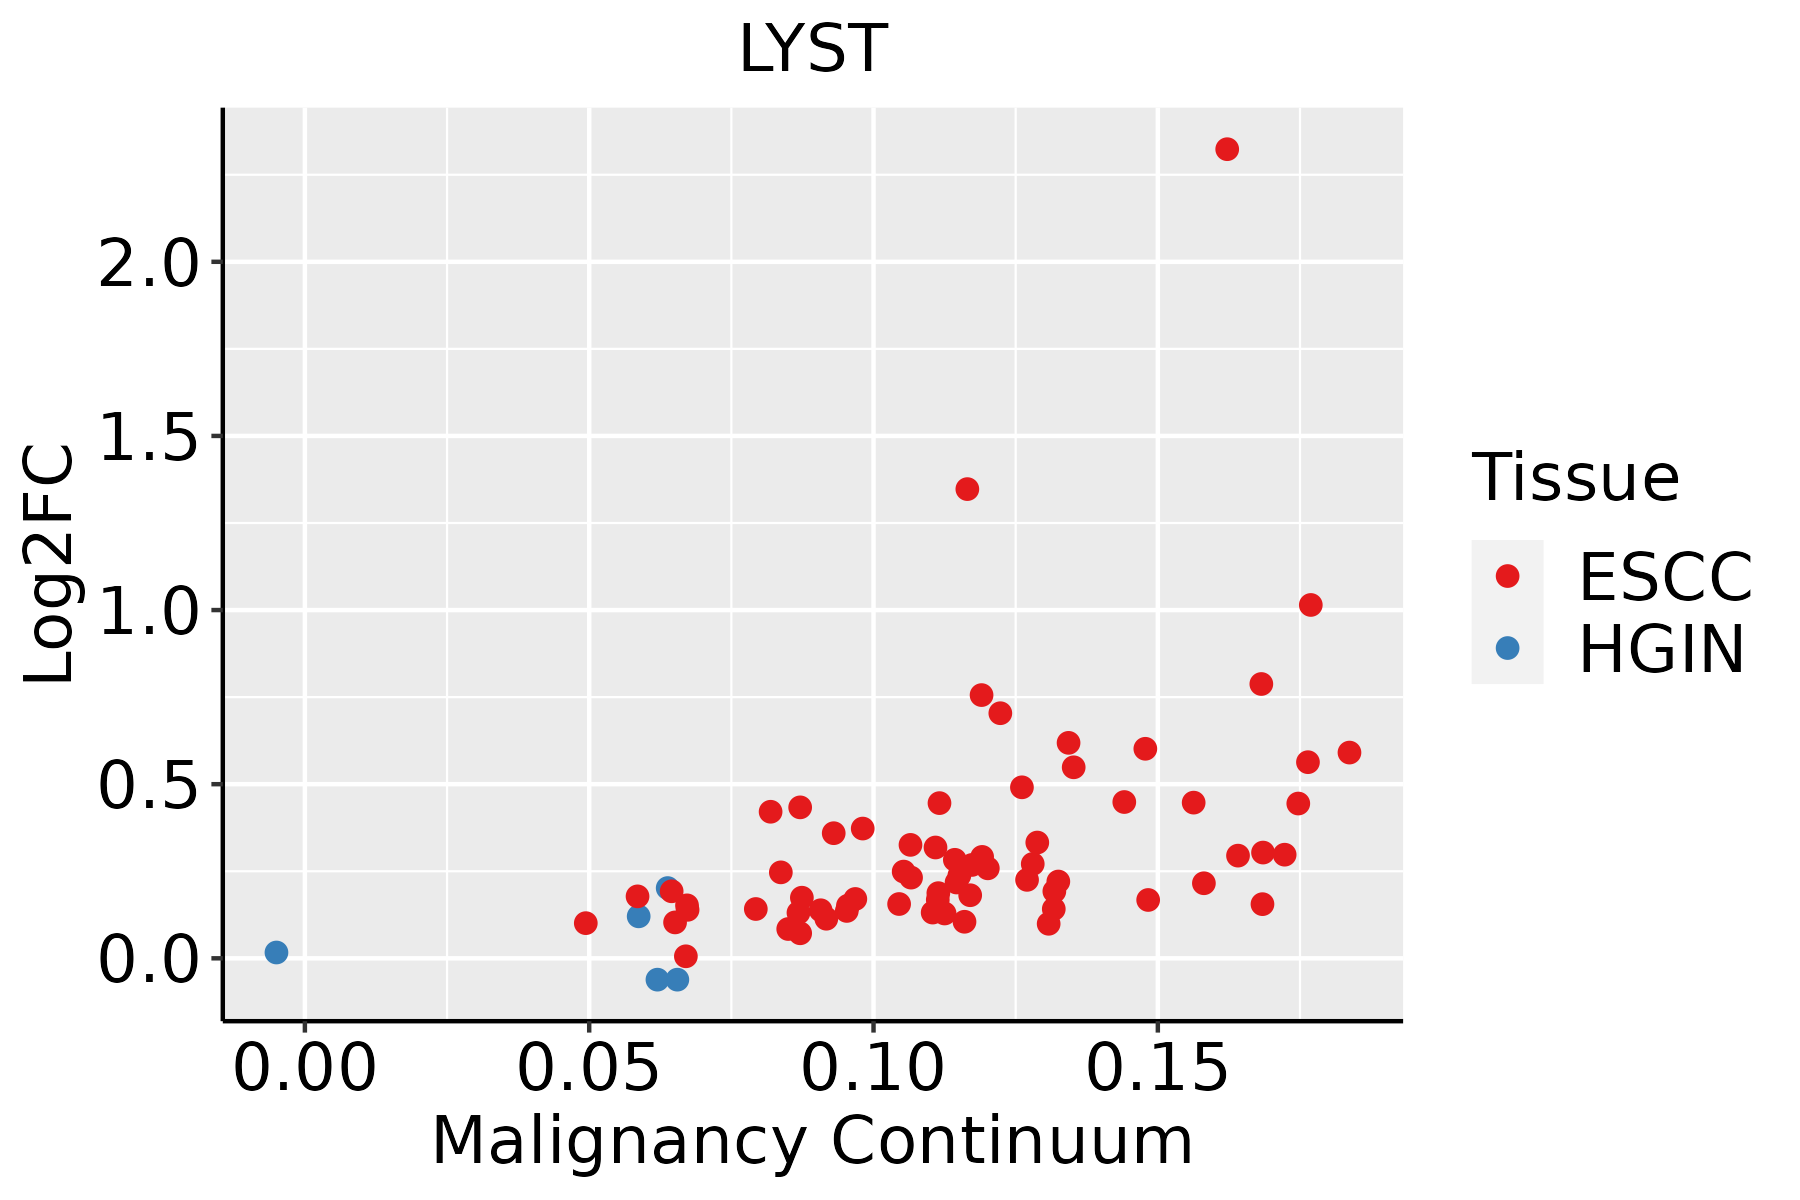 | ESCC: Esophageal squamous cell carcinoma |
| HGIN: High-grade intraepithelial neoplasias | ||
| LGIN: Low-grade intraepithelial neoplasias | ||
| Liver | 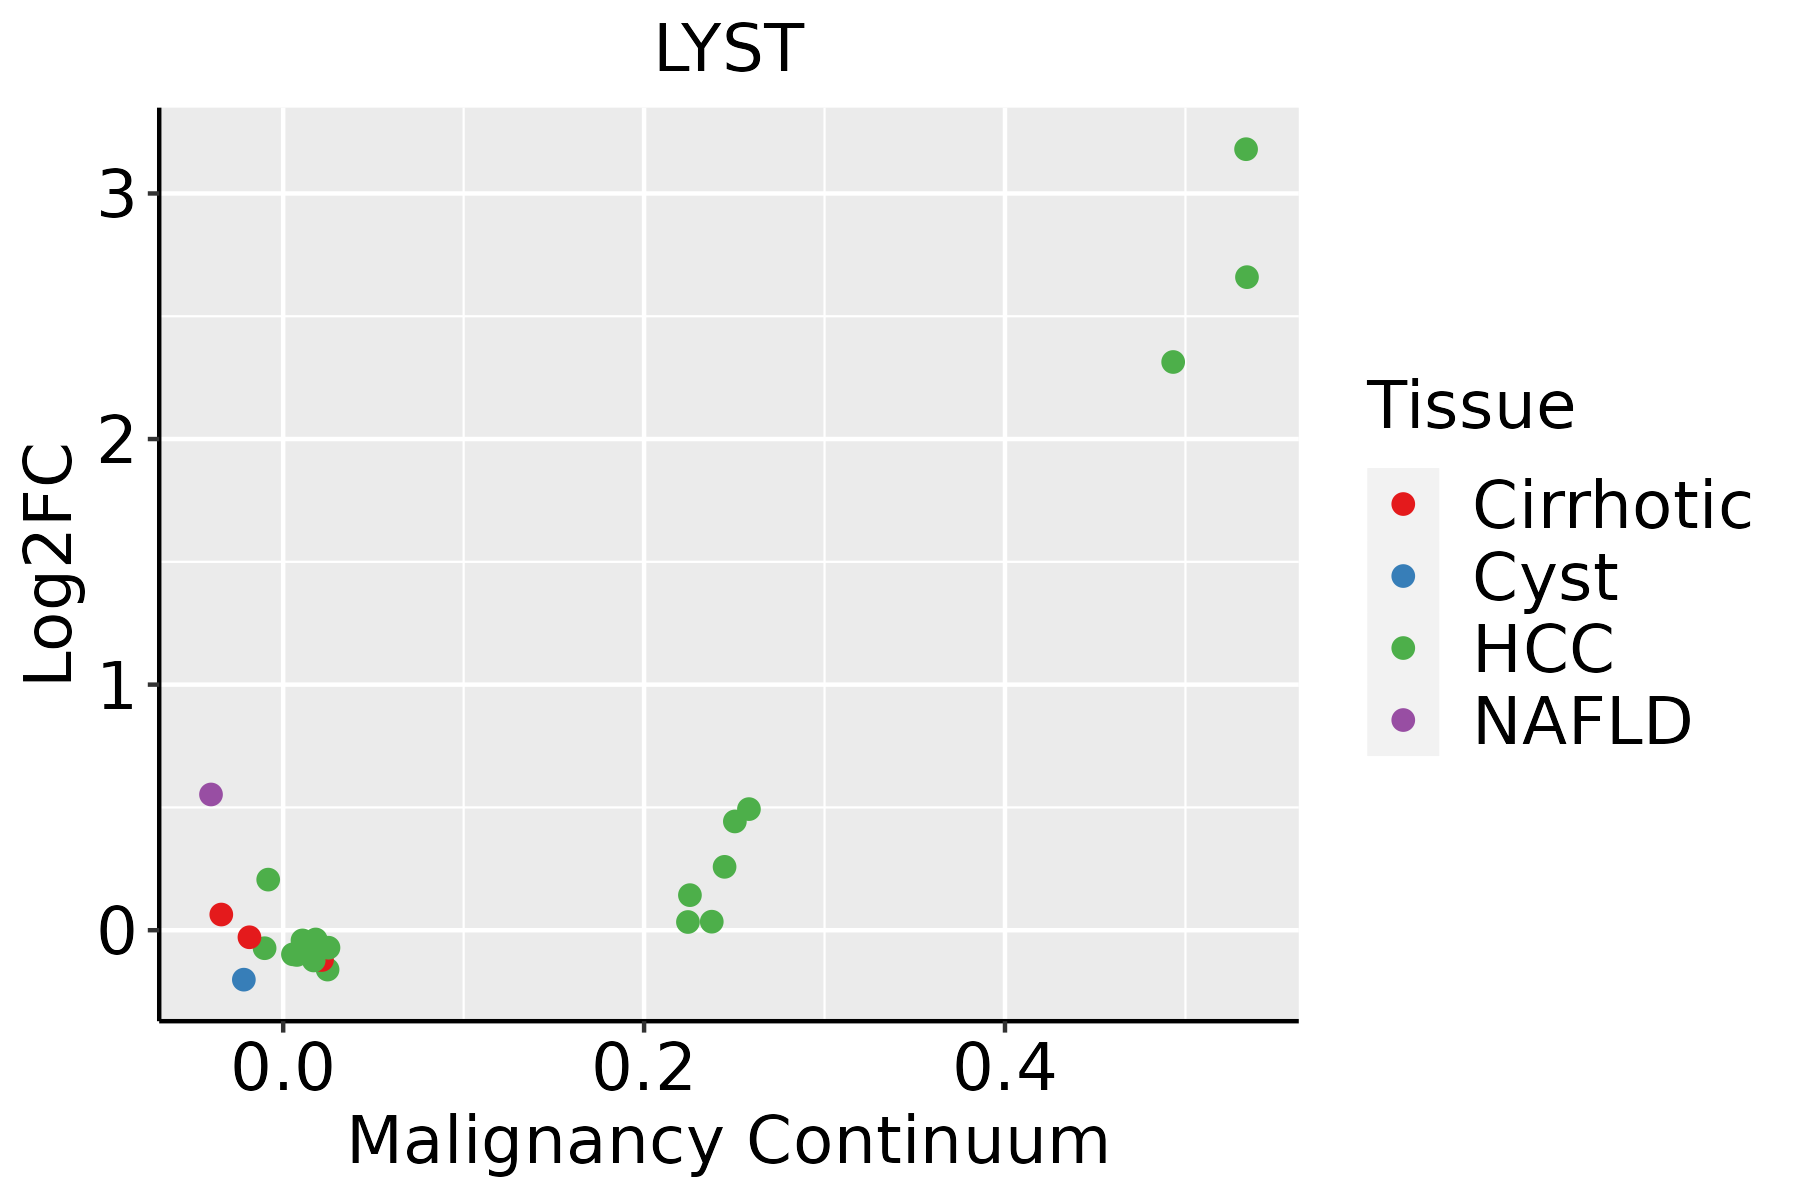 | HCC: Hepatocellular carcinoma |
| NAFLD: Non-alcoholic fatty liver disease | ||
| Lung | 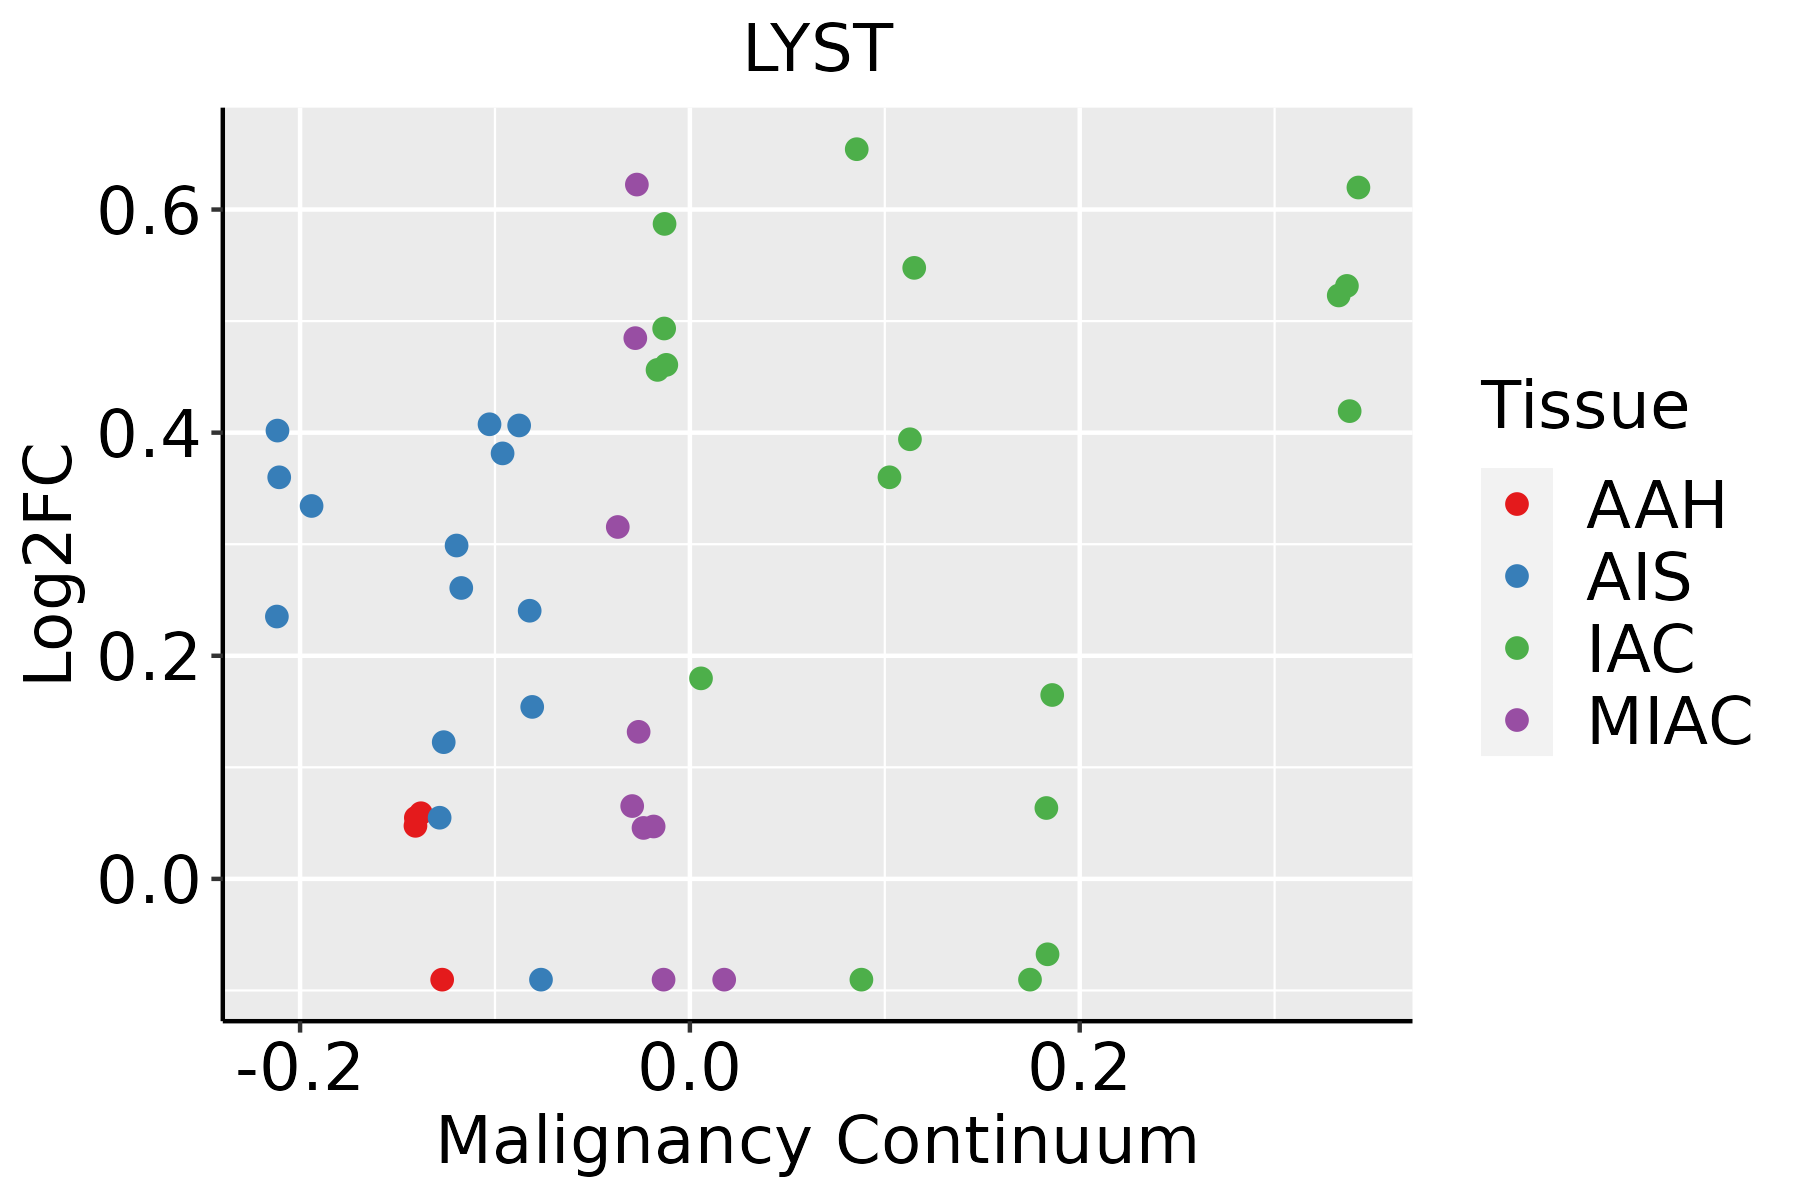 | AAH: Atypical adenomatous hyperplasia |
| AIS: Adenocarcinoma in situ | ||
| IAC: Invasive lung adenocarcinoma | ||
| MIA: Minimally invasive adenocarcinoma | ||
| Oral Cavity | 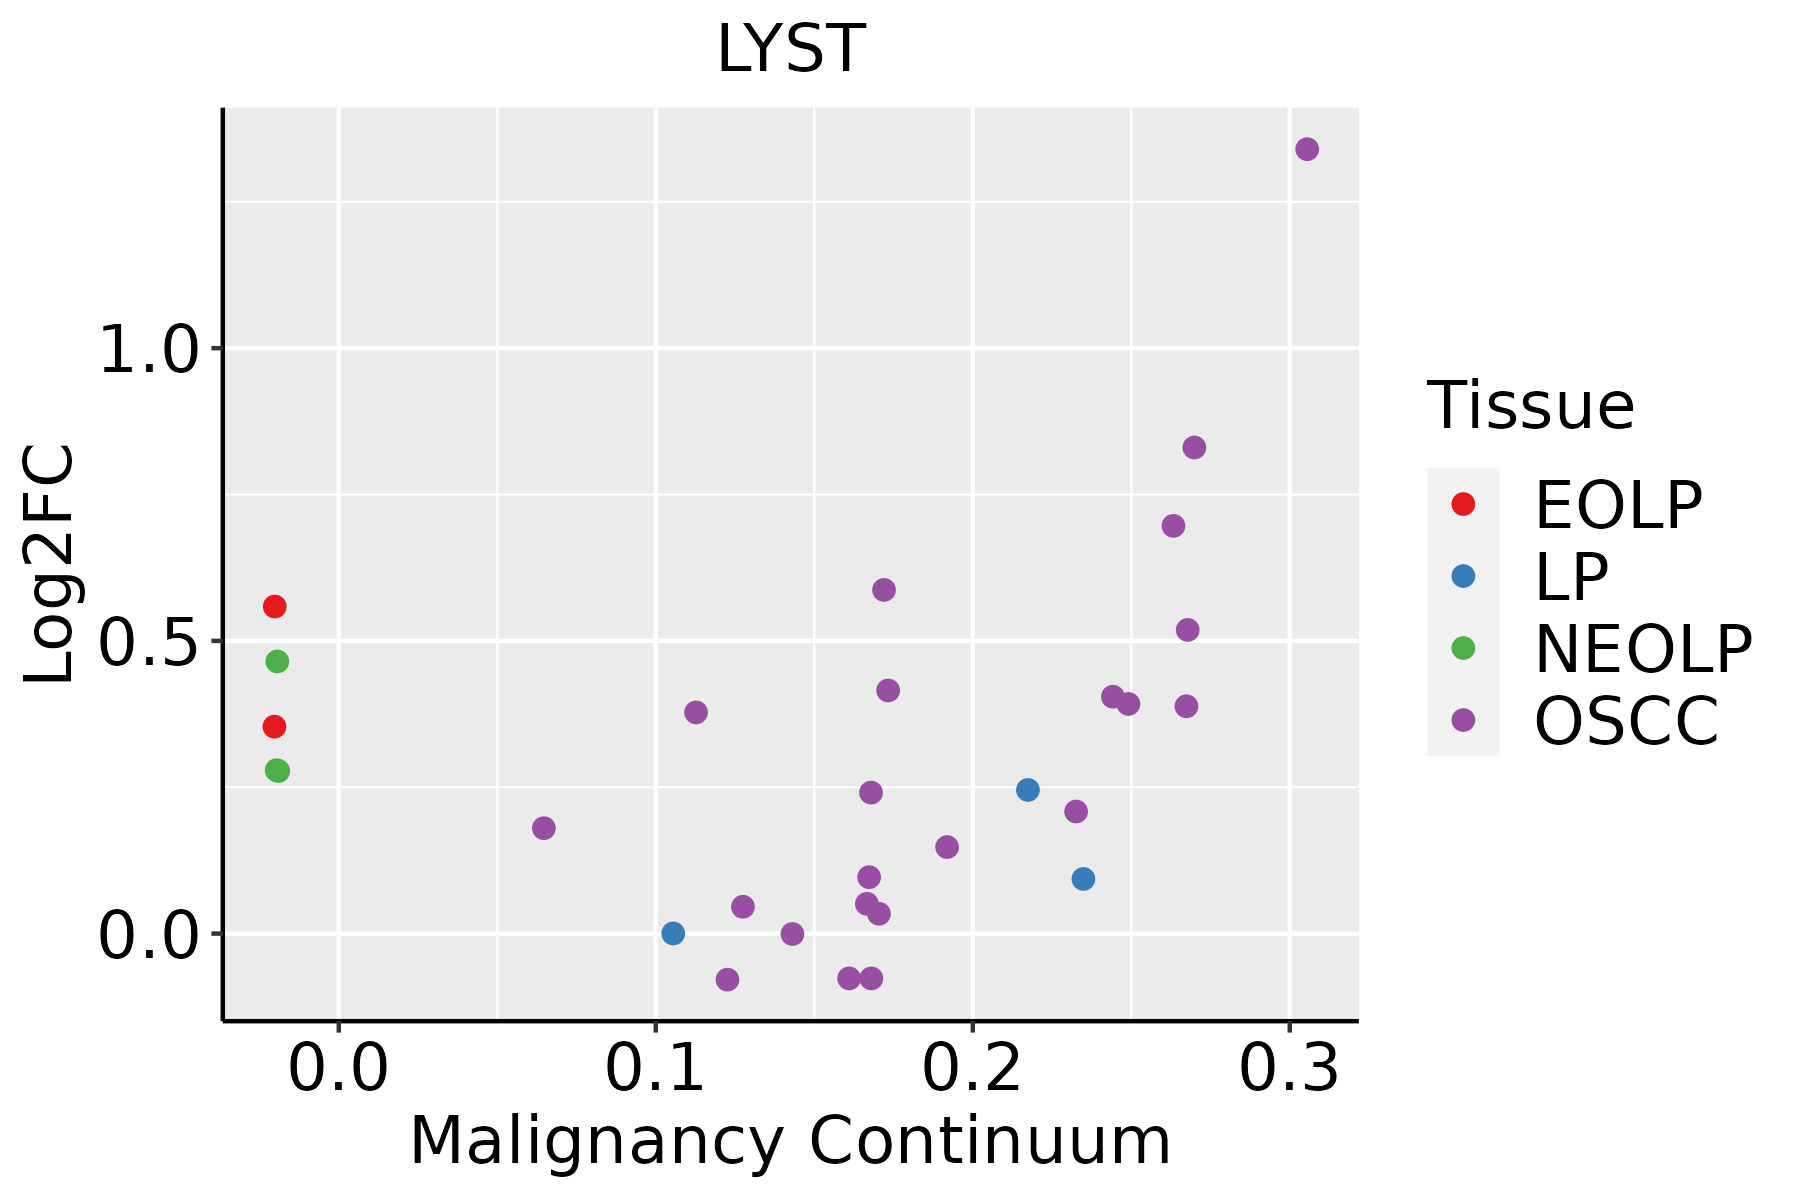 | EOLP: Erosive Oral lichen planus |
| LP: leukoplakia | ||
| NEOLP: Non-erosive oral lichen planus | ||
| OSCC: Oral squamous cell carcinoma | ||
| Thyroid | 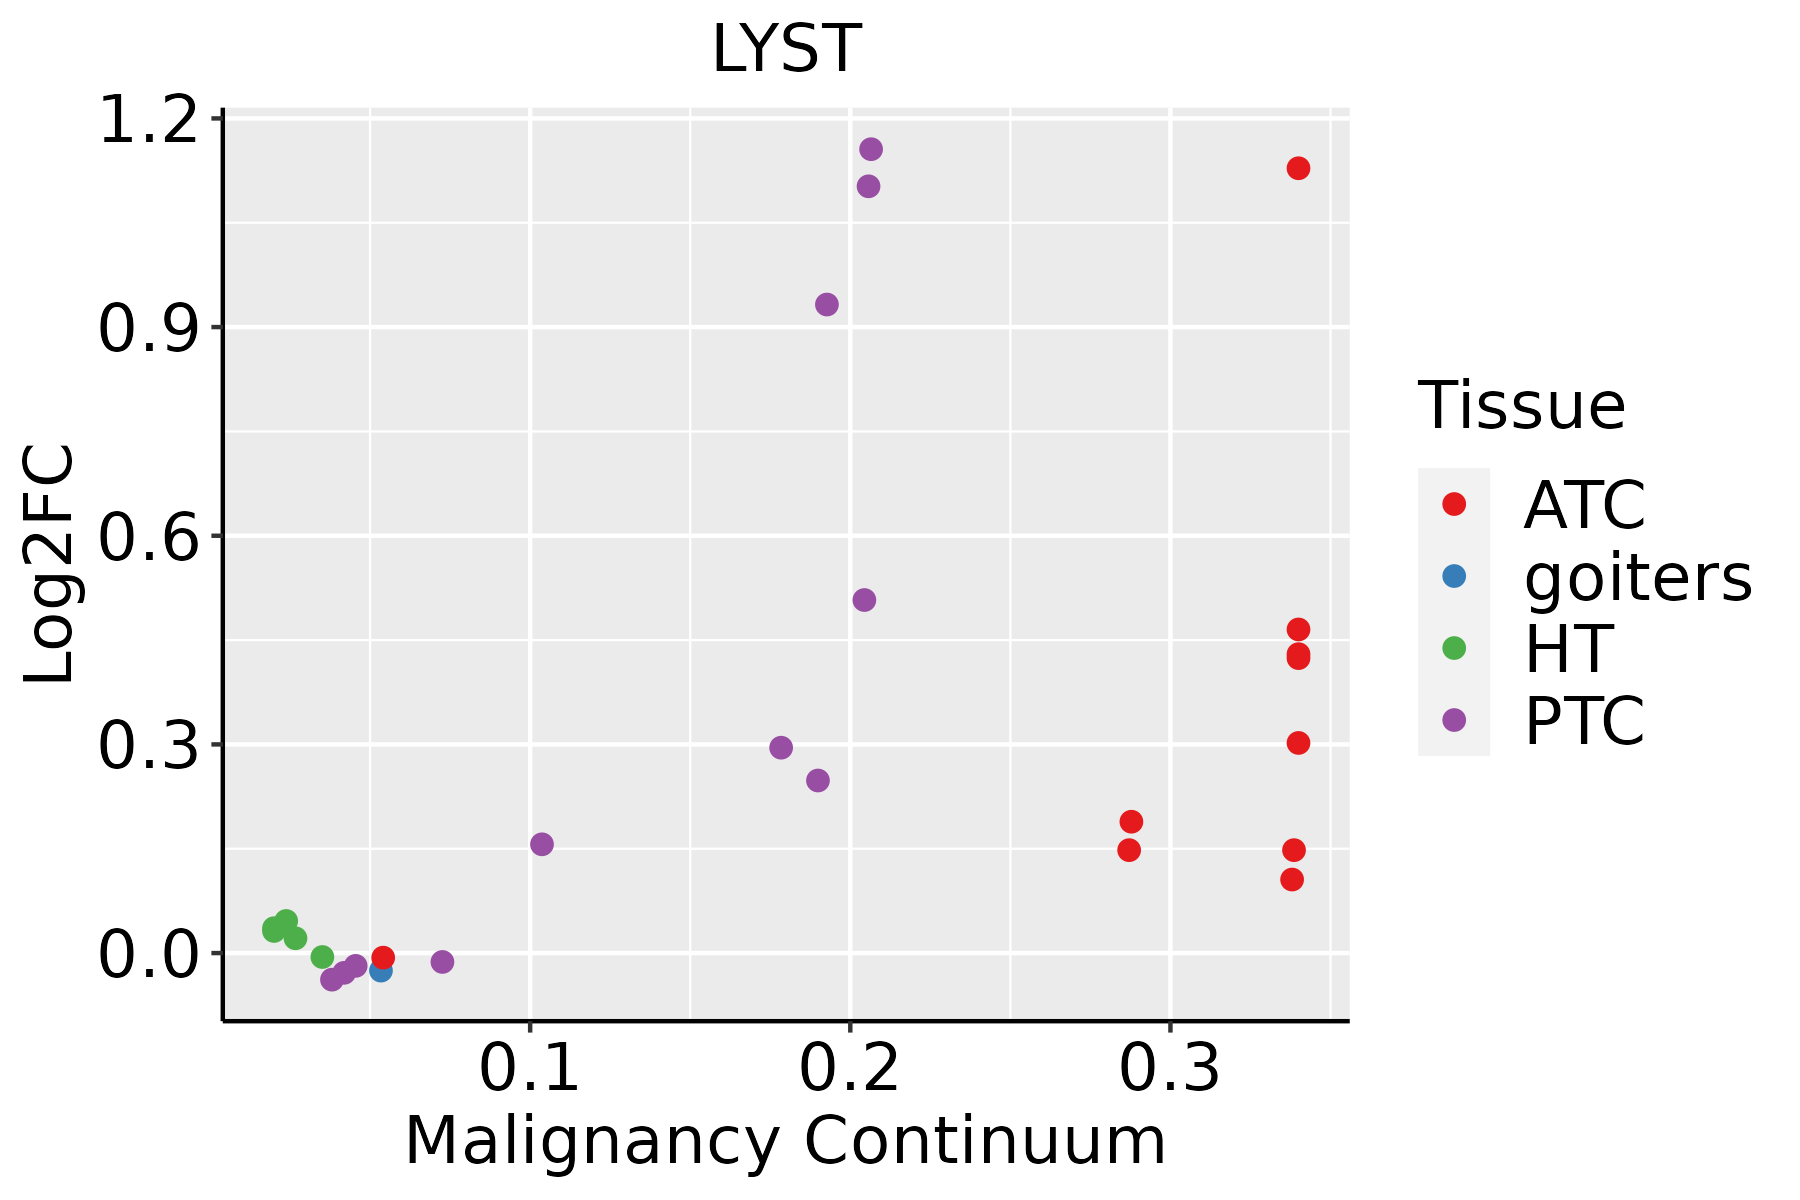 | ATC: Anaplastic thyroid cancer |
| HT: Hashimoto's thyroiditis | ||
| PTC: Papillary thyroid cancer |
| ∗log2FC in expression of this searched gene in stem-like cells from each diseased tissue sample relative to stem-like cells in normal samples in each tissue plotted against the malignancy continuum. Samples are colored based on if they are from different disease stage. |
Top |
Malignant transformation related pathway analysis |
| Find out the enriched GO biological processes and KEGG pathways involved in transition from healthy to precancer to cancer |
| Tissue | Disease Stage | Enriched GO biological Processes |
| Colorectum | AD |  |
| Colorectum | SER |  |
| Colorectum | MSS |  |
| Colorectum | MSI-H |  |
| Colorectum | FAP |  |
| ∗Top 15 enriched GO BP terms are showed in the bar plot of each disease state in each tissue. Each row represents a significant GO biological process which is colored according to the -log10(p.adjust). |
| Page: 1 2 3 4 5 6 7 8 9 |
| GO ID | Tissue | Disease Stage | Description | Gene Ratio | Bg Ratio | pvalue | p.adjust | Count |
| GO:00070414 | Liver | NAFLD | lysosomal transport | 22/1882 | 114/18723 | 2.03e-03 | 2.02e-02 | 22 |
| GO:001605021 | Liver | HCC | vesicle organization | 194/7958 | 300/18723 | 5.58e-15 | 3.97e-13 | 194 |
| GO:001619721 | Liver | HCC | endosomal transport | 154/7958 | 230/18723 | 4.74e-14 | 2.95e-12 | 154 |
| GO:000703421 | Liver | HCC | vacuolar transport | 108/7958 | 157/18723 | 2.22e-11 | 8.69e-10 | 108 |
| GO:000703311 | Liver | HCC | vacuole organization | 119/7958 | 180/18723 | 1.22e-10 | 4.25e-09 | 119 |
| GO:000961511 | Liver | HCC | response to virus | 210/7958 | 367/18723 | 7.32e-09 | 1.86e-07 | 210 |
| GO:003250911 | Liver | HCC | endosome transport via multivesicular body sorting pathway | 28/7958 | 31/18723 | 3.56e-08 | 7.87e-07 | 28 |
| GO:007198511 | Liver | HCC | multivesicular body sorting pathway | 32/7958 | 37/18723 | 3.85e-08 | 8.35e-07 | 32 |
| GO:000704121 | Liver | HCC | lysosomal transport | 76/7958 | 114/18723 | 1.56e-07 | 2.88e-06 | 76 |
| GO:00516071 | Liver | HCC | defense response to virus | 151/7958 | 265/18723 | 1.27e-06 | 1.85e-05 | 151 |
| GO:01405461 | Liver | HCC | defense response to symbiont | 151/7958 | 265/18723 | 1.27e-06 | 1.85e-05 | 151 |
| GO:00070401 | Liver | HCC | lysosome organization | 47/7958 | 74/18723 | 2.13e-04 | 1.63e-03 | 47 |
| GO:00801711 | Liver | HCC | lytic vacuole organization | 47/7958 | 74/18723 | 2.13e-04 | 1.63e-03 | 47 |
| GO:00083331 | Liver | HCC | endosome to lysosome transport | 35/7958 | 55/18723 | 1.26e-03 | 6.92e-03 | 35 |
| GO:00161976 | Lung | IAC | endosomal transport | 43/2061 | 230/18723 | 3.53e-04 | 5.50e-03 | 43 |
| GO:00096156 | Lung | IAC | response to virus | 61/2061 | 367/18723 | 6.75e-04 | 9.12e-03 | 61 |
| GO:00070346 | Lung | IAC | vacuolar transport | 31/2061 | 157/18723 | 8.82e-04 | 1.11e-02 | 31 |
| GO:00070415 | Lung | IAC | lysosomal transport | 24/2061 | 114/18723 | 1.30e-03 | 1.45e-02 | 24 |
| GO:000703412 | Lung | AIS | vacuolar transport | 30/1849 | 157/18723 | 3.09e-04 | 5.63e-03 | 30 |
| GO:000704112 | Lung | AIS | lysosomal transport | 23/1849 | 114/18723 | 6.82e-04 | 1.02e-02 | 23 |
| Page: 1 2 3 4 5 6 |
| Pathway ID | Tissue | Disease Stage | Description | Gene Ratio | Bg Ratio | pvalue | p.adjust | qvalue | Count |
| Page: 1 |
Top |
Cell-cell communication analysis |
| Identification of potential cell-cell interactions between two cell types and their ligand-receptor pairs for different disease states |
| Ligand | Receptor | LRpair | Pathway | Tissue | Disease Stage |
| Page: 1 |
Top |
Single-cell gene regulatory network inference analysis |
| Find out the significant the regulons (TFs) and the target genes of each regulon across cell types for different disease states |
| TF | Cell Type | Tissue | Disease Stage | Target Gene | RSS | Regulon Activity |
| ∗The dot plots of a searched regulon are shown for all cell subpopulations in each disease state of each tissue based on the regulon specific score inferred using pySCENIC and by calculating the average expression. |
| Page: 1 |
Top |
Somatic mutation of malignant transformation related genes |
| Annotation of somatic variants for genes involved in malignant transformation |
| Hugo Symbol | Variant Class | Variant Classification | dbSNP RS | HGVSc | HGVSp | HGVSp Short | SWISSPROT | BIOTYPE | SIFT | PolyPhen | Tumor Sample Barcode | Tissue | Histology | Sex | Age | Stage | Therapy Types | Drugs | Outcome |
| LYST | SNV | Missense_Mutation | novel | c.825N>C | p.Leu275Phe | p.L275F | Q99698 | protein_coding | deleterious(0.02) | possibly_damaging(0.894) | TCGA-5L-AAT1-01 | Breast | breast invasive carcinoma | Female | <65 | III/IV | Hormone Therapy | letrozol | SD |
| LYST | SNV | Missense_Mutation | novel | c.10055N>C | p.Gln3352Pro | p.Q3352P | Q99698 | protein_coding | deleterious(0) | probably_damaging(0.998) | TCGA-A2-A04T-01 | Breast | breast invasive carcinoma | Female | <65 | I/II | Chemotherapy | cyclophosphamide | SD |
| LYST | SNV | Missense_Mutation | c.3283N>A | p.Glu1095Lys | p.E1095K | Q99698 | protein_coding | deleterious(0) | benign(0.219) | TCGA-A2-A0CT-01 | Breast | breast invasive carcinoma | Female | >=65 | I/II | Chemotherapy | cytoxan | SD | |
| LYST | SNV | Missense_Mutation | c.5230N>T | p.Val1744Phe | p.V1744F | Q99698 | protein_coding | deleterious(0.01) | possibly_damaging(0.646) | TCGA-A2-A0T1-01 | Breast | breast invasive carcinoma | Female | <65 | III/IV | Targeted Molecular therapy | herceptin | SD | |
| LYST | SNV | Missense_Mutation | c.9136A>G | p.Asn3046Asp | p.N3046D | Q99698 | protein_coding | tolerated(0.14) | benign(0.351) | TCGA-A2-A25E-01 | Breast | breast invasive carcinoma | Female | <65 | III/IV | Chemotherapy | cytoxan | PD | |
| LYST | SNV | Missense_Mutation | novel | c.5273N>A | p.Pro1758Gln | p.P1758Q | Q99698 | protein_coding | deleterious(0.05) | probably_damaging(0.999) | TCGA-A7-A3RF-01 | Breast | breast invasive carcinoma | Female | >=65 | I/II | Hormone Therapy | anastrozole | PD |
| LYST | SNV | Missense_Mutation | c.9839N>C | p.Arg3280Pro | p.R3280P | Q99698 | protein_coding | deleterious(0) | probably_damaging(0.996) | TCGA-A8-A07R-01 | Breast | breast invasive carcinoma | Female | >=65 | III/IV | Ancillary | zoledronic | SD | |
| LYST | SNV | Missense_Mutation | c.9475G>A | p.Asp3159Asn | p.D3159N | Q99698 | protein_coding | deleterious(0) | probably_damaging(1) | TCGA-AC-A23H-01 | Breast | breast invasive carcinoma | Female | >=65 | I/II | Unknown | Unknown | PD | |
| LYST | SNV | Missense_Mutation | c.3310C>G | p.Arg1104Gly | p.R1104G | Q99698 | protein_coding | deleterious(0) | probably_damaging(0.998) | TCGA-AC-A23H-01 | Breast | breast invasive carcinoma | Female | >=65 | I/II | Unknown | Unknown | PD | |
| LYST | SNV | Missense_Mutation | novel | c.6861N>A | p.Asn2287Lys | p.N2287K | Q99698 | protein_coding | tolerated(0.92) | benign(0) | TCGA-AC-A2FO-01 | Breast | breast invasive carcinoma | Female | >=65 | I/II | Chemotherapy | chemo | CR |
| Page: 1 2 3 4 5 6 7 8 9 10 11 12 13 14 15 16 17 18 19 20 21 22 23 24 25 26 27 28 29 30 31 32 33 34 35 36 37 38 39 40 41 42 43 44 45 |
Top |
Related drugs of malignant transformation related genes |
| Identification of chemicals and drugs interact with genes involved in malignant transfromation |
| (DGIdb 4.0) |
| Entrez ID | Symbol | Category | Interaction Types | Drug Claim Name | Drug Name | PMIDs |
| Page: 1 |

Copyright 2023-Present -The University of Texas Health Science Center at Houston |