
|
|||||
|
 | |
| |
| |
| |
| |
| |
|
Gene: LTV1 |
Gene summary for LTV1 |
| Gene information | Species | Human | Gene symbol | LTV1 | Gene ID | 84946 |
| Gene name | LTV1 ribosome biogenesis factor | |
| Gene Alias | C6orf93 | |
| Cytomap | 6q24.2 | |
| Gene Type | protein-coding | GO ID | GO:0000054 | UniProtAcc | Q96GA3 |
Top |
Malignant transformation analysis |
| Identification of the aberrant gene expression in precancerous and cancerous lesions by comparing the gene expression of stem-like cells in diseased tissues with normal stem cells |
| Entrez ID | Symbol | Replicates | Species | Organ | Tissue | Adj P-value | Log2FC | Malignancy |
| 84946 | LTV1 | LZE4T | Human | Esophagus | ESCC | 3.46e-08 | 3.22e-01 | 0.0811 |
| 84946 | LTV1 | LZE7T | Human | Esophagus | ESCC | 1.10e-09 | 3.53e-01 | 0.0667 |
| 84946 | LTV1 | LZE8T | Human | Esophagus | ESCC | 1.15e-04 | 1.40e-01 | 0.067 |
| 84946 | LTV1 | LZE20T | Human | Esophagus | ESCC | 6.40e-04 | 4.87e-02 | 0.0662 |
| 84946 | LTV1 | LZE24T | Human | Esophagus | ESCC | 8.82e-09 | 3.16e-01 | 0.0596 |
| 84946 | LTV1 | LZE6T | Human | Esophagus | ESCC | 6.10e-06 | 2.03e-01 | 0.0845 |
| 84946 | LTV1 | P1T-E | Human | Esophagus | ESCC | 9.40e-04 | 2.37e-01 | 0.0875 |
| 84946 | LTV1 | P2T-E | Human | Esophagus | ESCC | 3.09e-19 | 3.45e-01 | 0.1177 |
| 84946 | LTV1 | P4T-E | Human | Esophagus | ESCC | 8.29e-14 | 4.25e-01 | 0.1323 |
| 84946 | LTV1 | P5T-E | Human | Esophagus | ESCC | 5.40e-17 | 3.79e-01 | 0.1327 |
| 84946 | LTV1 | P8T-E | Human | Esophagus | ESCC | 9.24e-23 | 2.59e-01 | 0.0889 |
| 84946 | LTV1 | P9T-E | Human | Esophagus | ESCC | 4.01e-04 | 1.97e-01 | 0.1131 |
| 84946 | LTV1 | P10T-E | Human | Esophagus | ESCC | 2.00e-23 | 3.42e-01 | 0.116 |
| 84946 | LTV1 | P11T-E | Human | Esophagus | ESCC | 7.84e-05 | 3.09e-01 | 0.1426 |
| 84946 | LTV1 | P12T-E | Human | Esophagus | ESCC | 5.39e-18 | 2.90e-01 | 0.1122 |
| 84946 | LTV1 | P15T-E | Human | Esophagus | ESCC | 9.10e-21 | 5.07e-01 | 0.1149 |
| 84946 | LTV1 | P16T-E | Human | Esophagus | ESCC | 1.20e-30 | 4.81e-01 | 0.1153 |
| 84946 | LTV1 | P20T-E | Human | Esophagus | ESCC | 3.36e-06 | 2.48e-01 | 0.1124 |
| 84946 | LTV1 | P21T-E | Human | Esophagus | ESCC | 1.64e-29 | 7.41e-01 | 0.1617 |
| 84946 | LTV1 | P22T-E | Human | Esophagus | ESCC | 3.64e-23 | 2.17e-01 | 0.1236 |
| Page: 1 2 3 4 5 6 |
| Tissue | Expression Dynamics | Abbreviation |
| Esophagus | 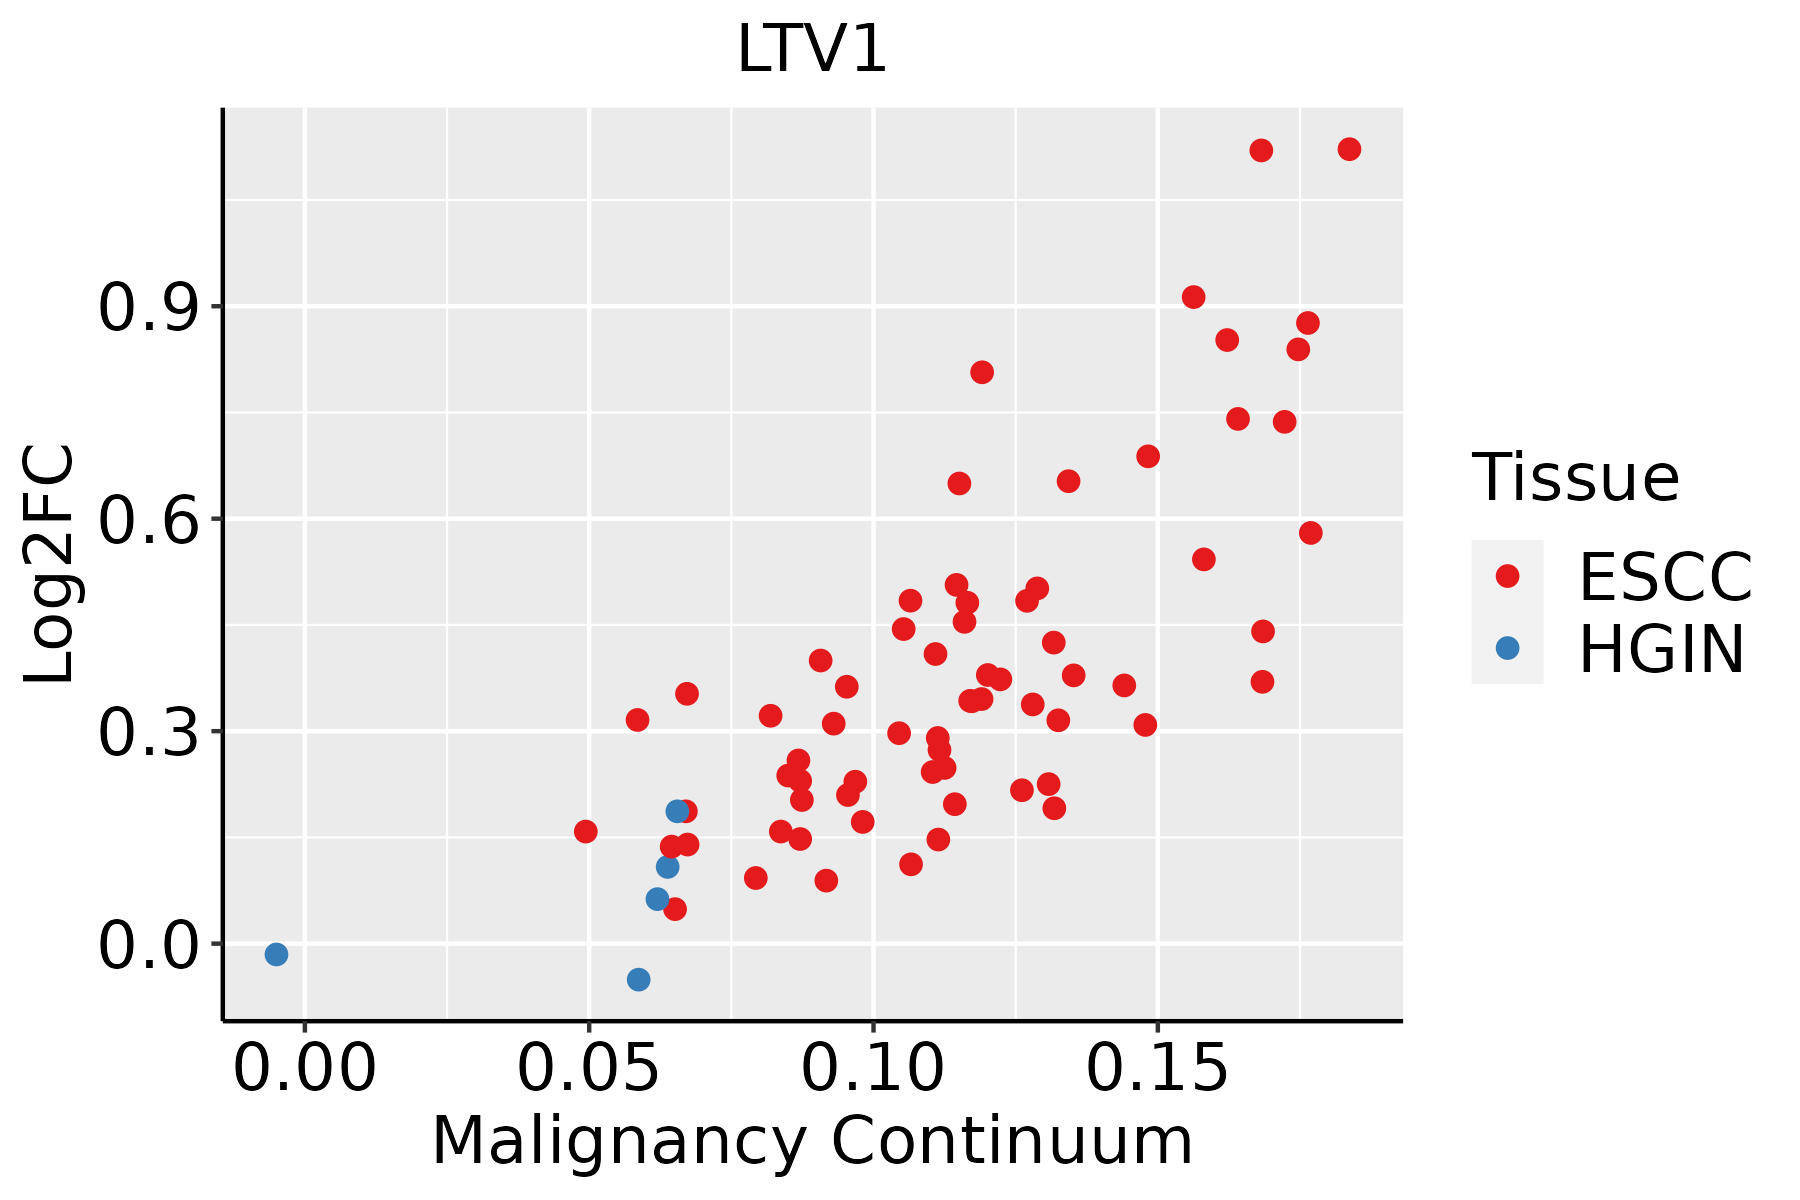 | ESCC: Esophageal squamous cell carcinoma |
| HGIN: High-grade intraepithelial neoplasias | ||
| LGIN: Low-grade intraepithelial neoplasias | ||
| Liver | 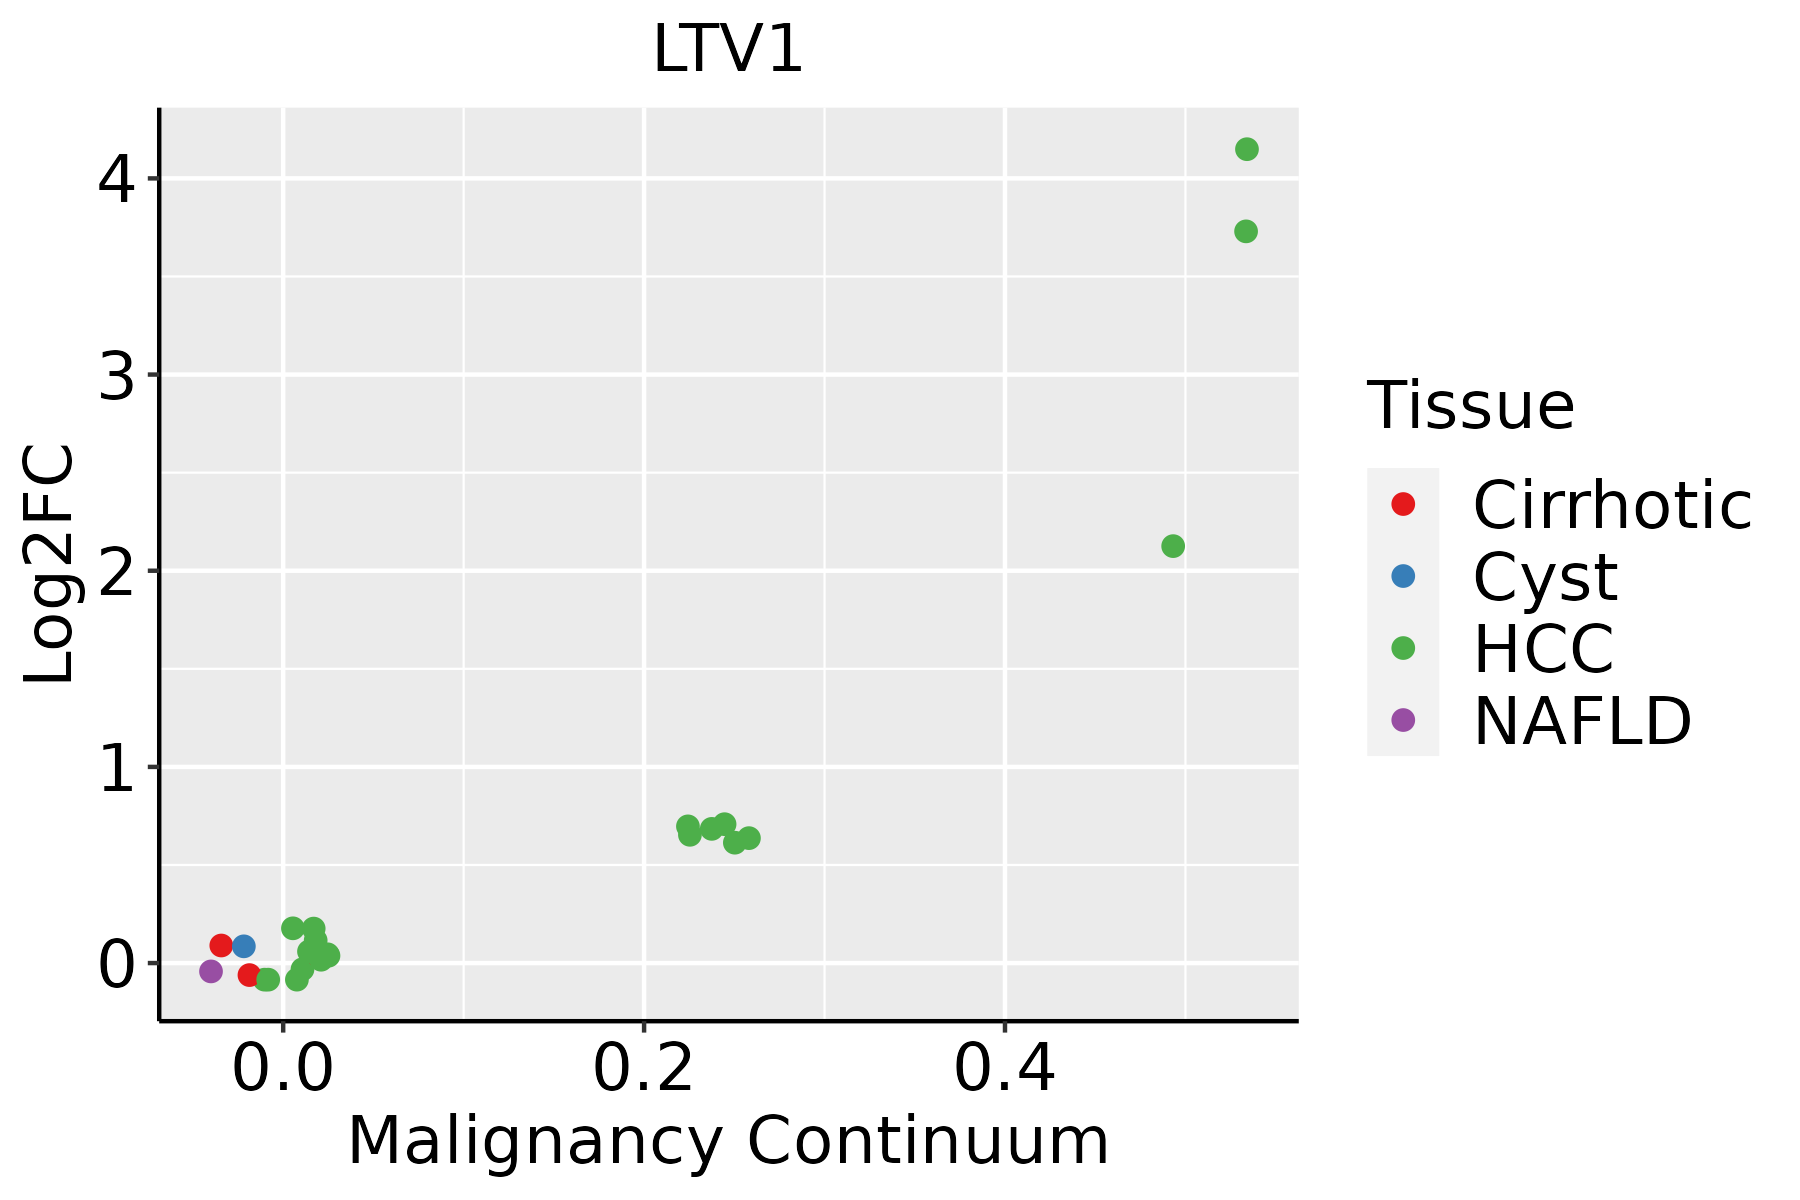 | HCC: Hepatocellular carcinoma |
| NAFLD: Non-alcoholic fatty liver disease | ||
| Oral Cavity | 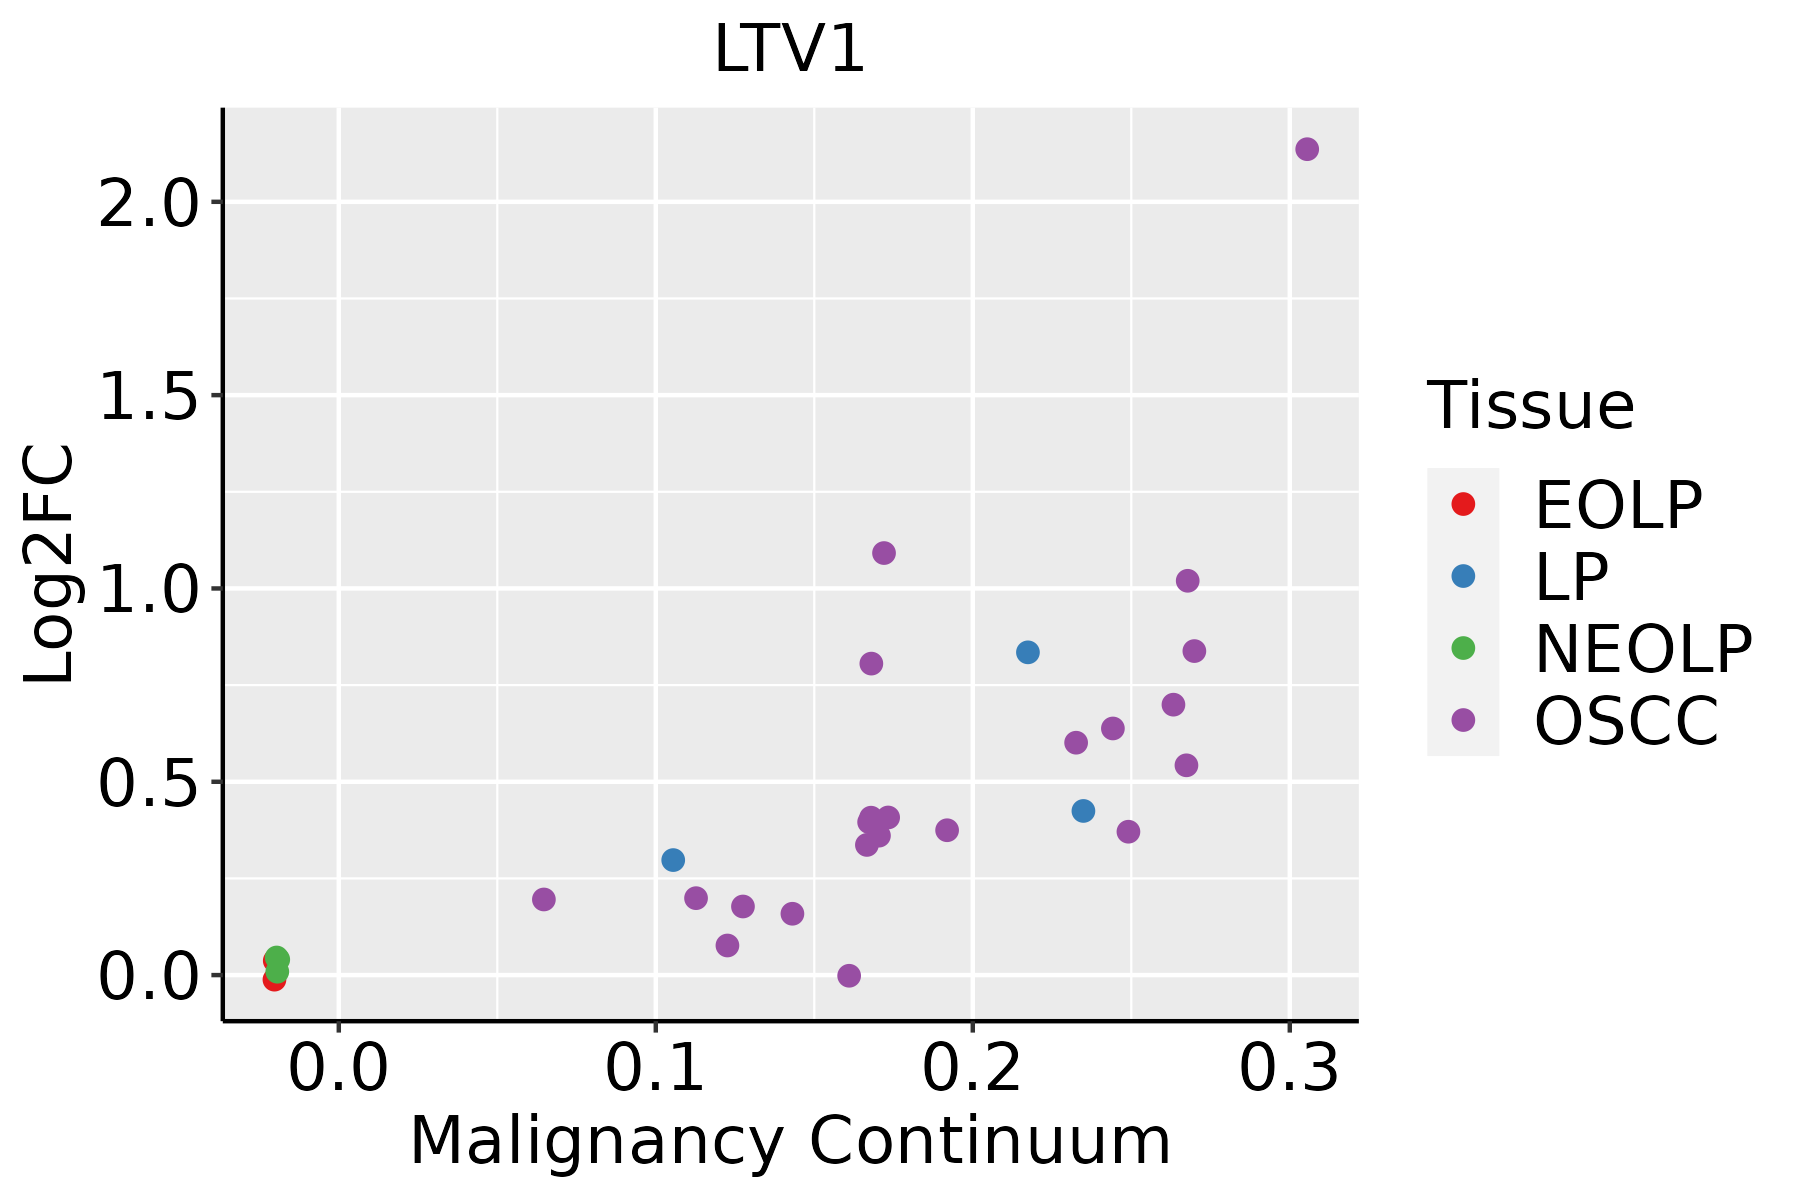 | EOLP: Erosive Oral lichen planus |
| LP: leukoplakia | ||
| NEOLP: Non-erosive oral lichen planus | ||
| OSCC: Oral squamous cell carcinoma | ||
| Skin |  | AK: Actinic keratosis |
| cSCC: Cutaneous squamous cell carcinoma | ||
| SCCIS:squamous cell carcinoma in situ | ||
| Thyroid | 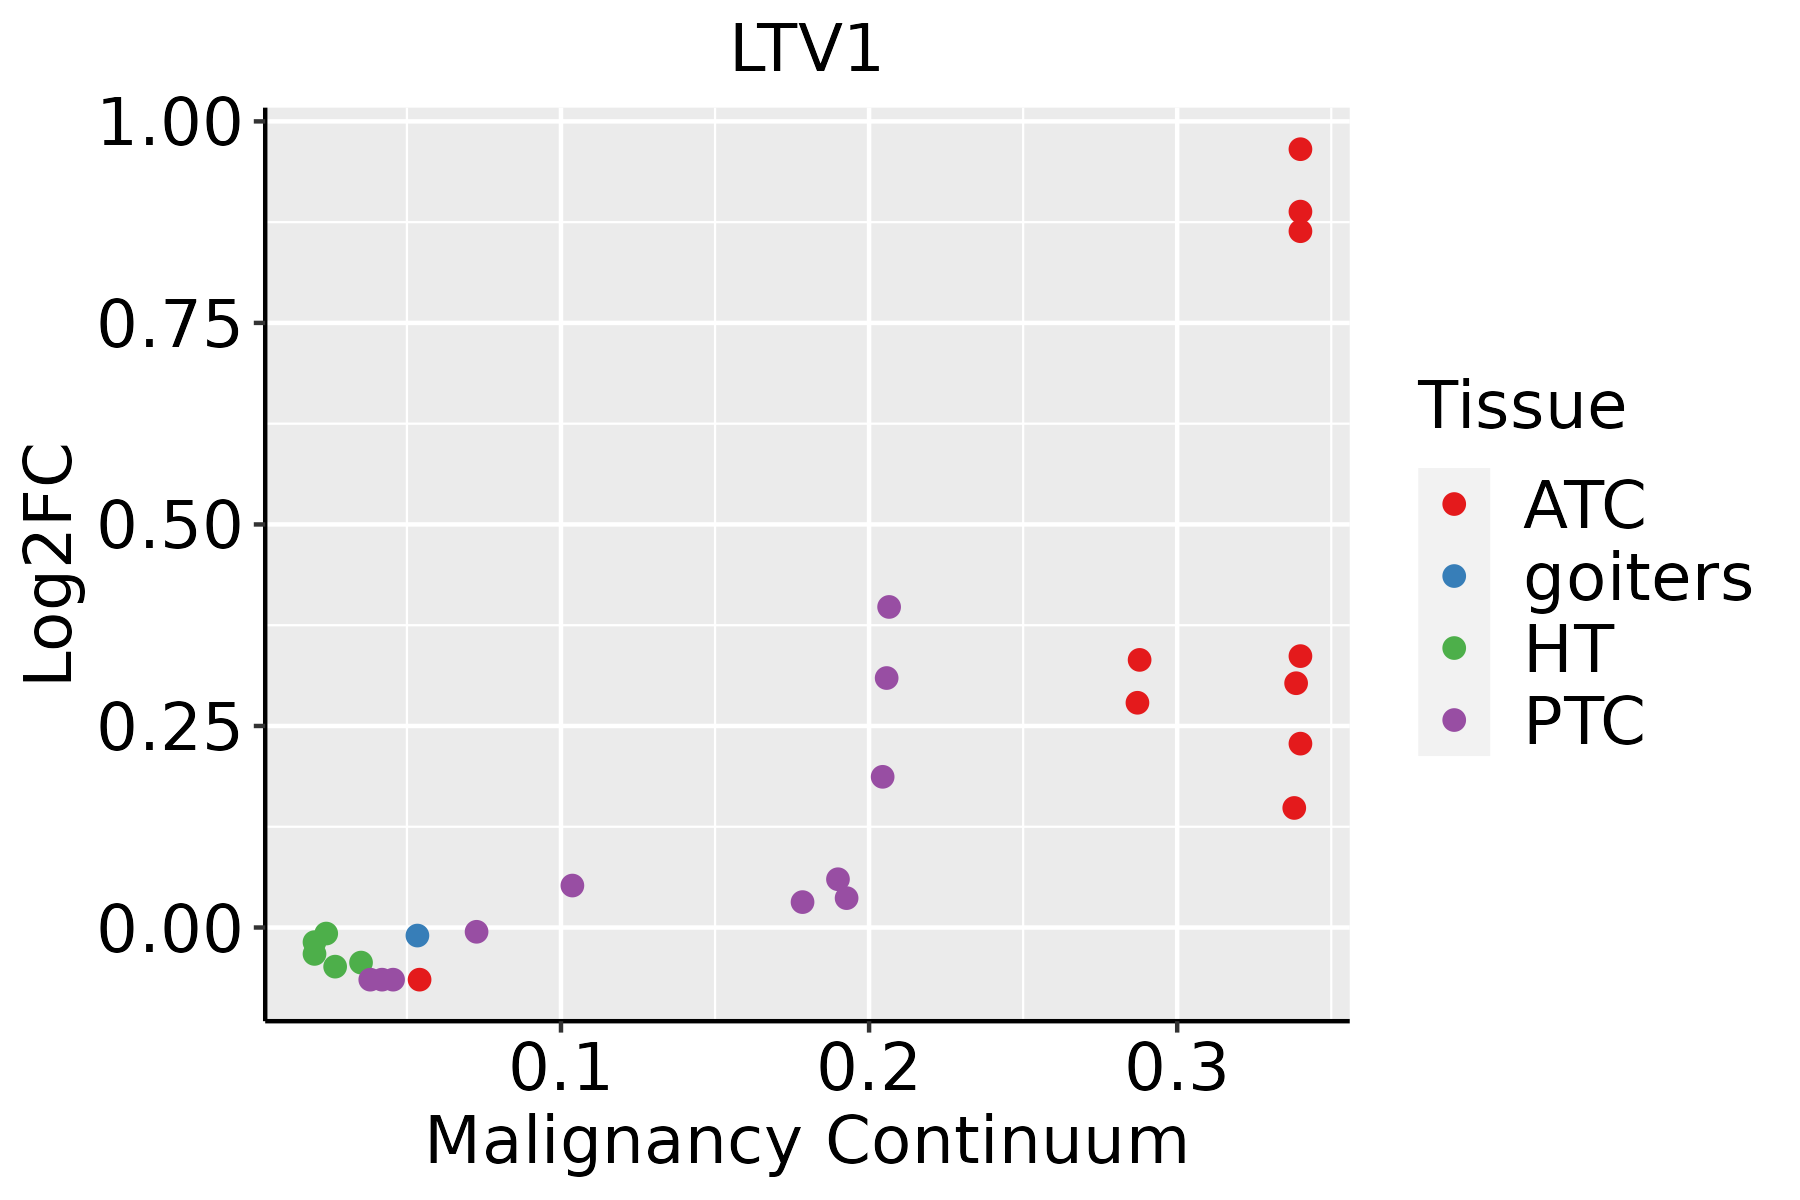 | ATC: Anaplastic thyroid cancer |
| HT: Hashimoto's thyroiditis | ||
| PTC: Papillary thyroid cancer |
| ∗log2FC in expression of this searched gene in stem-like cells from each diseased tissue sample relative to stem-like cells in normal samples in each tissue plotted against the malignancy continuum. Samples are colored based on if they are from different disease stage. |
Top |
Malignant transformation related pathway analysis |
| Find out the enriched GO biological processes and KEGG pathways involved in transition from healthy to precancer to cancer |
| Tissue | Disease Stage | Enriched GO biological Processes |
| Colorectum | AD |  |
| Colorectum | SER |  |
| Colorectum | MSS |  |
| Colorectum | MSI-H |  |
| Colorectum | FAP |  |
| ∗Top 15 enriched GO BP terms are showed in the bar plot of each disease state in each tissue. Each row represents a significant GO biological process which is colored according to the -log10(p.adjust). |
| Page: 1 2 3 4 5 6 7 8 9 |
| GO ID | Tissue | Disease Stage | Description | Gene Ratio | Bg Ratio | pvalue | p.adjust | Count |
| GO:00711661 | Liver | HCC | ribonucleoprotein complex localization | 59/7958 | 77/18723 | 1.09e-09 | 3.30e-08 | 59 |
| GO:00714261 | Liver | HCC | ribonucleoprotein complex export from nucleus | 58/7958 | 76/18723 | 1.98e-09 | 5.63e-08 | 58 |
| GO:00315031 | Liver | HCC | protein-containing complex localization | 129/7958 | 220/18723 | 9.38e-07 | 1.42e-05 | 129 |
| GO:00000544 | Liver | HCC | ribosomal subunit export from nucleus | 12/7958 | 14/18723 | 1.17e-03 | 6.54e-03 | 12 |
| GO:00337504 | Liver | HCC | ribosome localization | 12/7958 | 14/18723 | 1.17e-03 | 6.54e-03 | 12 |
| GO:00714282 | Liver | HCC | rRNA-containing ribonucleoprotein complex export from nucleus | 12/7958 | 15/18723 | 3.56e-03 | 1.59e-02 | 12 |
| GO:002261320 | Oral cavity | OSCC | ribonucleoprotein complex biogenesis | 333/7305 | 463/18723 | 8.28e-48 | 5.24e-44 | 333 |
| GO:004225420 | Oral cavity | OSCC | ribosome biogenesis | 230/7305 | 299/18723 | 3.22e-41 | 6.80e-38 | 230 |
| GO:000691317 | Oral cavity | OSCC | nucleocytoplasmic transport | 204/7305 | 301/18723 | 2.65e-24 | 6.98e-22 | 204 |
| GO:005116917 | Oral cavity | OSCC | nuclear transport | 204/7305 | 301/18723 | 2.65e-24 | 6.98e-22 | 204 |
| GO:005165610 | Oral cavity | OSCC | establishment of organelle localization | 239/7305 | 390/18723 | 2.46e-19 | 3.31e-17 | 239 |
| GO:005116817 | Oral cavity | OSCC | nuclear export | 112/7305 | 154/18723 | 1.70e-17 | 1.56e-15 | 112 |
| GO:004227420 | Oral cavity | OSCC | ribosomal small subunit biogenesis | 63/7305 | 73/18723 | 7.61e-17 | 6.34e-15 | 63 |
| GO:00711664 | Oral cavity | OSCC | ribonucleoprotein complex localization | 59/7305 | 77/18723 | 1.91e-11 | 6.57e-10 | 59 |
| GO:00714264 | Oral cavity | OSCC | ribonucleoprotein complex export from nucleus | 58/7305 | 76/18723 | 3.78e-11 | 1.23e-09 | 58 |
| GO:00315034 | Oral cavity | OSCC | protein-containing complex localization | 123/7305 | 220/18723 | 2.54e-07 | 4.00e-06 | 123 |
| GO:00000546 | Oral cavity | OSCC | ribosomal subunit export from nucleus | 12/7305 | 14/18723 | 4.62e-04 | 2.76e-03 | 12 |
| GO:00337506 | Oral cavity | OSCC | ribosome localization | 12/7305 | 14/18723 | 4.62e-04 | 2.76e-03 | 12 |
| GO:00714283 | Oral cavity | OSCC | rRNA-containing ribonucleoprotein complex export from nucleus | 12/7305 | 15/18723 | 1.49e-03 | 7.13e-03 | 12 |
| GO:0022613110 | Oral cavity | LP | ribonucleoprotein complex biogenesis | 259/4623 | 463/18723 | 7.20e-48 | 2.25e-44 | 259 |
| Page: 1 2 3 4 5 |
| Pathway ID | Tissue | Disease Stage | Description | Gene Ratio | Bg Ratio | pvalue | p.adjust | qvalue | Count |
| Page: 1 |
Top |
Cell-cell communication analysis |
| Identification of potential cell-cell interactions between two cell types and their ligand-receptor pairs for different disease states |
| Ligand | Receptor | LRpair | Pathway | Tissue | Disease Stage |
| Page: 1 |
Top |
Single-cell gene regulatory network inference analysis |
| Find out the significant the regulons (TFs) and the target genes of each regulon across cell types for different disease states |
| TF | Cell Type | Tissue | Disease Stage | Target Gene | RSS | Regulon Activity |
| ∗The dot plots of a searched regulon are shown for all cell subpopulations in each disease state of each tissue based on the regulon specific score inferred using pySCENIC and by calculating the average expression. |
| Page: 1 |
Top |
Somatic mutation of malignant transformation related genes |
| Annotation of somatic variants for genes involved in malignant transformation |
| Hugo Symbol | Variant Class | Variant Classification | dbSNP RS | HGVSc | HGVSp | HGVSp Short | SWISSPROT | BIOTYPE | SIFT | PolyPhen | Tumor Sample Barcode | Tissue | Histology | Sex | Age | Stage | Therapy Types | Drugs | Outcome |
| LTV1 | SNV | Missense_Mutation | novel | c.1384N>C | p.Glu462Gln | p.E462Q | Q96GA3 | protein_coding | tolerated(0.56) | benign(0.028) | TCGA-A2-A0D0-01 | Breast | breast invasive carcinoma | Female | <65 | I/II | Chemotherapy | cytoxan | SD |
| LTV1 | SNV | Missense_Mutation | c.955N>A | p.Glu319Lys | p.E319K | Q96GA3 | protein_coding | tolerated(0.48) | benign(0.013) | TCGA-C8-A26W-01 | Breast | breast invasive carcinoma | Female | <65 | I/II | Chemotherapy | doxorubicin | CR | |
| LTV1 | insertion | Nonsense_Mutation | novel | c.383_384insTTAGAAATAATGAATAACCCCTAGAAACAGTGTAAG | p.Ala128_Ala129insTer | p.A128_A129ins* | Q96GA3 | protein_coding | TCGA-AO-A0J9-01 | Breast | breast invasive carcinoma | Female | <65 | III/IV | Chemotherapy | cyclophosphamide | PD | ||
| LTV1 | SNV | Missense_Mutation | novel | c.1284N>T | p.Arg428Ser | p.R428S | Q96GA3 | protein_coding | deleterious(0.04) | benign(0.145) | TCGA-DS-A1OC-01 | Cervix | cervical & endocervical cancer | Female | <65 | I/II | Chemotherapy | gemcitabine | SD |
| LTV1 | SNV | Missense_Mutation | novel | c.1309G>C | p.Glu437Gln | p.E437Q | Q96GA3 | protein_coding | tolerated(0.19) | benign(0.217) | TCGA-MA-AA3Z-01 | Cervix | cervical & endocervical cancer | Female | <65 | I/II | Unknown | Unknown | SD |
| LTV1 | insertion | Frame_Shift_Ins | novel | c.1282_1283insAGTTATT | p.Arg428LysfsTer23 | p.R428Kfs*23 | Q96GA3 | protein_coding | TCGA-DS-A1OC-01 | Cervix | cervical & endocervical cancer | Female | <65 | I/II | Chemotherapy | gemcitabine | SD | ||
| LTV1 | SNV | Missense_Mutation | c.702N>T | p.Glu234Asp | p.E234D | Q96GA3 | protein_coding | tolerated(0.07) | possibly_damaging(0.498) | TCGA-AA-3811-01 | Colorectum | colon adenocarcinoma | Female | >=65 | III/IV | Unknown | Unknown | PD | |
| LTV1 | SNV | Missense_Mutation | rs765002958 | c.404N>A | p.Arg135Gln | p.R135Q | Q96GA3 | protein_coding | tolerated(0.16) | benign(0.236) | TCGA-CA-6718-01 | Colorectum | colon adenocarcinoma | Male | <65 | I/II | Unknown | Unknown | PD |
| LTV1 | SNV | Missense_Mutation | c.20N>G | p.Lys7Arg | p.K7R | Q96GA3 | protein_coding | deleterious(0.02) | benign(0.42) | TCGA-CM-6162-01 | Colorectum | colon adenocarcinoma | Female | <65 | III/IV | Chemotherapy | oxaliplatin | SD | |
| LTV1 | SNV | Missense_Mutation | rs201630595 | c.1313G>A | p.Arg438His | p.R438H | Q96GA3 | protein_coding | deleterious(0) | probably_damaging(0.996) | TCGA-G4-6628-01 | Colorectum | colon adenocarcinoma | Male | >=65 | I/II | Unknown | Unknown | SD |
| Page: 1 2 3 4 5 |
Top |
Related drugs of malignant transformation related genes |
| Identification of chemicals and drugs interact with genes involved in malignant transfromation |
| (DGIdb 4.0) |
| Entrez ID | Symbol | Category | Interaction Types | Drug Claim Name | Drug Name | PMIDs |
| Page: 1 |

Copyright 2023-Present -The University of Texas Health Science Center at Houston |