
|
|||||
|
 | |
| |
| |
| |
| |
| |
|
Gene: LSS |
Gene summary for LSS |
| Gene information | Species | Human | Gene symbol | LSS | Gene ID | 4047 |
| Gene name | lanosterol synthase | |
| Gene Alias | APMR4 | |
| Cytomap | 21q22.3 | |
| Gene Type | protein-coding | GO ID | GO:0006066 | UniProtAcc | B2R694 |
Top |
Malignant transformation analysis |
| Identification of the aberrant gene expression in precancerous and cancerous lesions by comparing the gene expression of stem-like cells in diseased tissues with normal stem cells |
| Entrez ID | Symbol | Replicates | Species | Organ | Tissue | Adj P-value | Log2FC | Malignancy |
| 4047 | LSS | LZE24T | Human | Esophagus | ESCC | 9.82e-07 | 2.76e-01 | 0.0596 |
| 4047 | LSS | P2T-E | Human | Esophagus | ESCC | 1.02e-09 | 1.23e-01 | 0.1177 |
| 4047 | LSS | P4T-E | Human | Esophagus | ESCC | 5.69e-08 | 2.74e-01 | 0.1323 |
| 4047 | LSS | P5T-E | Human | Esophagus | ESCC | 1.08e-16 | 4.35e-02 | 0.1327 |
| 4047 | LSS | P8T-E | Human | Esophagus | ESCC | 7.81e-04 | 5.95e-02 | 0.0889 |
| 4047 | LSS | P9T-E | Human | Esophagus | ESCC | 6.56e-03 | 6.86e-02 | 0.1131 |
| 4047 | LSS | P10T-E | Human | Esophagus | ESCC | 3.93e-28 | 6.49e-01 | 0.116 |
| 4047 | LSS | P11T-E | Human | Esophagus | ESCC | 6.99e-04 | 1.48e-01 | 0.1426 |
| 4047 | LSS | P12T-E | Human | Esophagus | ESCC | 2.17e-09 | 1.63e-01 | 0.1122 |
| 4047 | LSS | P15T-E | Human | Esophagus | ESCC | 2.54e-03 | 3.90e-02 | 0.1149 |
| 4047 | LSS | P16T-E | Human | Esophagus | ESCC | 1.05e-11 | 1.76e-01 | 0.1153 |
| 4047 | LSS | P20T-E | Human | Esophagus | ESCC | 6.41e-05 | 3.48e-02 | 0.1124 |
| 4047 | LSS | P21T-E | Human | Esophagus | ESCC | 2.35e-16 | 2.57e-01 | 0.1617 |
| 4047 | LSS | P22T-E | Human | Esophagus | ESCC | 2.51e-09 | 1.34e-01 | 0.1236 |
| 4047 | LSS | P24T-E | Human | Esophagus | ESCC | 6.61e-09 | 4.58e-02 | 0.1287 |
| 4047 | LSS | P26T-E | Human | Esophagus | ESCC | 8.69e-14 | 1.08e-01 | 0.1276 |
| 4047 | LSS | P27T-E | Human | Esophagus | ESCC | 1.93e-16 | 1.42e-01 | 0.1055 |
| 4047 | LSS | P28T-E | Human | Esophagus | ESCC | 1.83e-16 | 4.02e-01 | 0.1149 |
| 4047 | LSS | P30T-E | Human | Esophagus | ESCC | 3.25e-15 | 4.88e-01 | 0.137 |
| 4047 | LSS | P31T-E | Human | Esophagus | ESCC | 2.96e-11 | 8.09e-02 | 0.1251 |
| Page: 1 2 3 4 |
| Tissue | Expression Dynamics | Abbreviation |
| Esophagus | 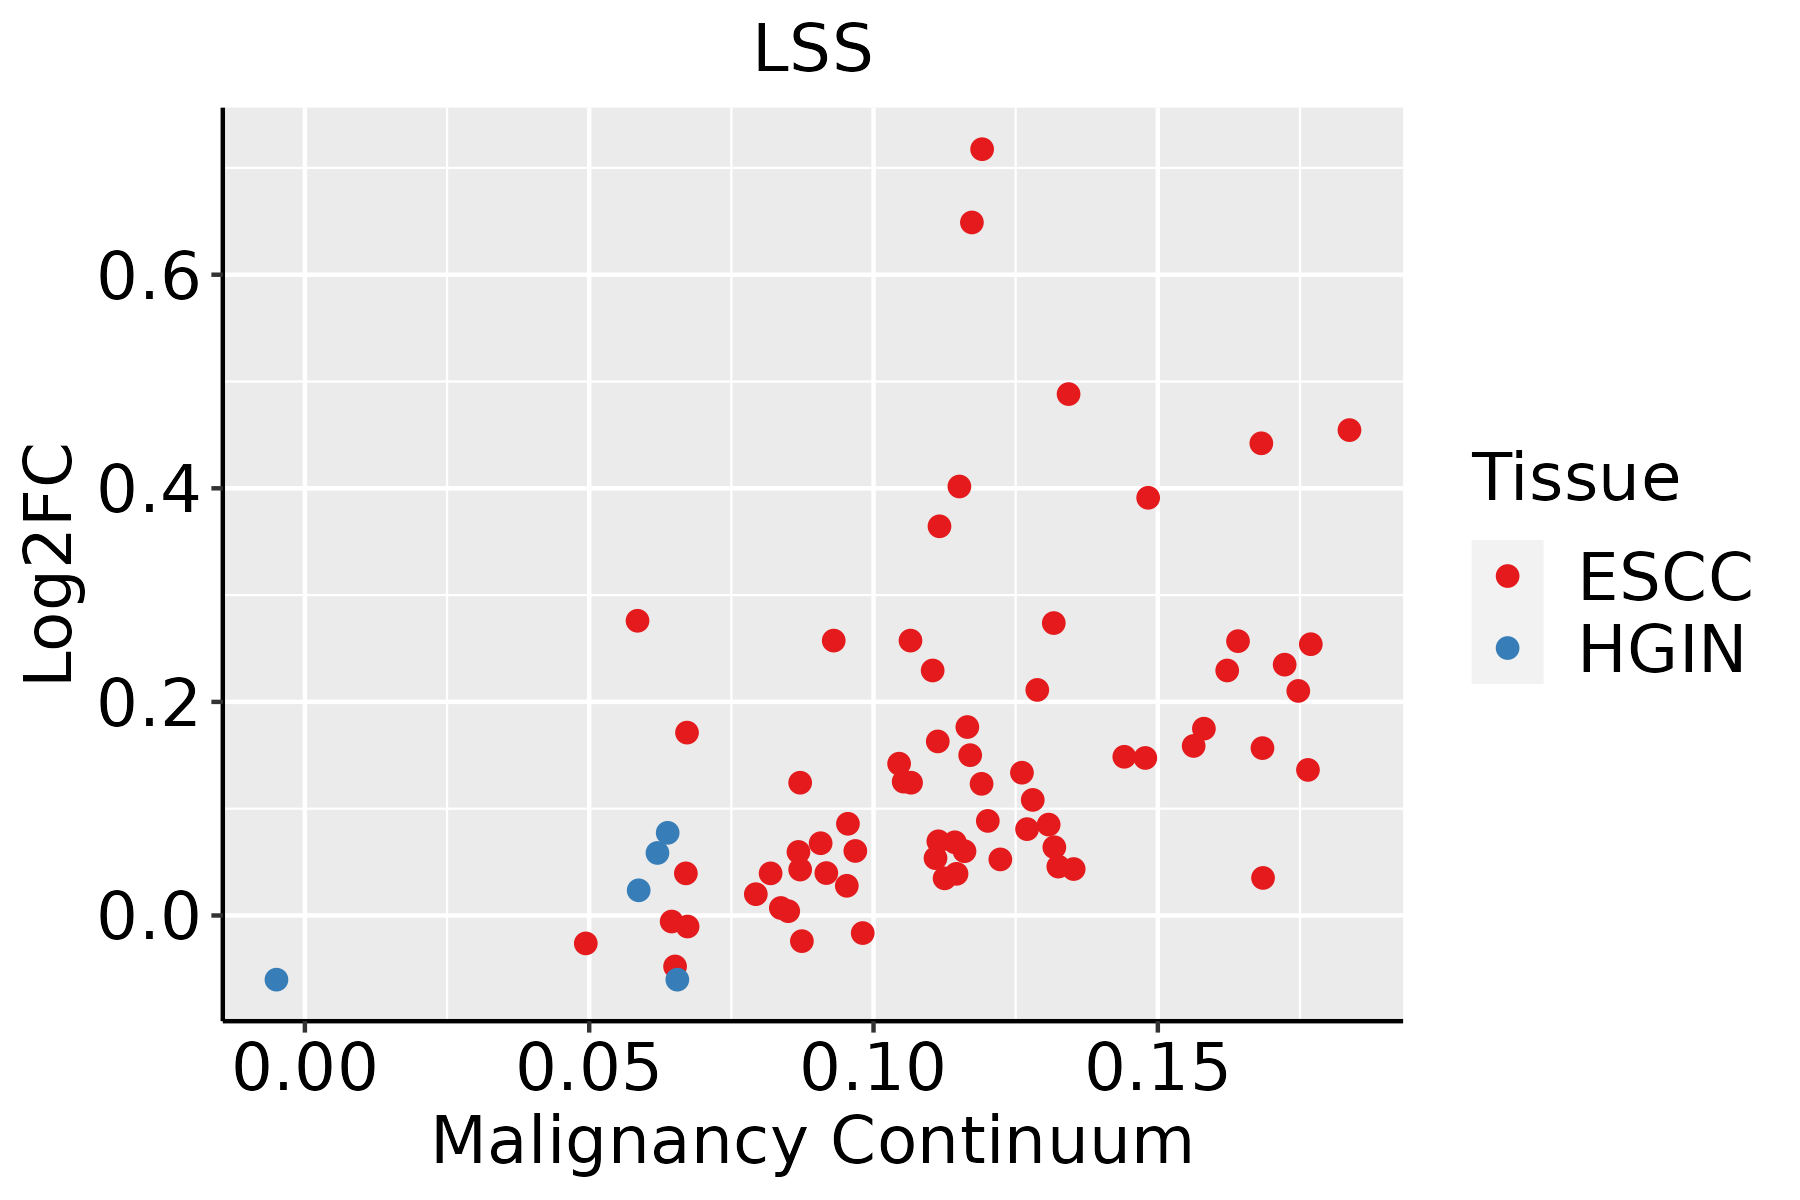 | ESCC: Esophageal squamous cell carcinoma |
| HGIN: High-grade intraepithelial neoplasias | ||
| LGIN: Low-grade intraepithelial neoplasias | ||
| Liver | 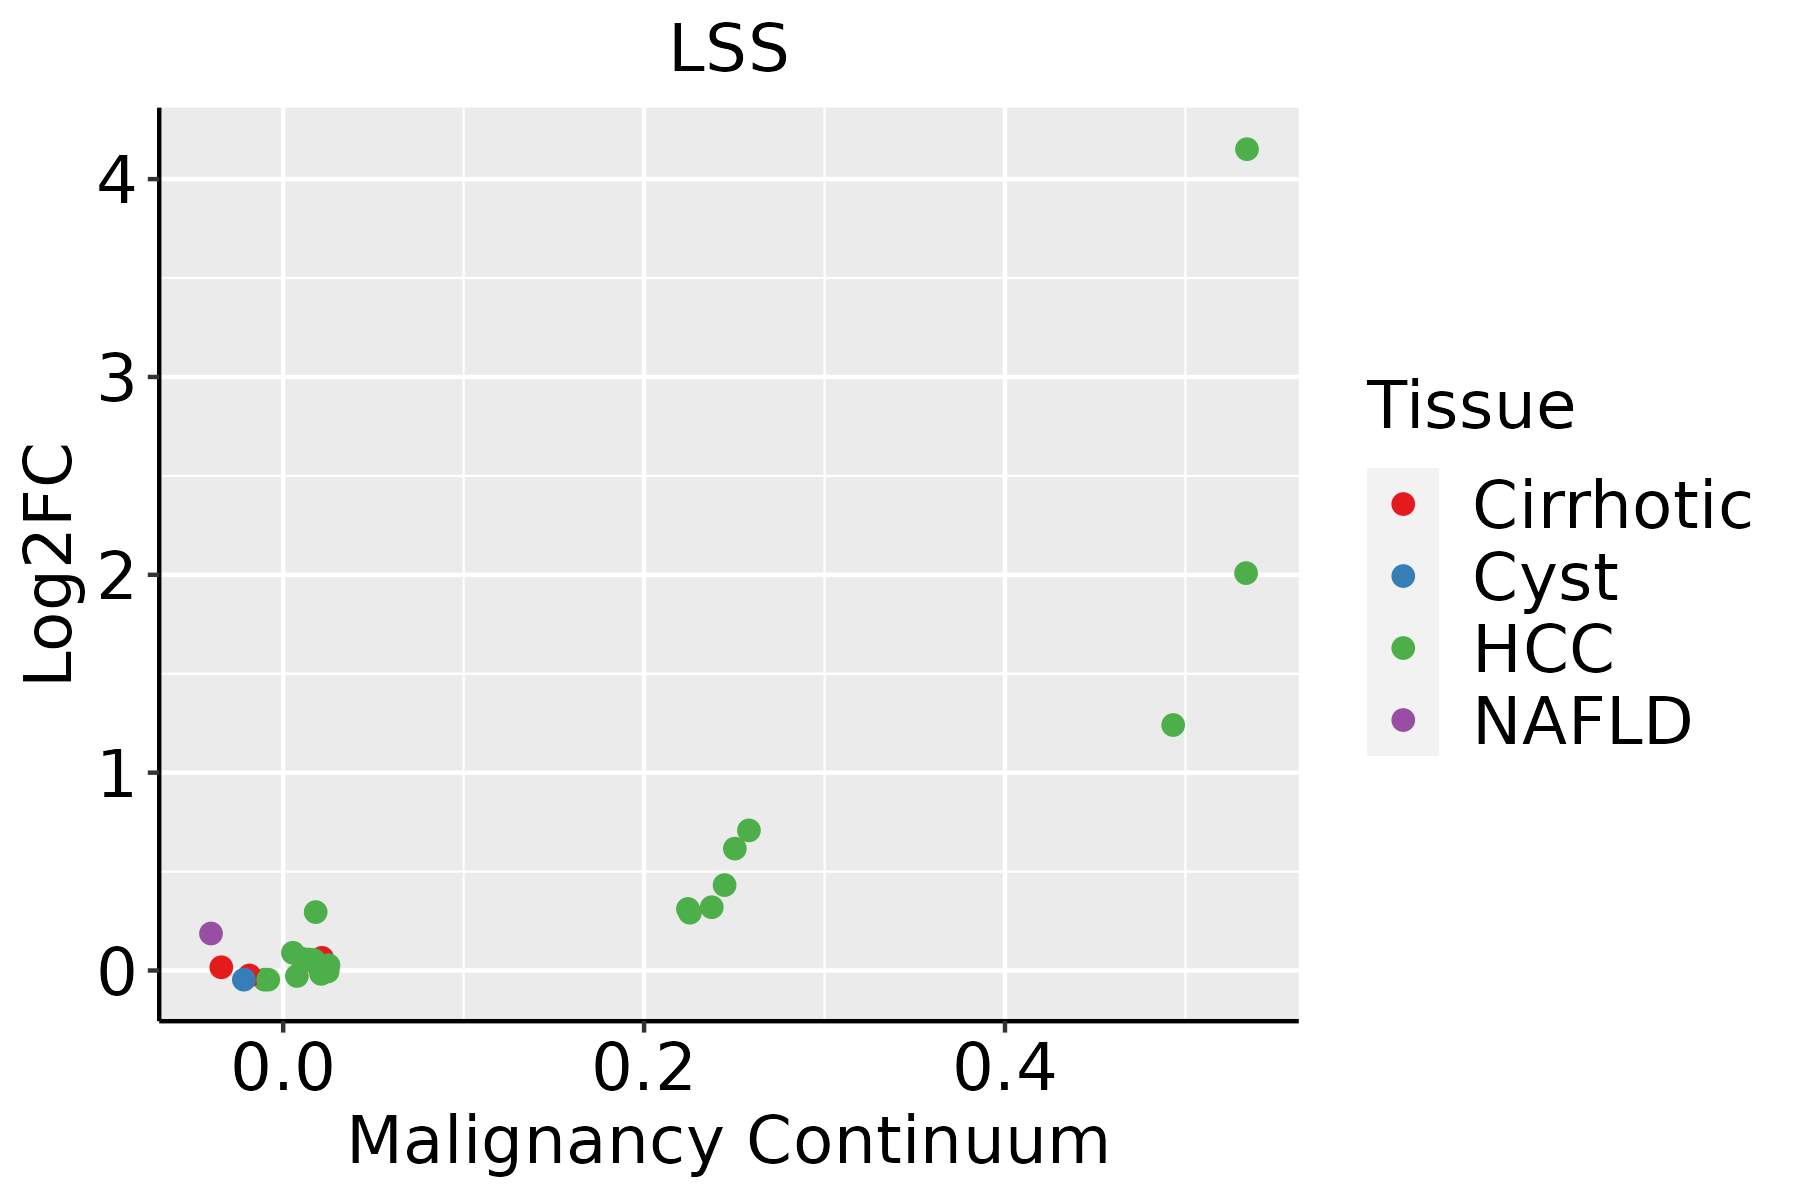 | HCC: Hepatocellular carcinoma |
| NAFLD: Non-alcoholic fatty liver disease | ||
| Oral Cavity | 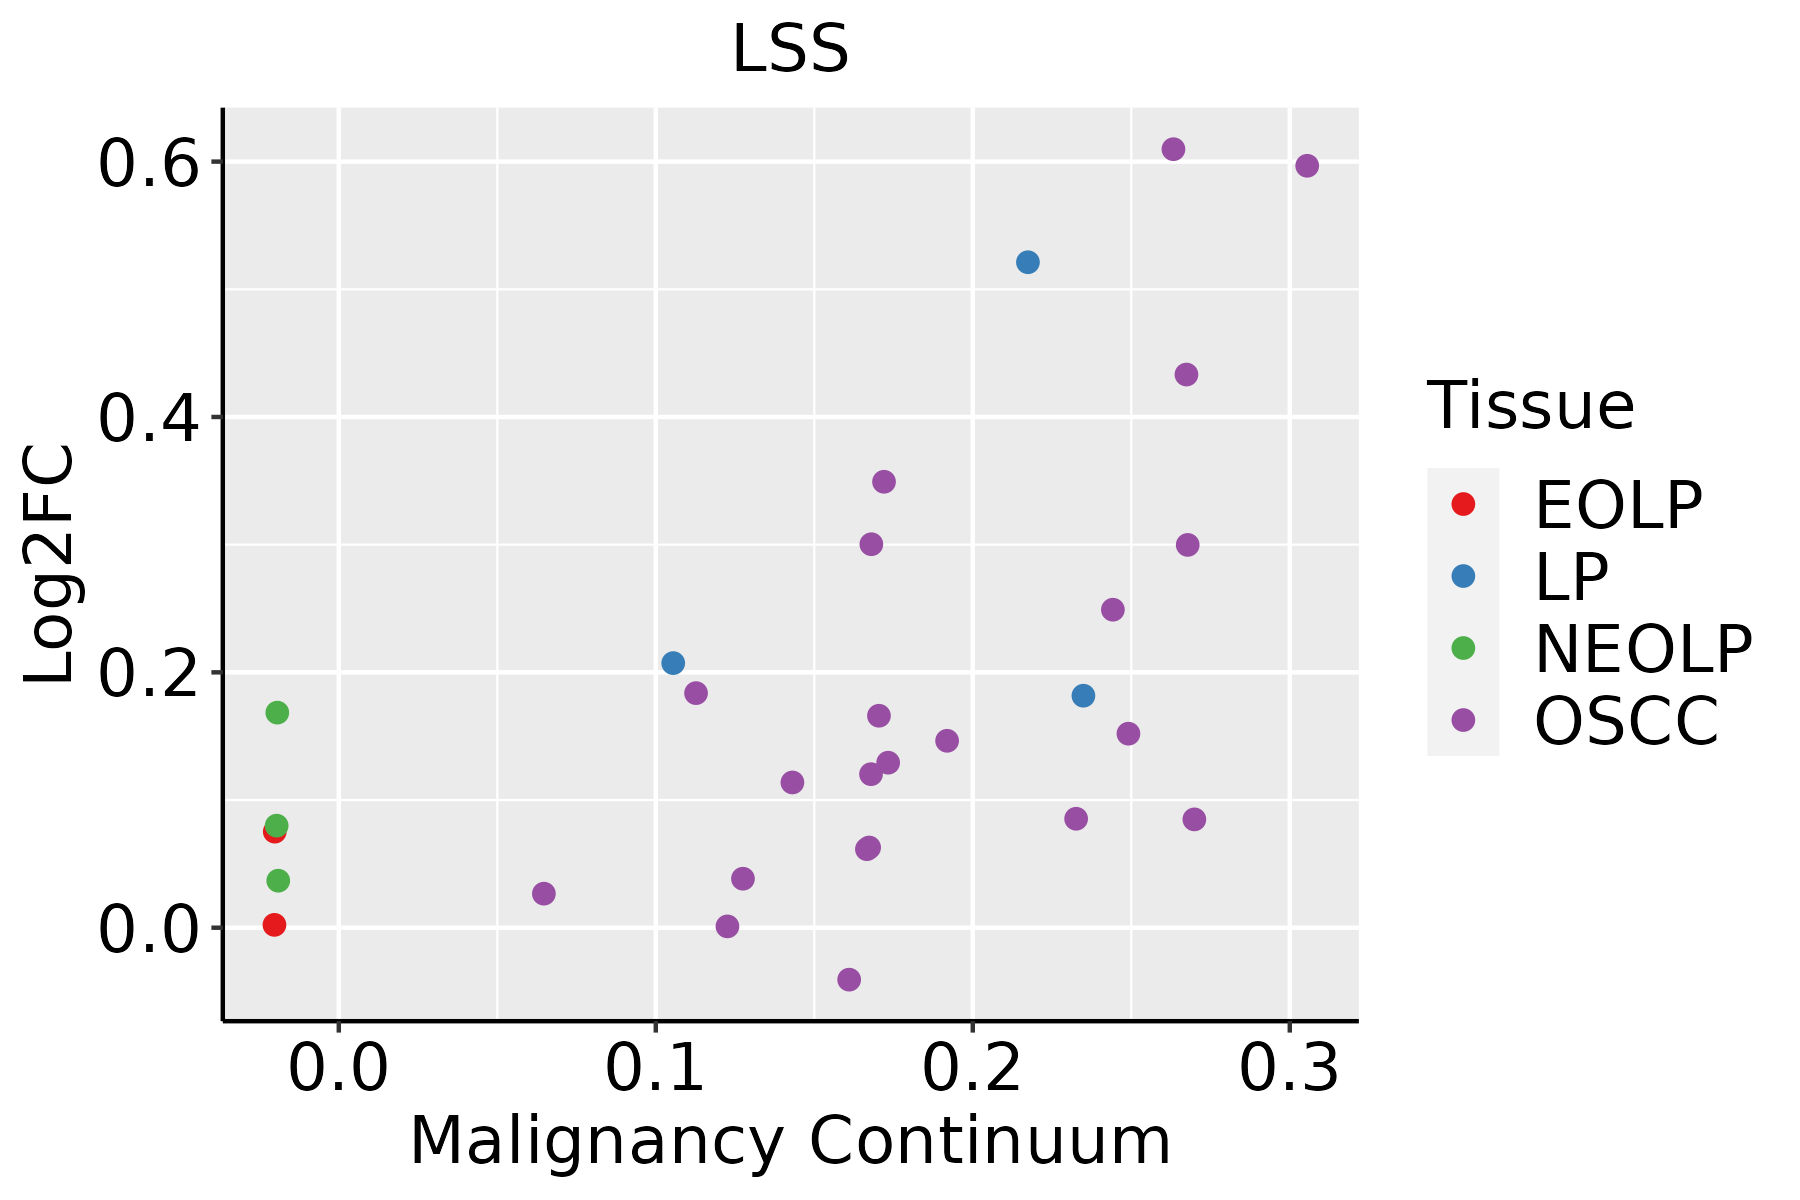 | EOLP: Erosive Oral lichen planus |
| LP: leukoplakia | ||
| NEOLP: Non-erosive oral lichen planus | ||
| OSCC: Oral squamous cell carcinoma |
| ∗log2FC in expression of this searched gene in stem-like cells from each diseased tissue sample relative to stem-like cells in normal samples in each tissue plotted against the malignancy continuum. Samples are colored based on if they are from different disease stage. |
Top |
Malignant transformation related pathway analysis |
| Find out the enriched GO biological processes and KEGG pathways involved in transition from healthy to precancer to cancer |
| Tissue | Disease Stage | Enriched GO biological Processes |
| Colorectum | AD |  |
| Colorectum | SER |  |
| Colorectum | MSS |  |
| Colorectum | MSI-H |  |
| Colorectum | FAP |  |
| ∗Top 15 enriched GO BP terms are showed in the bar plot of each disease state in each tissue. Each row represents a significant GO biological process which is colored according to the -log10(p.adjust). |
| Page: 1 2 3 4 5 6 7 8 9 |
| GO ID | Tissue | Disease Stage | Description | Gene Ratio | Bg Ratio | pvalue | p.adjust | Count |
| GO:00161261 | Liver | HCC | sterol biosynthetic process | 47/7958 | 64/18723 | 5.00e-07 | 8.11e-06 | 47 |
| GO:00066942 | Liver | HCC | steroid biosynthetic process | 104/7958 | 173/18723 | 2.13e-06 | 2.91e-05 | 104 |
| GO:19016172 | Liver | HCC | organic hydroxy compound biosynthetic process | 129/7958 | 237/18723 | 1.32e-04 | 1.08e-03 | 129 |
| GO:00461651 | Liver | HCC | alcohol biosynthetic process | 81/7958 | 140/18723 | 1.73e-04 | 1.36e-03 | 81 |
| GO:000672011 | Liver | HCC | isoprenoid metabolic process | 65/7958 | 116/18723 | 2.23e-03 | 1.11e-02 | 65 |
| GO:003164720 | Oral cavity | OSCC | regulation of protein stability | 193/7305 | 298/18723 | 1.30e-19 | 1.95e-17 | 193 |
| GO:00060667 | Oral cavity | OSCC | alcohol metabolic process | 179/7305 | 353/18723 | 4.54e-06 | 5.21e-05 | 179 |
| GO:00461652 | Oral cavity | OSCC | alcohol biosynthetic process | 77/7305 | 140/18723 | 8.77e-05 | 6.70e-04 | 77 |
| GO:00066952 | Oral cavity | OSCC | cholesterol biosynthetic process | 36/7305 | 57/18723 | 1.91e-04 | 1.28e-03 | 36 |
| GO:19026532 | Oral cavity | OSCC | secondary alcohol biosynthetic process | 36/7305 | 57/18723 | 1.91e-04 | 1.28e-03 | 36 |
| GO:19026523 | Oral cavity | OSCC | secondary alcohol metabolic process | 79/7305 | 147/18723 | 1.98e-04 | 1.33e-03 | 79 |
| GO:00161262 | Oral cavity | OSCC | sterol biosynthetic process | 39/7305 | 64/18723 | 3.12e-04 | 1.94e-03 | 39 |
| GO:0008299 | Oral cavity | OSCC | isoprenoid biosynthetic process | 20/7305 | 28/18723 | 5.13e-04 | 2.99e-03 | 20 |
| GO:00066945 | Oral cavity | OSCC | steroid biosynthetic process | 89/7305 | 173/18723 | 5.77e-04 | 3.30e-03 | 89 |
| GO:00082033 | Oral cavity | OSCC | cholesterol metabolic process | 72/7305 | 137/18723 | 8.63e-04 | 4.55e-03 | 72 |
| GO:19016173 | Oral cavity | OSCC | organic hydroxy compound biosynthetic process | 115/7305 | 237/18723 | 1.73e-03 | 8.18e-03 | 115 |
| GO:00161253 | Oral cavity | OSCC | sterol metabolic process | 77/7305 | 152/18723 | 2.26e-03 | 1.00e-02 | 77 |
| GO:00067203 | Oral cavity | OSCC | isoprenoid metabolic process | 59/7305 | 116/18723 | 6.18e-03 | 2.33e-02 | 59 |
| GO:00082024 | Oral cavity | OSCC | steroid metabolic process | 146/7305 | 319/18723 | 7.78e-03 | 2.85e-02 | 146 |
| GO:0031647110 | Oral cavity | LP | regulation of protein stability | 132/4623 | 298/18723 | 8.16e-14 | 7.99e-12 | 132 |
| Page: 1 2 3 |
| Pathway ID | Tissue | Disease Stage | Description | Gene Ratio | Bg Ratio | pvalue | p.adjust | qvalue | Count |
| hsa001005 | Esophagus | ESCC | Steroid biosynthesis | 18/4205 | 20/8465 | 1.78e-04 | 6.79e-04 | 3.48e-04 | 18 |
| hsa0010012 | Esophagus | ESCC | Steroid biosynthesis | 18/4205 | 20/8465 | 1.78e-04 | 6.79e-04 | 3.48e-04 | 18 |
| hsa001002 | Liver | HCC | Steroid biosynthesis | 15/4020 | 20/8465 | 1.17e-02 | 2.97e-02 | 1.65e-02 | 15 |
| hsa001003 | Liver | HCC | Steroid biosynthesis | 15/4020 | 20/8465 | 1.17e-02 | 2.97e-02 | 1.65e-02 | 15 |
| hsa001004 | Oral cavity | OSCC | Steroid biosynthesis | 15/3704 | 20/8465 | 4.62e-03 | 1.13e-02 | 5.75e-03 | 15 |
| hsa0010011 | Oral cavity | OSCC | Steroid biosynthesis | 15/3704 | 20/8465 | 4.62e-03 | 1.13e-02 | 5.75e-03 | 15 |
| hsa0010021 | Oral cavity | LP | Steroid biosynthesis | 11/2418 | 20/8465 | 1.16e-02 | 3.91e-02 | 2.52e-02 | 11 |
| hsa0010031 | Oral cavity | LP | Steroid biosynthesis | 11/2418 | 20/8465 | 1.16e-02 | 3.91e-02 | 2.52e-02 | 11 |
| Page: 1 |
Top |
Cell-cell communication analysis |
| Identification of potential cell-cell interactions between two cell types and their ligand-receptor pairs for different disease states |
| Ligand | Receptor | LRpair | Pathway | Tissue | Disease Stage |
| Page: 1 |
Top |
Single-cell gene regulatory network inference analysis |
| Find out the significant the regulons (TFs) and the target genes of each regulon across cell types for different disease states |
| TF | Cell Type | Tissue | Disease Stage | Target Gene | RSS | Regulon Activity |
| ∗The dot plots of a searched regulon are shown for all cell subpopulations in each disease state of each tissue based on the regulon specific score inferred using pySCENIC and by calculating the average expression. |
| Page: 1 |
Top |
Somatic mutation of malignant transformation related genes |
| Annotation of somatic variants for genes involved in malignant transformation |
| Hugo Symbol | Variant Class | Variant Classification | dbSNP RS | HGVSc | HGVSp | HGVSp Short | SWISSPROT | BIOTYPE | SIFT | PolyPhen | Tumor Sample Barcode | Tissue | Histology | Sex | Age | Stage | Therapy Types | Drugs | Outcome |
| LSS | SNV | Missense_Mutation | rs561449819 | c.1762N>A | p.Gly588Ser | p.G588S | P48449 | protein_coding | deleterious(0.01) | probably_damaging(0.973) | TCGA-2W-A8YY-01 | Cervix | cervical & endocervical cancer | Female | <65 | I/II | Chemotherapy | cisplatin | CR |
| LSS | SNV | Missense_Mutation | c.214A>C | p.Thr72Pro | p.T72P | P48449 | protein_coding | deleterious(0.01) | possibly_damaging(0.805) | TCGA-FU-A3HZ-01 | Cervix | cervical & endocervical cancer | Female | <65 | I/II | Chemotherapy | cisplatin | CR | |
| LSS | SNV | Missense_Mutation | c.999N>G | p.Ile333Met | p.I333M | P48449 | protein_coding | tolerated(0.17) | probably_damaging(0.942) | TCGA-IR-A3LA-01 | Cervix | cervical & endocervical cancer | Female | <65 | I/II | Chemotherapy | cisplatin | CR | |
| LSS | SNV | Missense_Mutation | c.749N>T | p.Ala250Val | p.A250V | P48449 | protein_coding | tolerated(0.2) | possibly_damaging(0.644) | TCGA-AA-A00N-01 | Colorectum | colon adenocarcinoma | Male | >=65 | I/II | Unknown | Unknown | PD | |
| LSS | SNV | Missense_Mutation | rs762530682 | c.1168N>A | p.Ala390Thr | p.A390T | P48449 | protein_coding | deleterious(0.05) | possibly_damaging(0.596) | TCGA-AA-A010-01 | Colorectum | colon adenocarcinoma | Female | <65 | I/II | Chemotherapy | folinic | CR |
| LSS | SNV | Missense_Mutation | rs200708561 | c.386N>A | p.Arg129Gln | p.R129Q | P48449 | protein_coding | deleterious(0.04) | probably_damaging(1) | TCGA-AA-A01R-01 | Colorectum | colon adenocarcinoma | Male | <65 | III/IV | Chemotherapy | 5-fluorouracil | PD |
| LSS | SNV | Missense_Mutation | c.1317N>T | p.Lys439Asn | p.K439N | P48449 | protein_coding | deleterious(0) | possibly_damaging(0.866) | TCGA-AD-5900-01 | Colorectum | colon adenocarcinoma | Male | >=65 | I/II | Unknown | Unknown | SD | |
| LSS | SNV | Missense_Mutation | c.841N>A | p.Ala281Thr | p.A281T | P48449 | protein_coding | deleterious(0.02) | possibly_damaging(0.581) | TCGA-AD-6901-01 | Colorectum | colon adenocarcinoma | Male | >=65 | I/II | Chemotherapy | xeloda | PD | |
| LSS | SNV | Missense_Mutation | rs375698498 | c.1348G>A | p.Gly450Ser | p.G450S | P48449 | protein_coding | tolerated(0.05) | probably_damaging(1) | TCGA-AZ-6598-01 | Colorectum | colon adenocarcinoma | Female | >=65 | I/II | Unknown | Unknown | SD |
| LSS | SNV | Missense_Mutation | novel | c.642N>T | p.Glu214Asp | p.E214D | P48449 | protein_coding | deleterious(0) | possibly_damaging(0.858) | TCGA-CA-6717-01 | Colorectum | colon adenocarcinoma | Male | <65 | I/II | Chemotherapy | oxaliplatin | CR |
| Page: 1 2 3 4 5 6 7 8 |
Top |
Related drugs of malignant transformation related genes |
| Identification of chemicals and drugs interact with genes involved in malignant transfromation |
| (DGIdb 4.0) |
| Entrez ID | Symbol | Category | Interaction Types | Drug Claim Name | Drug Name | PMIDs |
| 4047 | LSS | ENZYME, DRUGGABLE GENOME | inhibitor | 178103329 | ||
| 4047 | LSS | ENZYME, DRUGGABLE GENOME | inhibitor | 178103323 | ||
| 4047 | LSS | ENZYME, DRUGGABLE GENOME | inhibitor | 178103320 | ||
| 4047 | LSS | ENZYME, DRUGGABLE GENOME | inhibitor | 178103325 | ||
| 4047 | LSS | ENZYME, DRUGGABLE GENOME | inhibitor | 178103321 | ||
| 4047 | LSS | ENZYME, DRUGGABLE GENOME | inhibitor | 178103333 | ||
| 4047 | LSS | ENZYME, DRUGGABLE GENOME | inhibitor | 178103324 | ||
| 4047 | LSS | ENZYME, DRUGGABLE GENOME | inhibitor | 178103327 | ||
| 4047 | LSS | ENZYME, DRUGGABLE GENOME | inhibitor | 178103326 | ||
| 4047 | LSS | ENZYME, DRUGGABLE GENOME | inhibitor | 178103322 |
| Page: 1 2 |

Copyright 2023-Present -The University of Texas Health Science Center at Houston |