
|
|||||
|
 | |
| |
| |
| |
| |
| |
|
Gene: LSR |
Gene summary for LSR |
| Gene information | Species | Human | Gene symbol | LSR | Gene ID | 51599 |
| Gene name | lipolysis stimulated lipoprotein receptor | |
| Gene Alias | ILDR3 | |
| Cytomap | 19q13.12 | |
| Gene Type | protein-coding | GO ID | GO:0001889 | UniProtAcc | Q86X29 |
Top |
Malignant transformation analysis |
| Identification of the aberrant gene expression in precancerous and cancerous lesions by comparing the gene expression of stem-like cells in diseased tissues with normal stem cells |
| Entrez ID | Symbol | Replicates | Species | Organ | Tissue | Adj P-value | Log2FC | Malignancy |
| 51599 | LSR | GSM4909281 | Human | Breast | IDC | 5.53e-19 | 5.72e-01 | 0.21 |
| 51599 | LSR | GSM4909282 | Human | Breast | IDC | 5.58e-33 | 8.20e-01 | -0.0288 |
| 51599 | LSR | GSM4909285 | Human | Breast | IDC | 2.29e-29 | 5.94e-01 | 0.21 |
| 51599 | LSR | GSM4909293 | Human | Breast | IDC | 1.17e-04 | 1.65e-01 | 0.1581 |
| 51599 | LSR | GSM4909295 | Human | Breast | IDC | 2.73e-03 | 4.45e-01 | 0.0898 |
| 51599 | LSR | GSM4909296 | Human | Breast | IDC | 9.67e-03 | 3.66e-02 | 0.1524 |
| 51599 | LSR | GSM4909297 | Human | Breast | IDC | 2.07e-02 | 1.76e-02 | 0.1517 |
| 51599 | LSR | GSM4909311 | Human | Breast | IDC | 2.74e-16 | -1.31e-01 | 0.1534 |
| 51599 | LSR | GSM4909312 | Human | Breast | IDC | 2.08e-03 | 4.30e-02 | 0.1552 |
| 51599 | LSR | GSM4909317 | Human | Breast | IDC | 3.29e-04 | 3.63e-01 | 0.1355 |
| 51599 | LSR | GSM4909319 | Human | Breast | IDC | 3.87e-18 | -1.25e-01 | 0.1563 |
| 51599 | LSR | GSM4909321 | Human | Breast | IDC | 3.75e-05 | -2.99e-03 | 0.1559 |
| 51599 | LSR | brca1 | Human | Breast | Precancer | 4.26e-10 | 4.31e-01 | -0.0338 |
| 51599 | LSR | brca2 | Human | Breast | Precancer | 2.72e-07 | 3.63e-01 | -0.024 |
| 51599 | LSR | brca3 | Human | Breast | Precancer | 3.20e-15 | 4.25e-01 | -0.0263 |
| 51599 | LSR | NCCBC2 | Human | Breast | DCIS | 3.41e-03 | -8.36e-03 | 0.1554 |
| 51599 | LSR | NCCBC5 | Human | Breast | DCIS | 1.90e-10 | 3.96e-01 | 0.2046 |
| 51599 | LSR | P1 | Human | Breast | IDC | 1.90e-05 | -1.31e-01 | 0.1527 |
| 51599 | LSR | P2 | Human | Breast | IDC | 4.93e-02 | 9.44e-02 | 0.21 |
| 51599 | LSR | DCIS2 | Human | Breast | DCIS | 1.63e-51 | 2.45e-01 | 0.0085 |
| Page: 1 2 3 4 5 6 7 8 9 |
| Tissue | Expression Dynamics | Abbreviation |
| Breast |  | IDC: Invasive ductal carcinoma |
| DCIS: Ductal carcinoma in situ | ||
| Precancer(BRCA1-mut): Precancerous lesion from BRCA1 mutation carriers | ||
| Cervix | 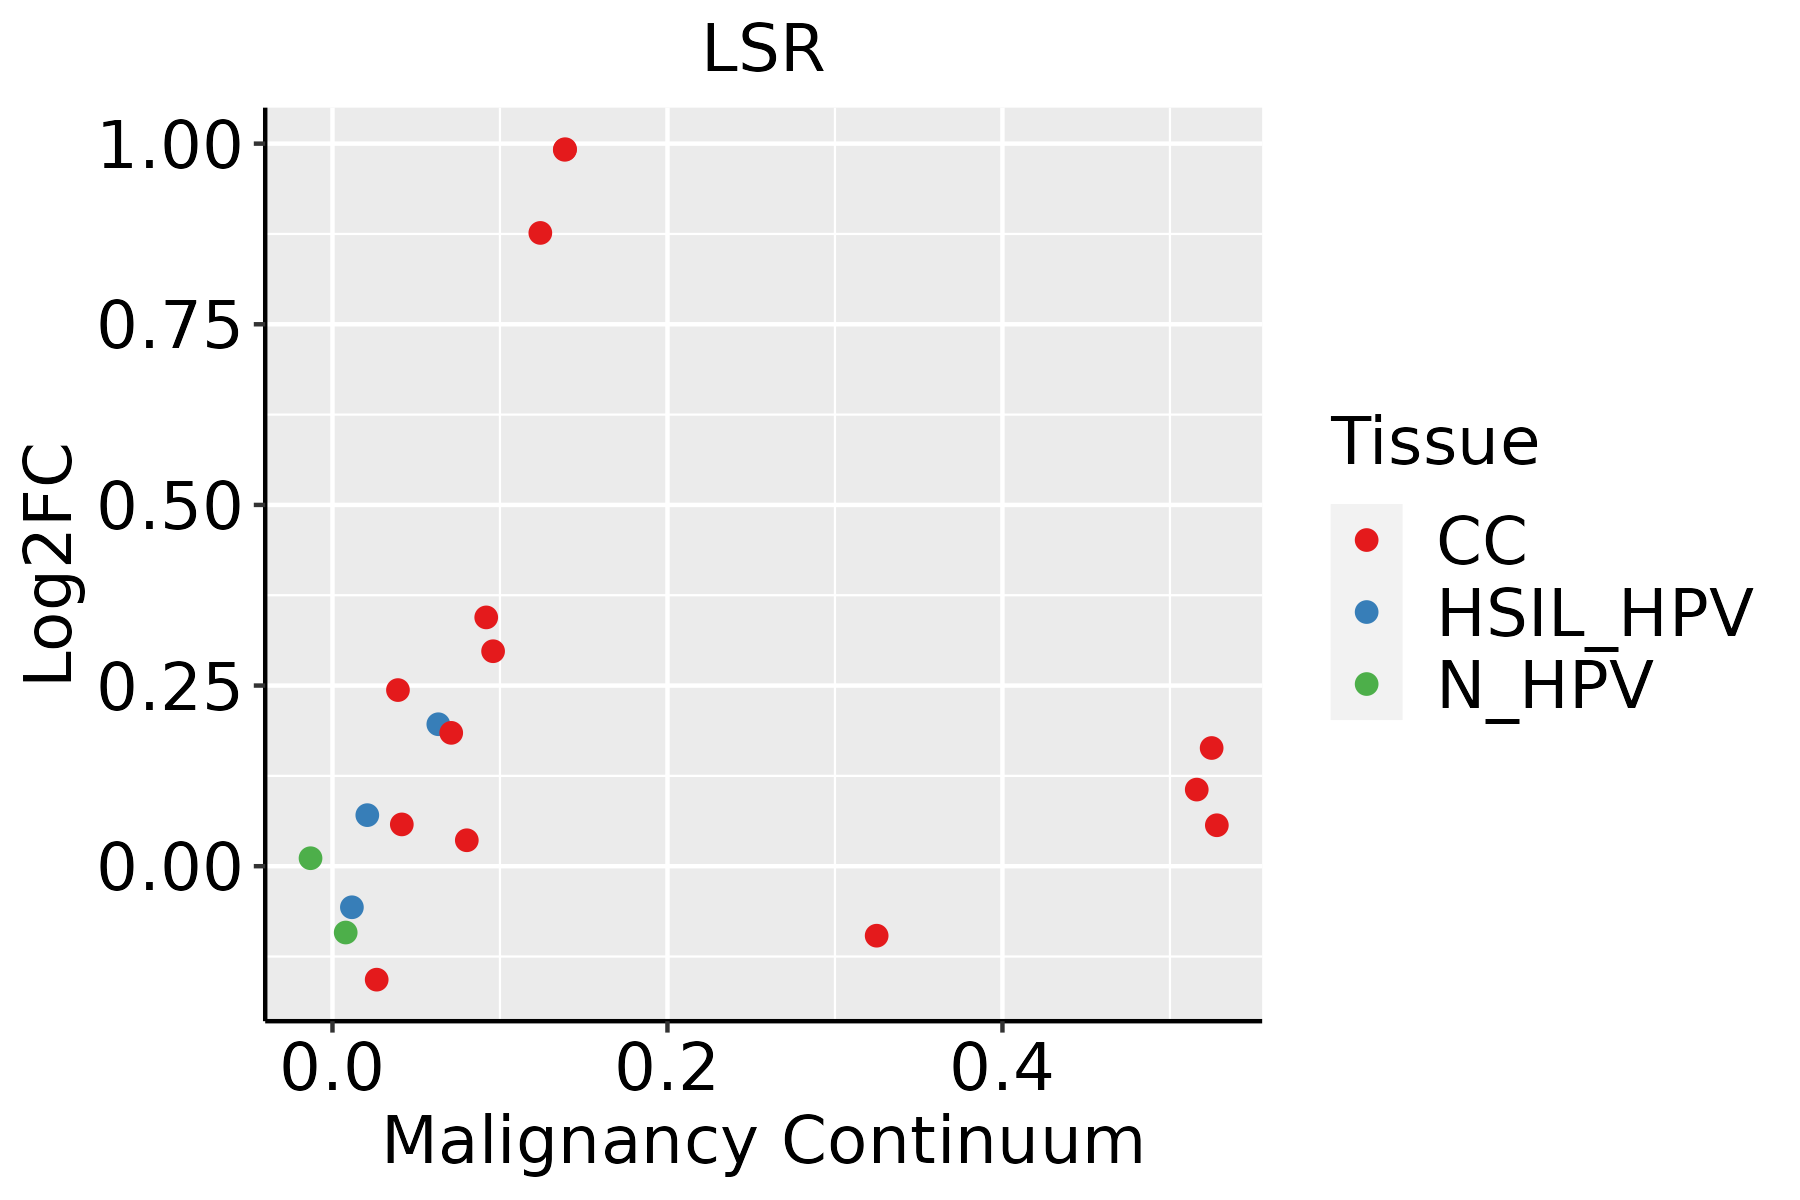 | CC: Cervix cancer |
| HSIL_HPV: HPV-infected high-grade squamous intraepithelial lesions | ||
| N_HPV: HPV-infected normal cervix | ||
| Colorectum (GSE201348) |  | FAP: Familial adenomatous polyposis |
| CRC: Colorectal cancer | ||
| Colorectum (HTA11) |  | AD: Adenomas |
| SER: Sessile serrated lesions | ||
| MSI-H: Microsatellite-high colorectal cancer | ||
| MSS: Microsatellite stable colorectal cancer | ||
| Esophagus | 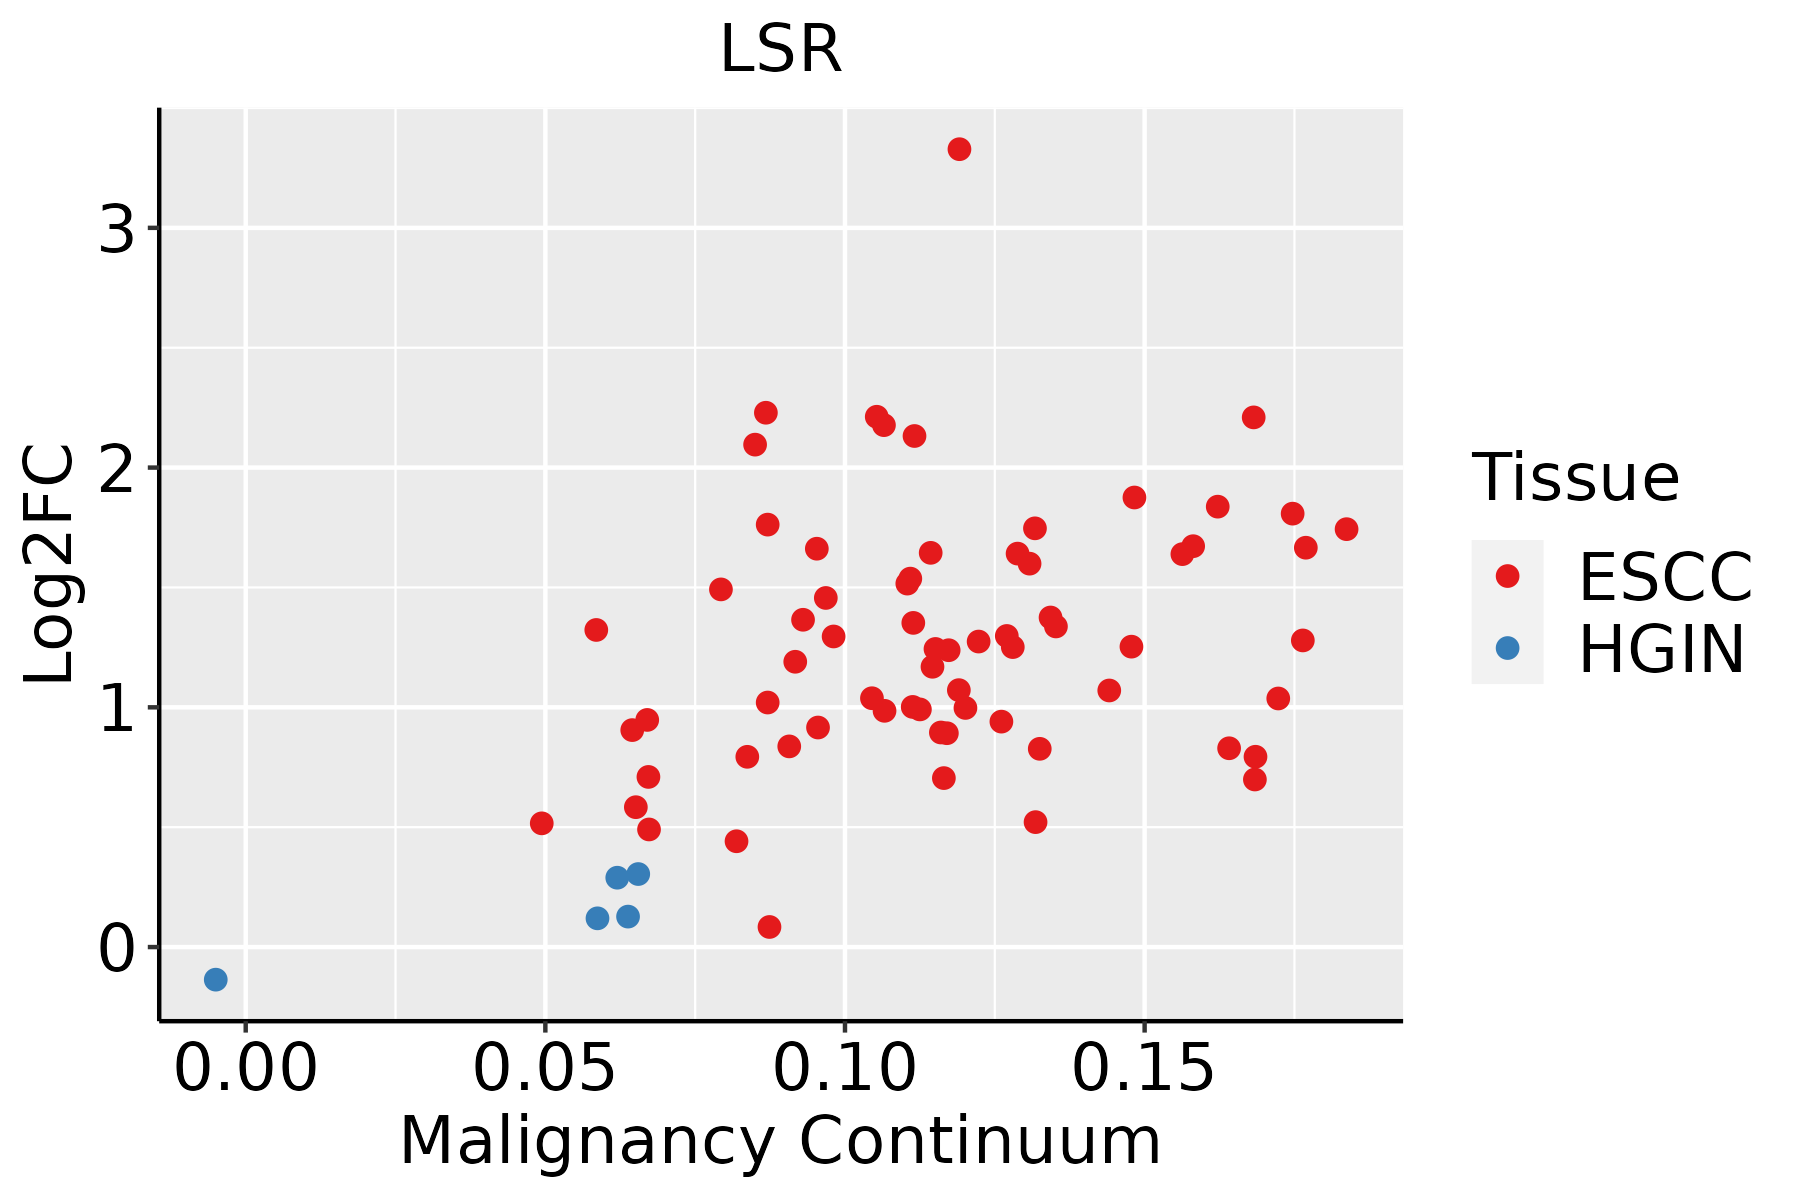 | ESCC: Esophageal squamous cell carcinoma |
| HGIN: High-grade intraepithelial neoplasias | ||
| LGIN: Low-grade intraepithelial neoplasias | ||
| Liver | 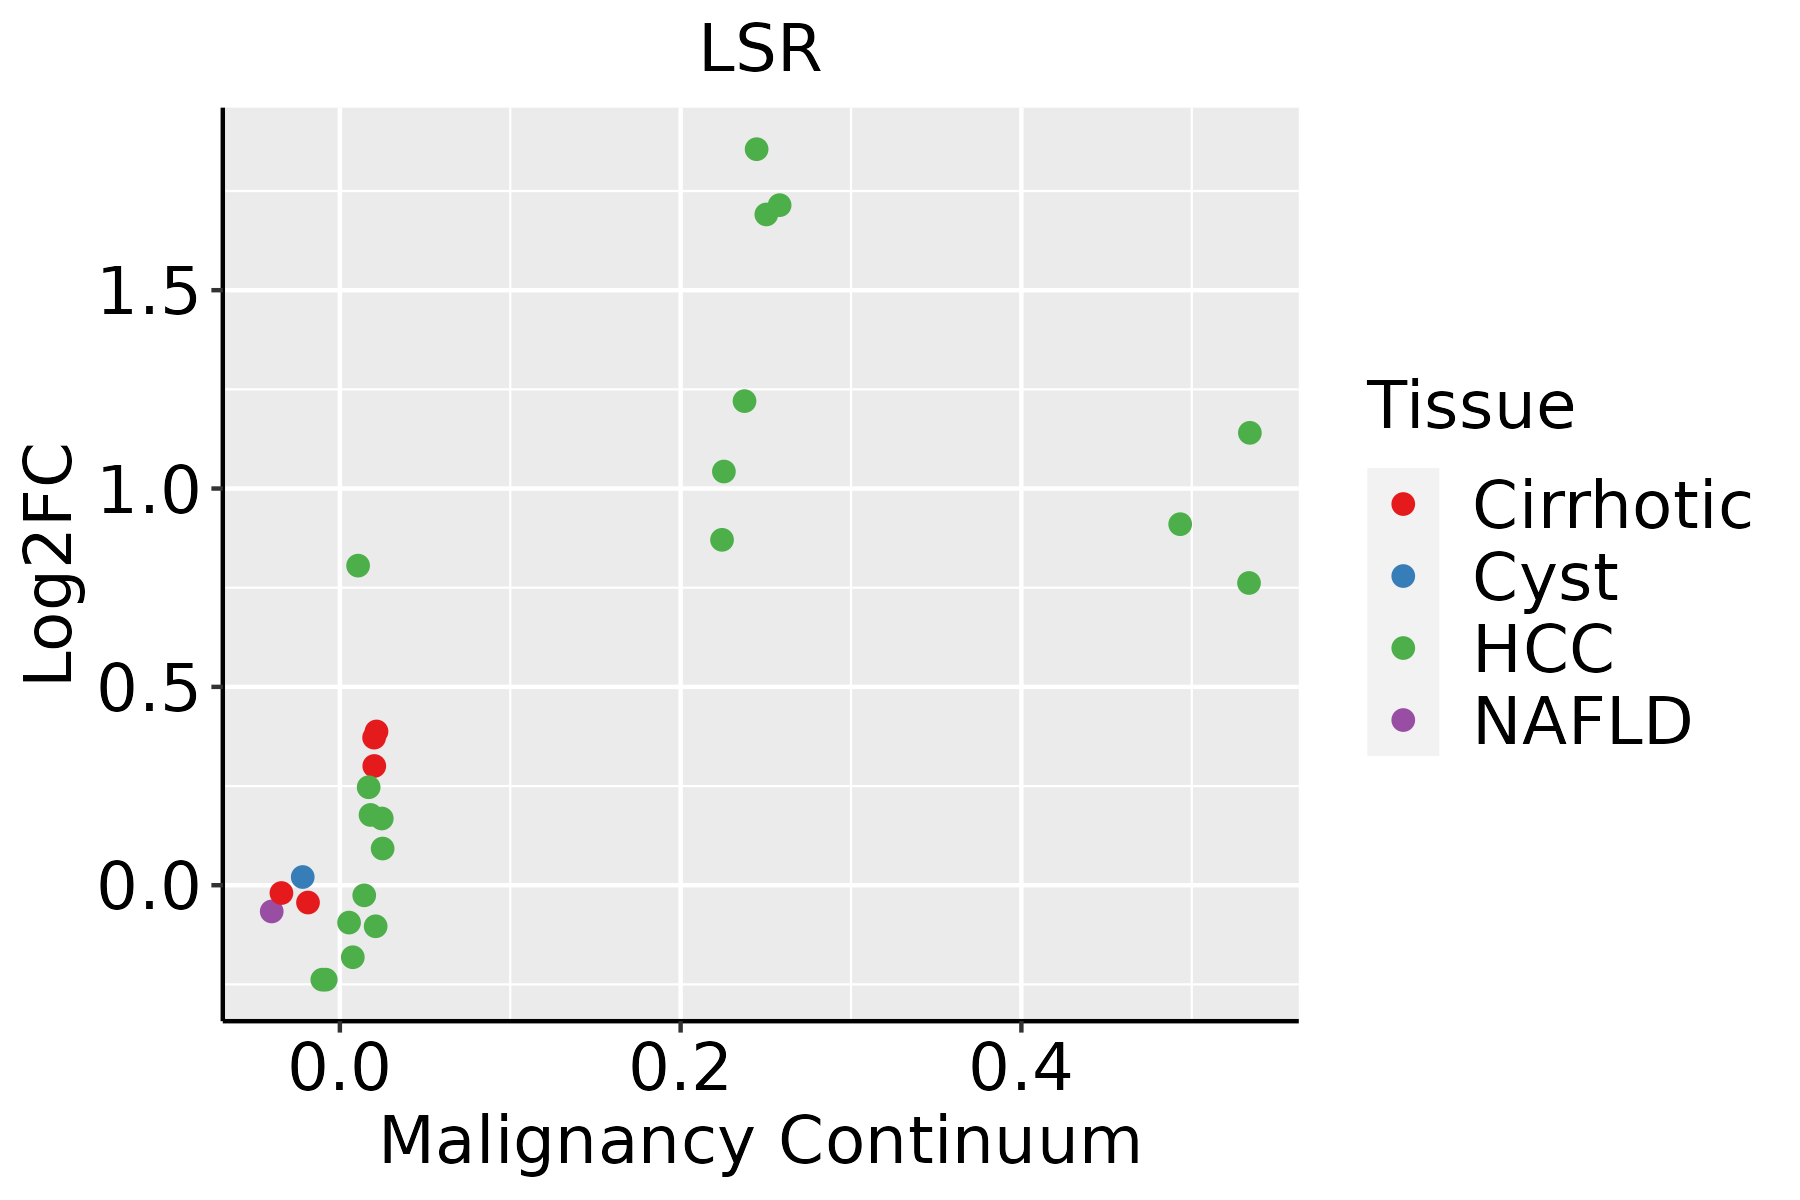 | HCC: Hepatocellular carcinoma |
| NAFLD: Non-alcoholic fatty liver disease | ||
| Oral Cavity |  | EOLP: Erosive Oral lichen planus |
| LP: leukoplakia | ||
| NEOLP: Non-erosive oral lichen planus | ||
| OSCC: Oral squamous cell carcinoma | ||
| Prostate | 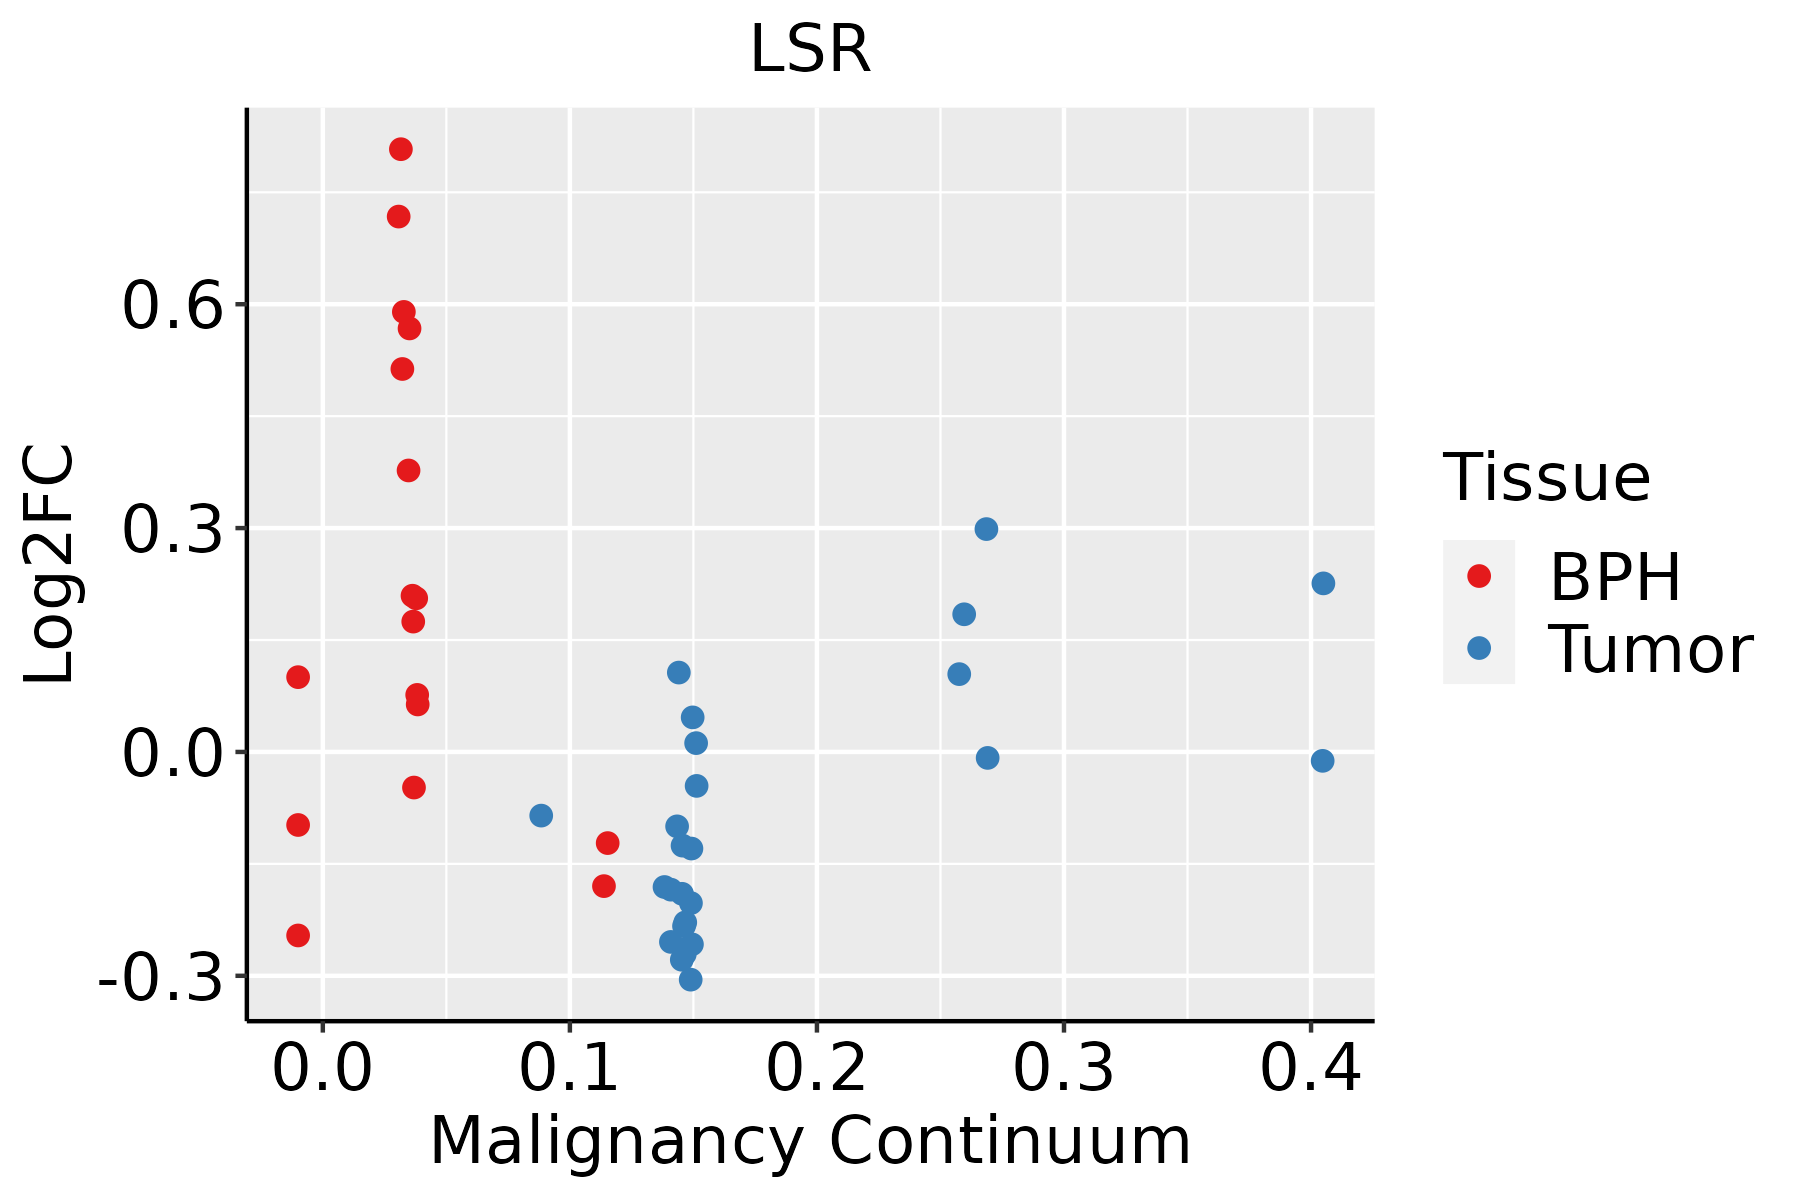 | BPH: Benign Prostatic Hyperplasia |
| Skin | 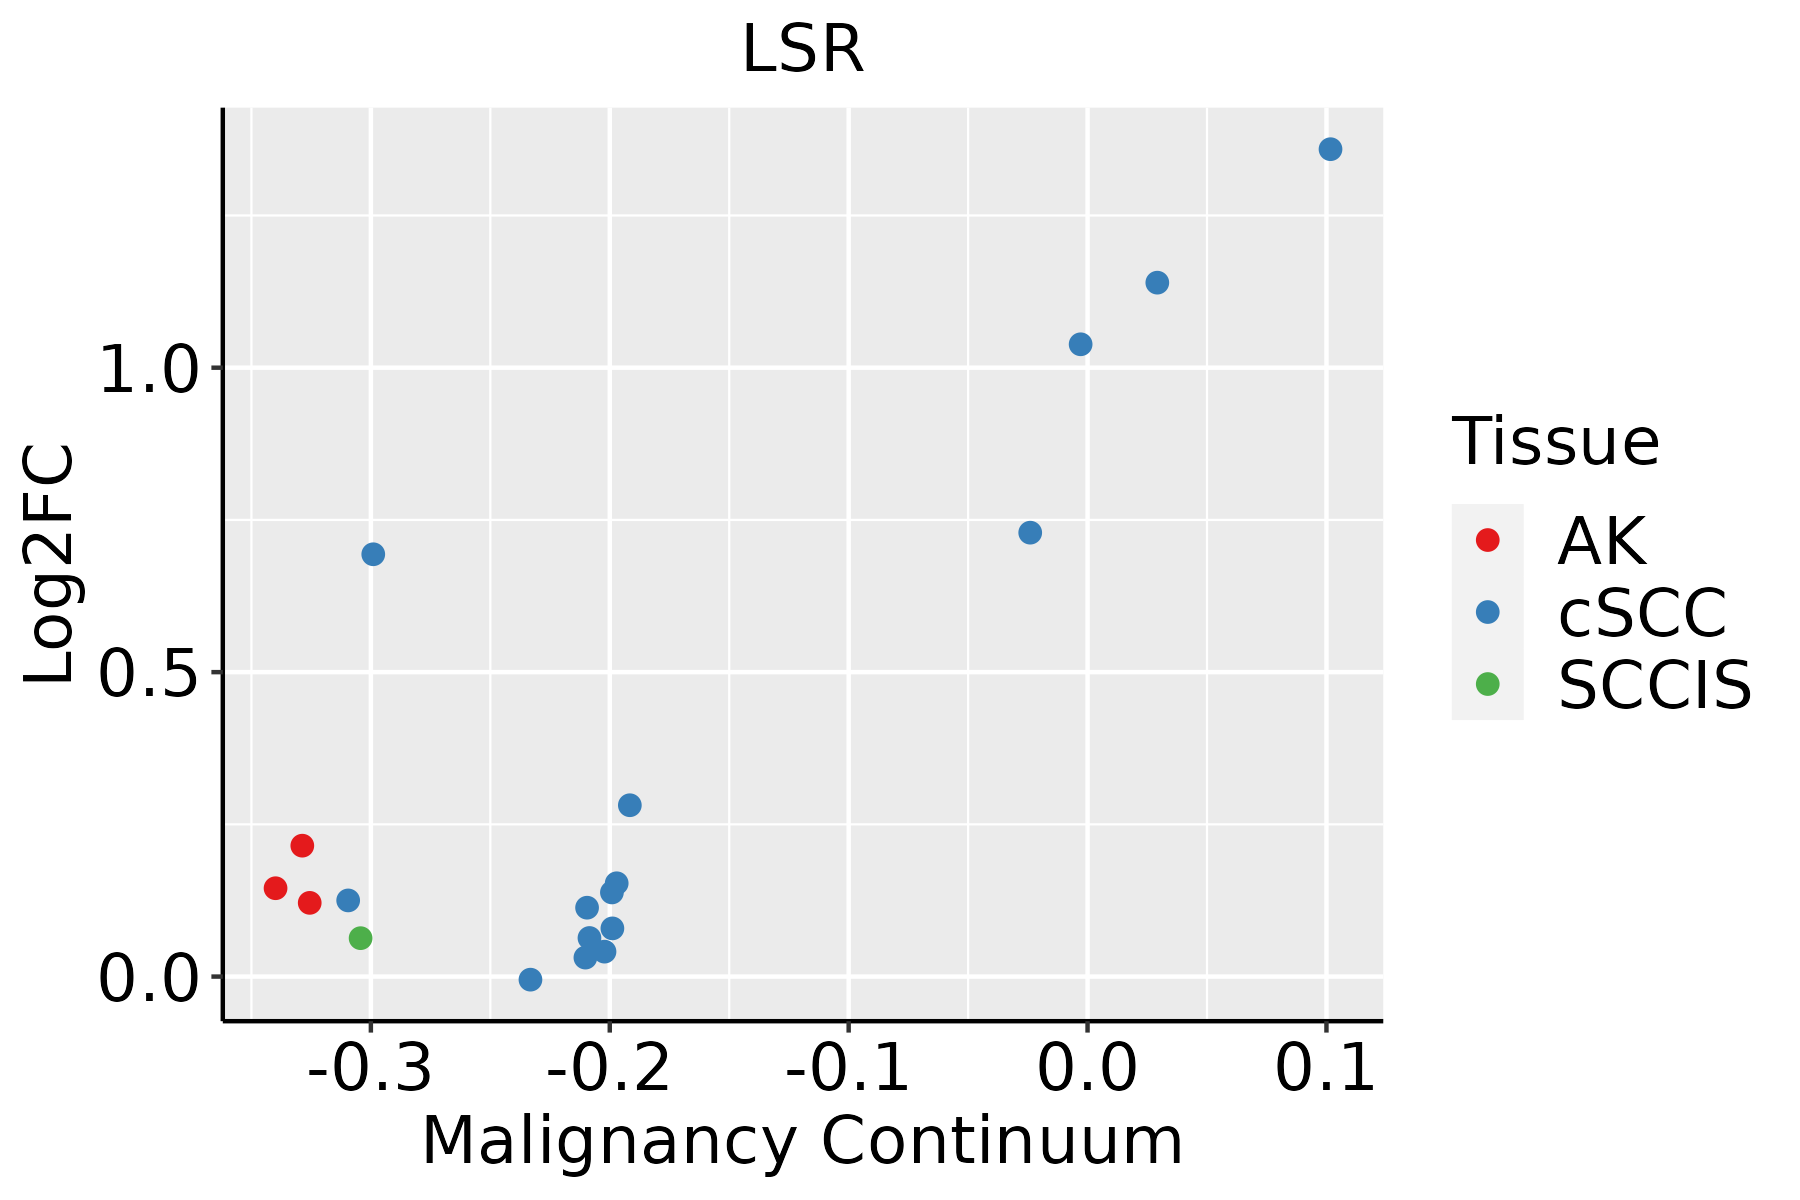 | AK: Actinic keratosis |
| cSCC: Cutaneous squamous cell carcinoma | ||
| SCCIS:squamous cell carcinoma in situ | ||
| Thyroid |  | ATC: Anaplastic thyroid cancer |
| HT: Hashimoto's thyroiditis | ||
| PTC: Papillary thyroid cancer |
| ∗log2FC in expression of this searched gene in stem-like cells from each diseased tissue sample relative to stem-like cells in normal samples in each tissue plotted against the malignancy continuum. Samples are colored based on if they are from different disease stage. |
Top |
Malignant transformation related pathway analysis |
| Find out the enriched GO biological processes and KEGG pathways involved in transition from healthy to precancer to cancer |
| Tissue | Disease Stage | Enriched GO biological Processes |
| Colorectum | AD |  |
| Colorectum | SER |  |
| Colorectum | MSS |  |
| Colorectum | MSI-H |  |
| Colorectum | FAP |  |
| ∗Top 15 enriched GO BP terms are showed in the bar plot of each disease state in each tissue. Each row represents a significant GO biological process which is colored according to the -log10(p.adjust). |
| Page: 1 2 3 4 5 6 7 8 9 |
| GO ID | Tissue | Disease Stage | Description | Gene Ratio | Bg Ratio | pvalue | p.adjust | Count |
| GO:000189413 | Breast | IDC | tissue homeostasis | 34/1434 | 268/18723 | 2.54e-03 | 2.28e-02 | 34 |
| GO:0048754 | Breast | IDC | branching morphogenesis of an epithelial tube | 22/1434 | 151/18723 | 2.61e-03 | 2.34e-02 | 22 |
| GO:00435883 | Breast | IDC | skin development | 33/1434 | 263/18723 | 3.46e-03 | 2.87e-02 | 33 |
| GO:01501055 | Breast | IDC | protein localization to cell-cell junction | 6/1434 | 21/18723 | 3.98e-03 | 3.23e-02 | 6 |
| GO:003563313 | Breast | IDC | maintenance of blood-brain barrier | 8/1434 | 35/18723 | 4.22e-03 | 3.31e-02 | 8 |
| GO:0060441 | Breast | IDC | epithelial tube branching involved in lung morphogenesis | 7/1434 | 29/18723 | 5.31e-03 | 3.94e-02 | 7 |
| GO:00721756 | Breast | IDC | epithelial tube formation | 19/1434 | 132/18723 | 5.63e-03 | 4.08e-02 | 19 |
| GO:004873223 | Breast | DCIS | gland development | 60/1390 | 436/18723 | 2.50e-06 | 8.74e-05 | 60 |
| GO:003297024 | Breast | DCIS | regulation of actin filament-based process | 56/1390 | 397/18723 | 2.50e-06 | 8.74e-05 | 56 |
| GO:003295624 | Breast | DCIS | regulation of actin cytoskeleton organization | 48/1390 | 358/18723 | 4.82e-05 | 9.92e-04 | 48 |
| GO:005087823 | Breast | DCIS | regulation of body fluid levels | 50/1390 | 379/18723 | 5.17e-05 | 1.06e-03 | 50 |
| GO:003032413 | Breast | DCIS | lung development | 27/1390 | 177/18723 | 2.73e-04 | 4.09e-03 | 27 |
| GO:003032313 | Breast | DCIS | respiratory tube development | 27/1390 | 181/18723 | 3.93e-04 | 5.41e-03 | 27 |
| GO:000188923 | Breast | DCIS | liver development | 23/1390 | 147/18723 | 5.21e-04 | 6.76e-03 | 23 |
| GO:006056221 | Breast | DCIS | epithelial tube morphogenesis | 41/1390 | 325/18723 | 5.98e-04 | 7.60e-03 | 41 |
| GO:006100823 | Breast | DCIS | hepaticobiliary system development | 23/1390 | 150/18723 | 6.96e-04 | 8.47e-03 | 23 |
| GO:006054111 | Breast | DCIS | respiratory system development | 28/1390 | 203/18723 | 1.10e-03 | 1.19e-02 | 28 |
| GO:006113811 | Breast | DCIS | morphogenesis of a branching epithelium | 25/1390 | 182/18723 | 2.08e-03 | 1.94e-02 | 25 |
| GO:000176312 | Breast | DCIS | morphogenesis of a branching structure | 26/1390 | 196/18723 | 2.81e-03 | 2.43e-02 | 26 |
| GO:000189423 | Breast | DCIS | tissue homeostasis | 33/1390 | 268/18723 | 2.88e-03 | 2.48e-02 | 33 |
| Page: 1 2 3 4 5 6 7 8 9 10 11 12 13 14 15 16 17 18 19 20 21 22 23 24 25 |
| Pathway ID | Tissue | Disease Stage | Description | Gene Ratio | Bg Ratio | pvalue | p.adjust | qvalue | Count |
| Page: 1 |
Top |
Cell-cell communication analysis |
| Identification of potential cell-cell interactions between two cell types and their ligand-receptor pairs for different disease states |
| Ligand | Receptor | LRpair | Pathway | Tissue | Disease Stage |
| Page: 1 |
Top |
Single-cell gene regulatory network inference analysis |
| Find out the significant the regulons (TFs) and the target genes of each regulon across cell types for different disease states |
| TF | Cell Type | Tissue | Disease Stage | Target Gene | RSS | Regulon Activity |
| ∗The dot plots of a searched regulon are shown for all cell subpopulations in each disease state of each tissue based on the regulon specific score inferred using pySCENIC and by calculating the average expression. |
| Page: 1 |
Top |
Somatic mutation of malignant transformation related genes |
| Annotation of somatic variants for genes involved in malignant transformation |
| Hugo Symbol | Variant Class | Variant Classification | dbSNP RS | HGVSc | HGVSp | HGVSp Short | SWISSPROT | BIOTYPE | SIFT | PolyPhen | Tumor Sample Barcode | Tissue | Histology | Sex | Age | Stage | Therapy Types | Drugs | Outcome |
| LSR | SNV | Missense_Mutation | rs748784670 | c.686N>G | p.Asn229Ser | p.N229S | Q86X29 | protein_coding | deleterious(0.01) | possibly_damaging(0.833) | TCGA-A1-A0SK-01 | Breast | breast invasive carcinoma | Female | <65 | I/II | Unknown | Unknown | PD |
| LSR | SNV | Missense_Mutation | c.1340N>T | p.Ser447Phe | p.S447F | Q86X29 | protein_coding | tolerated(0.73) | benign(0.006) | TCGA-A8-A06X-01 | Breast | breast invasive carcinoma | Female | >=65 | I/II | Unknown | Unknown | SD | |
| LSR | SNV | Missense_Mutation | c.1636N>G | p.Ser546Ala | p.S546A | Q86X29 | protein_coding | tolerated(0.15) | benign(0.005) | TCGA-AN-A0FL-01 | Breast | breast invasive carcinoma | Female | <65 | I/II | Unknown | Unknown | SD | |
| LSR | SNV | Missense_Mutation | c.1393N>G | p.Pro465Ala | p.P465A | Q86X29 | protein_coding | tolerated(0.28) | benign(0.027) | TCGA-AR-A256-01 | Breast | breast invasive carcinoma | Female | <65 | I/II | Chemotherapy | doxorubicin | PD | |
| LSR | SNV | Missense_Mutation | c.1631N>G | p.Pro544Arg | p.P544R | Q86X29 | protein_coding | tolerated(0.07) | benign(0.221) | TCGA-D8-A147-01 | Breast | breast invasive carcinoma | Female | <65 | I/II | Chemotherapy | doxorubicine | SD | |
| LSR | SNV | Missense_Mutation | c.424N>T | p.Pro142Ser | p.P142S | Q86X29 | protein_coding | tolerated(0.09) | benign(0.082) | TCGA-E2-A1LB-01 | Breast | breast invasive carcinoma | Female | <65 | I/II | Chemotherapy | cytoxan | SD | |
| LSR | SNV | Missense_Mutation | rs775741599 | c.712G>A | p.Val238Ile | p.V238I | Q86X29 | protein_coding | deleterious(0) | probably_damaging(0.937) | TCGA-E2-A574-01 | Breast | breast invasive carcinoma | Female | <65 | I/II | Chemotherapy | adriamycin | SD |
| LSR | deletion | Frame_Shift_Del | novel | c.629delN | p.Asp212ThrfsTer46 | p.D212Tfs*46 | Q86X29 | protein_coding | TCGA-EW-A2FV-01 | Breast | breast invasive carcinoma | Female | <65 | III/IV | Chemotherapy | docetaxel | SD | ||
| LSR | SNV | Missense_Mutation | rs755436260 | c.1000G>A | p.Ala334Thr | p.A334T | Q86X29 | protein_coding | tolerated(0.28) | benign(0.011) | TCGA-AA-3947-01 | Colorectum | colon adenocarcinoma | Female | <65 | I/II | Unknown | Unknown | SD |
| LSR | SNV | Missense_Mutation | rs372794690 | c.1246N>A | p.Asp416Asn | p.D416N | Q86X29 | protein_coding | deleterious(0.03) | probably_damaging(0.997) | TCGA-AZ-6601-01 | Colorectum | colon adenocarcinoma | Male | >=65 | I/II | Unknown | Unknown | PD |
| Page: 1 2 3 4 5 6 7 8 |
Top |
Related drugs of malignant transformation related genes |
| Identification of chemicals and drugs interact with genes involved in malignant transfromation |
| (DGIdb 4.0) |
| Entrez ID | Symbol | Category | Interaction Types | Drug Claim Name | Drug Name | PMIDs |
| Page: 1 |

Copyright 2023-Present -The University of Texas Health Science Center at Houston |