
|
|||||
|
 | |
| |
| |
| |
| |
| |
|
Gene: LSG1 |
Gene summary for LSG1 |
| Gene information | Species | Human | Gene symbol | LSG1 | Gene ID | 55341 |
| Gene name | large 60S subunit nuclear export GTPase 1 | |
| Gene Alias | LSG1 | |
| Cytomap | 3q29 | |
| Gene Type | protein-coding | GO ID | GO:0000054 | UniProtAcc | Q9H089 |
Top |
Malignant transformation analysis |
| Identification of the aberrant gene expression in precancerous and cancerous lesions by comparing the gene expression of stem-like cells in diseased tissues with normal stem cells |
| Entrez ID | Symbol | Replicates | Species | Organ | Tissue | Adj P-value | Log2FC | Malignancy |
| 55341 | LSG1 | LZE2D | Human | Esophagus | HGIN | 4.57e-03 | 3.72e-01 | 0.0642 |
| 55341 | LSG1 | LZE2T | Human | Esophagus | ESCC | 4.28e-11 | 8.86e-01 | 0.082 |
| 55341 | LSG1 | LZE4T | Human | Esophagus | ESCC | 6.38e-20 | 5.60e-01 | 0.0811 |
| 55341 | LSG1 | LZE5T | Human | Esophagus | ESCC | 4.11e-06 | 6.44e-01 | 0.0514 |
| 55341 | LSG1 | LZE7T | Human | Esophagus | ESCC | 1.45e-15 | 1.12e+00 | 0.0667 |
| 55341 | LSG1 | LZE20T | Human | Esophagus | ESCC | 2.67e-03 | 1.98e-01 | 0.0662 |
| 55341 | LSG1 | LZE21D1 | Human | Esophagus | HGIN | 1.48e-02 | 6.64e-01 | 0.0632 |
| 55341 | LSG1 | LZE22T | Human | Esophagus | ESCC | 4.20e-02 | 4.25e-01 | 0.068 |
| 55341 | LSG1 | LZE24T | Human | Esophagus | ESCC | 3.59e-25 | 8.05e-01 | 0.0596 |
| 55341 | LSG1 | LZE21T | Human | Esophagus | ESCC | 1.16e-12 | 9.14e-01 | 0.0655 |
| 55341 | LSG1 | LZE6T | Human | Esophagus | ESCC | 8.45e-03 | 1.21e-01 | 0.0845 |
| 55341 | LSG1 | P2T-E | Human | Esophagus | ESCC | 1.55e-57 | 1.08e+00 | 0.1177 |
| 55341 | LSG1 | P4T-E | Human | Esophagus | ESCC | 6.44e-46 | 1.15e+00 | 0.1323 |
| 55341 | LSG1 | P5T-E | Human | Esophagus | ESCC | 1.01e-22 | 5.40e-01 | 0.1327 |
| 55341 | LSG1 | P8T-E | Human | Esophagus | ESCC | 2.26e-25 | 4.90e-01 | 0.0889 |
| 55341 | LSG1 | P9T-E | Human | Esophagus | ESCC | 4.38e-27 | 7.24e-01 | 0.1131 |
| 55341 | LSG1 | P10T-E | Human | Esophagus | ESCC | 6.02e-47 | 9.61e-01 | 0.116 |
| 55341 | LSG1 | P11T-E | Human | Esophagus | ESCC | 2.61e-10 | 6.54e-01 | 0.1426 |
| 55341 | LSG1 | P12T-E | Human | Esophagus | ESCC | 2.37e-44 | 1.06e+00 | 0.1122 |
| 55341 | LSG1 | P15T-E | Human | Esophagus | ESCC | 3.68e-37 | 9.05e-01 | 0.1149 |
| Page: 1 2 3 4 5 |
| Tissue | Expression Dynamics | Abbreviation |
| Esophagus | 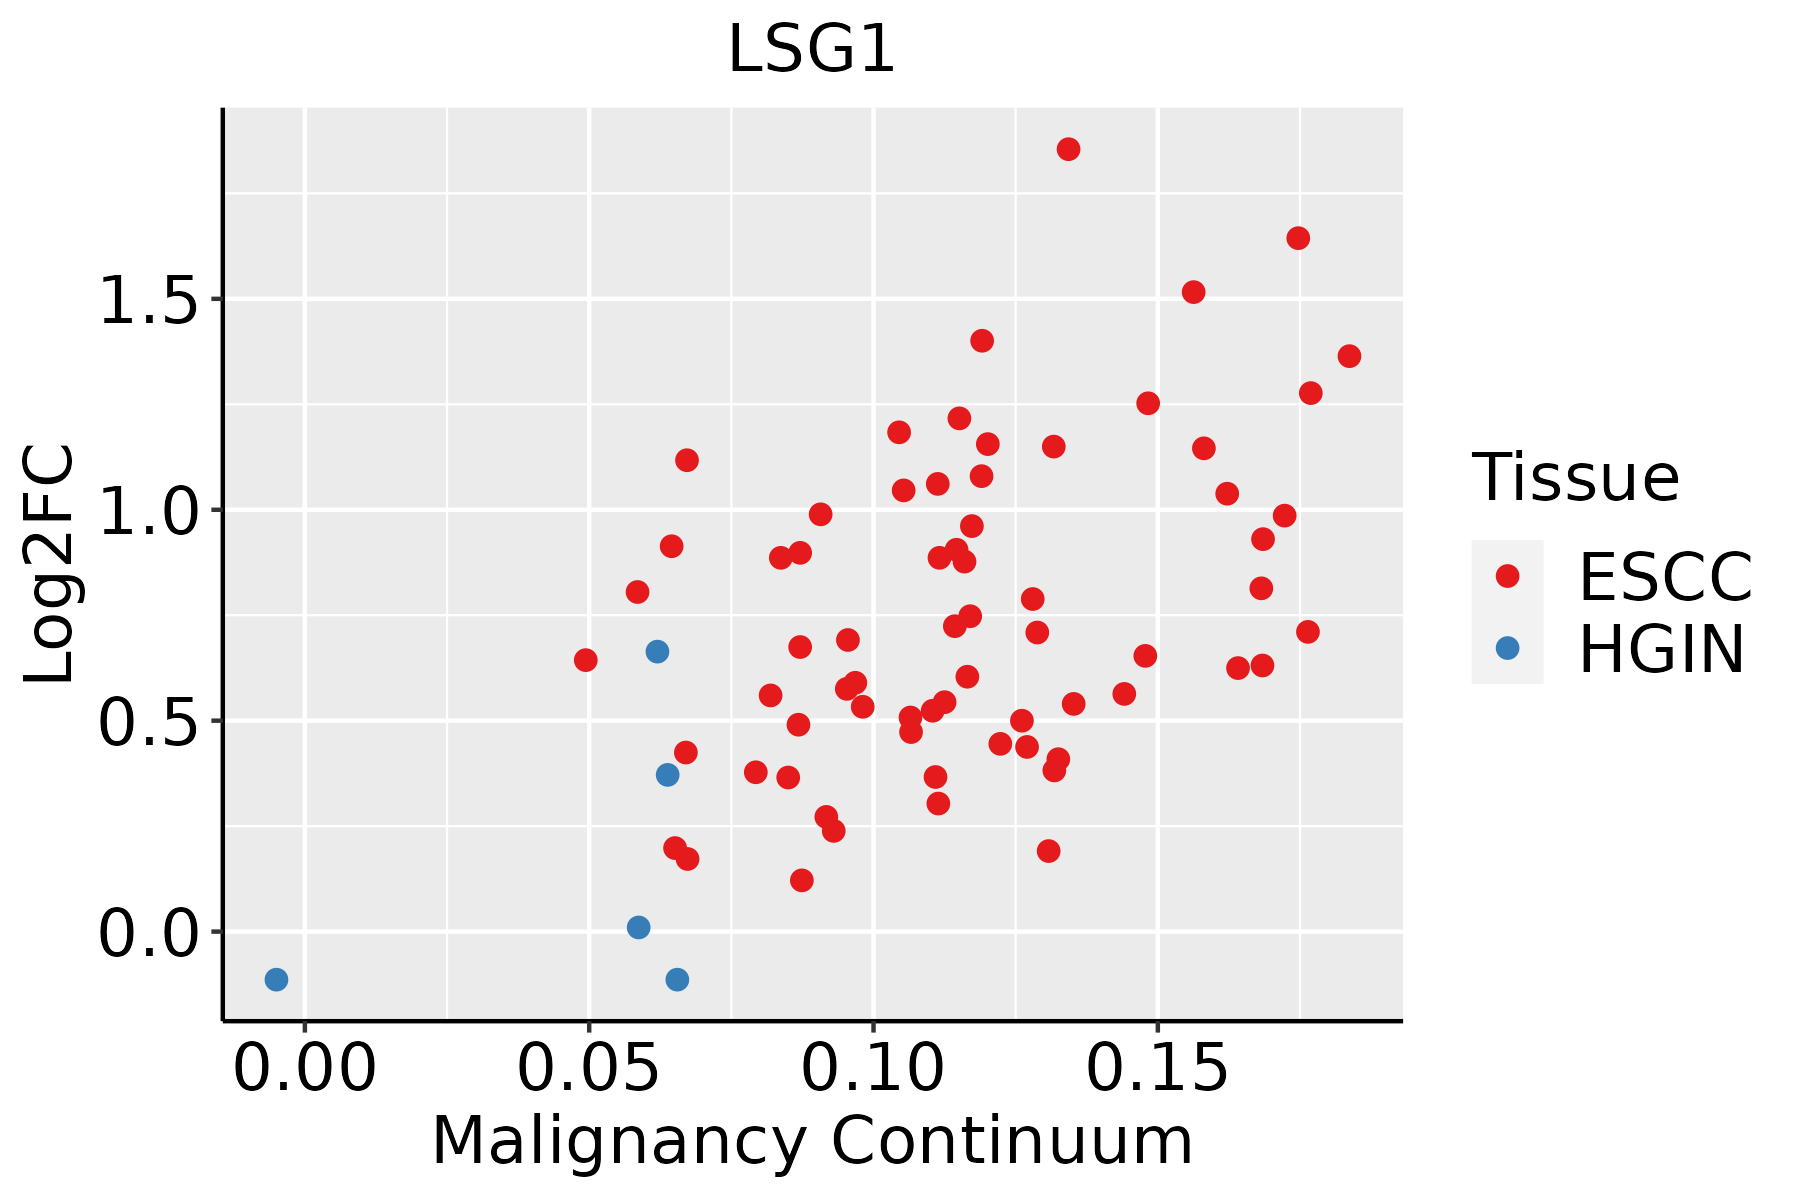 | ESCC: Esophageal squamous cell carcinoma |
| HGIN: High-grade intraepithelial neoplasias | ||
| LGIN: Low-grade intraepithelial neoplasias | ||
| Liver | 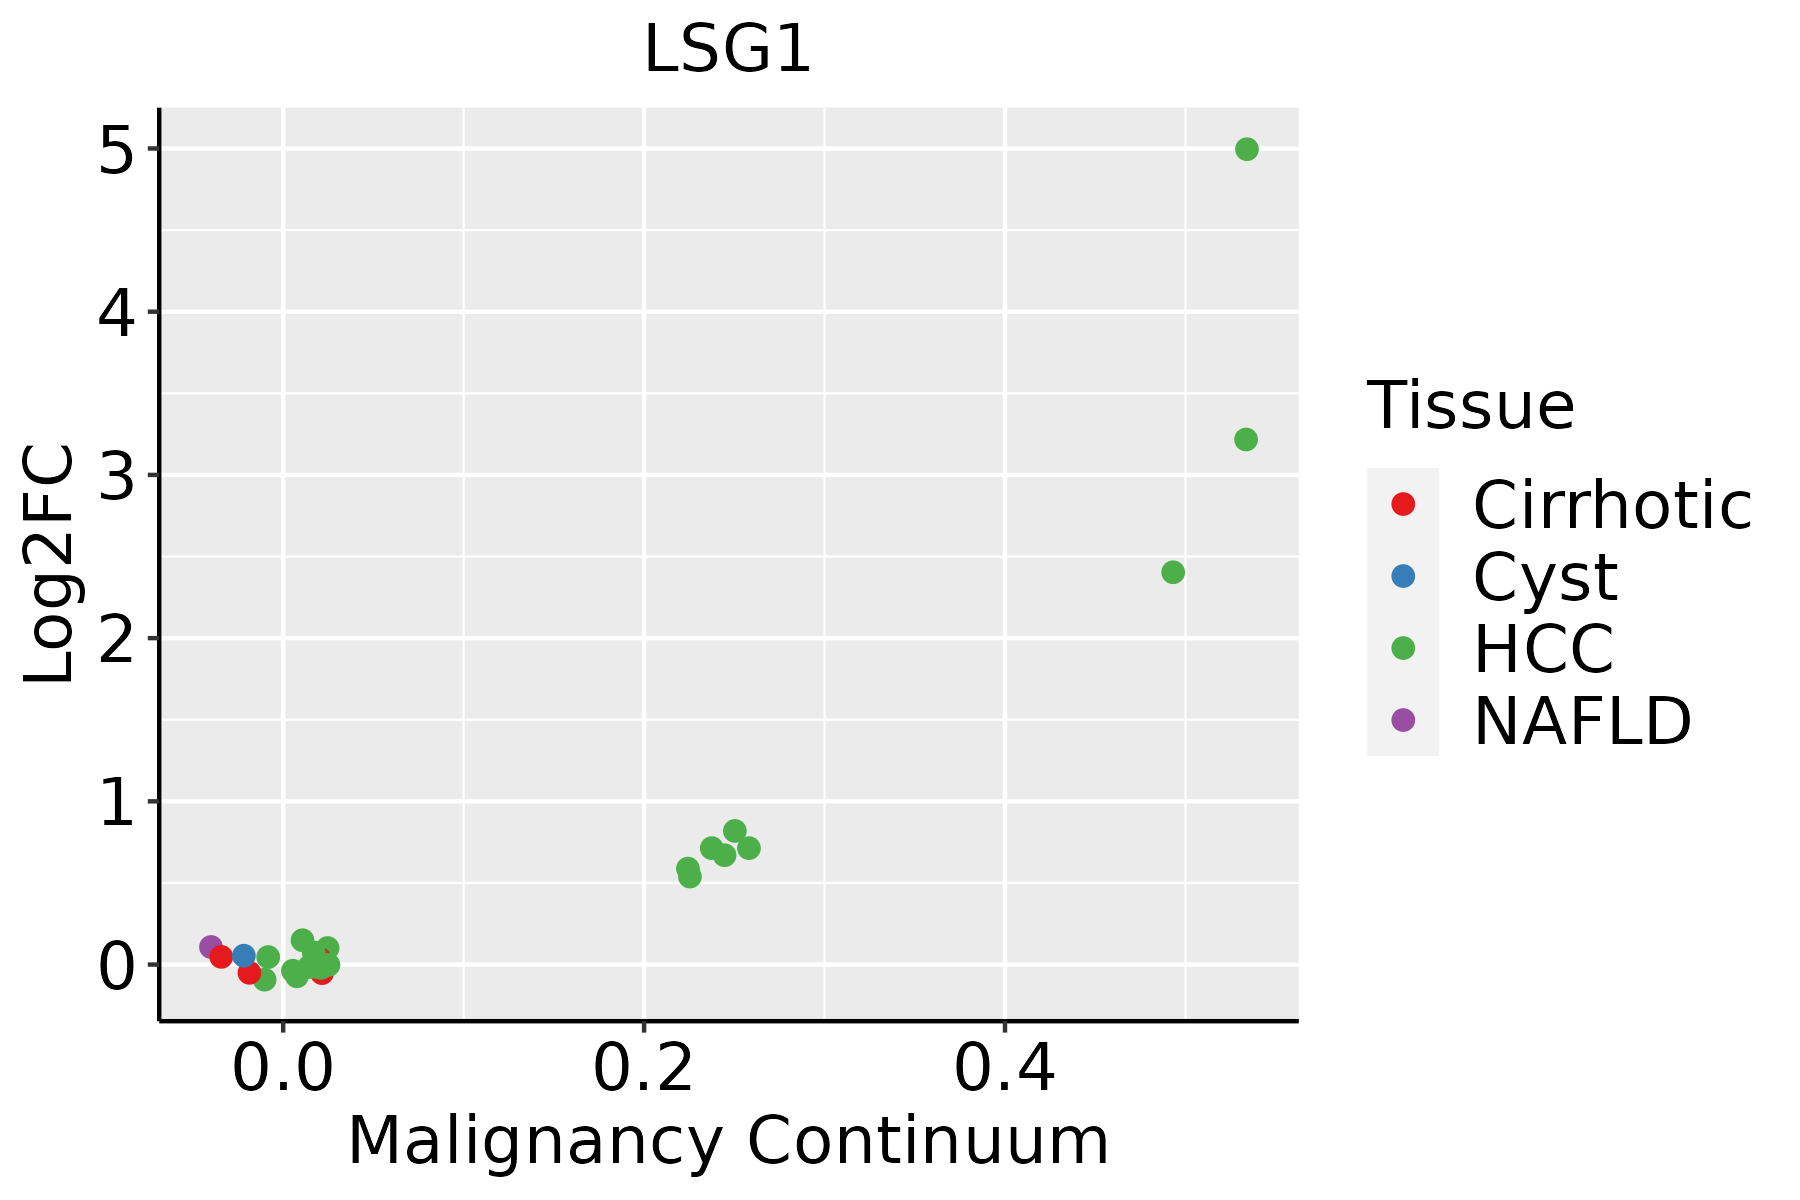 | HCC: Hepatocellular carcinoma |
| NAFLD: Non-alcoholic fatty liver disease | ||
| Oral Cavity |  | EOLP: Erosive Oral lichen planus |
| LP: leukoplakia | ||
| NEOLP: Non-erosive oral lichen planus | ||
| OSCC: Oral squamous cell carcinoma | ||
| Skin | 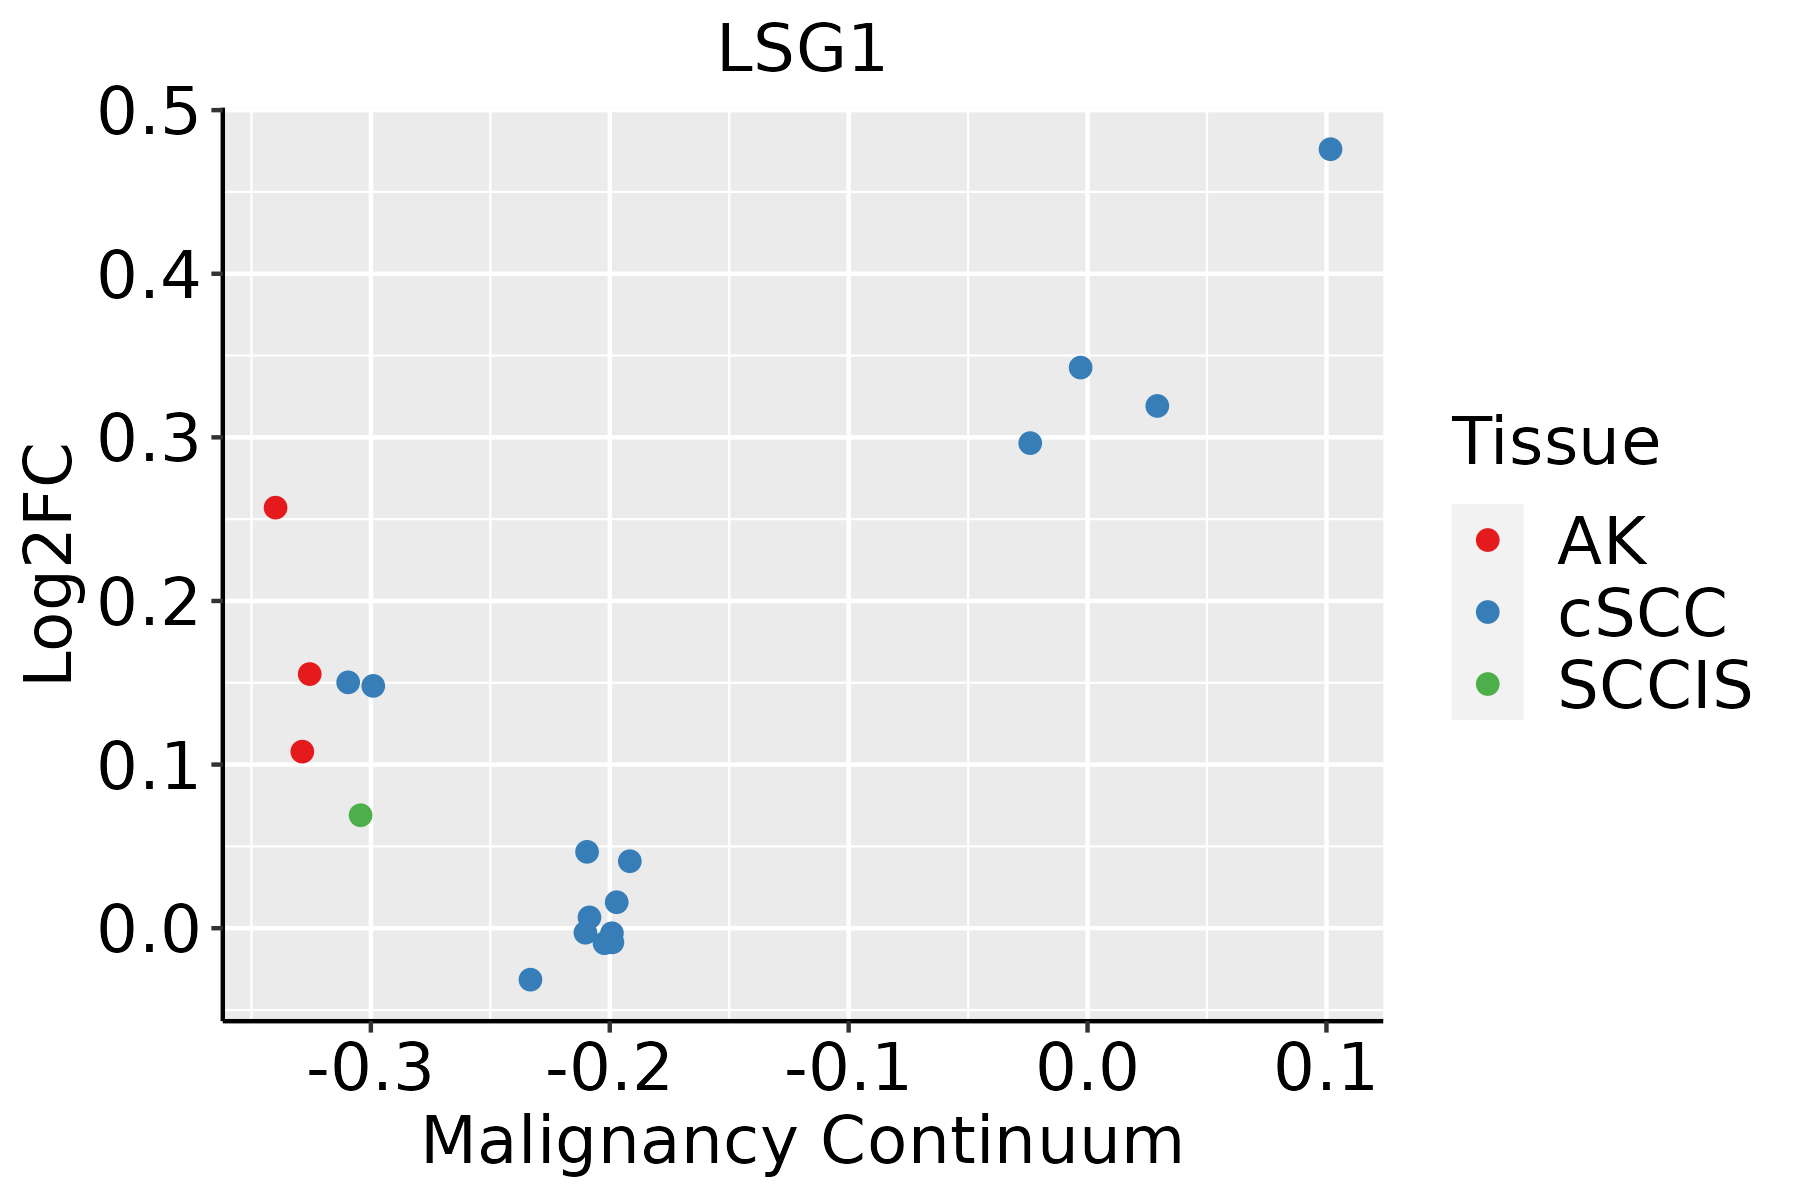 | AK: Actinic keratosis |
| cSCC: Cutaneous squamous cell carcinoma | ||
| SCCIS:squamous cell carcinoma in situ |
| ∗log2FC in expression of this searched gene in stem-like cells from each diseased tissue sample relative to stem-like cells in normal samples in each tissue plotted against the malignancy continuum. Samples are colored based on if they are from different disease stage. |
Top |
Malignant transformation related pathway analysis |
| Find out the enriched GO biological processes and KEGG pathways involved in transition from healthy to precancer to cancer |
| Tissue | Disease Stage | Enriched GO biological Processes |
| Colorectum | AD |  |
| Colorectum | SER |  |
| Colorectum | MSS |  |
| Colorectum | MSI-H |  |
| Colorectum | FAP |  |
| ∗Top 15 enriched GO BP terms are showed in the bar plot of each disease state in each tissue. Each row represents a significant GO biological process which is colored according to the -log10(p.adjust). |
| Page: 1 2 3 4 5 6 7 8 9 |
| GO ID | Tissue | Disease Stage | Description | Gene Ratio | Bg Ratio | pvalue | p.adjust | Count |
| GO:003150314 | Esophagus | ESCC | protein-containing complex localization | 139/8552 | 220/18723 | 1.14e-07 | 1.85e-06 | 139 |
| GO:000005411 | Esophagus | ESCC | ribosomal subunit export from nucleus | 13/8552 | 14/18723 | 3.02e-04 | 1.81e-03 | 13 |
| GO:003375011 | Esophagus | ESCC | ribosome localization | 13/8552 | 14/18723 | 3.02e-04 | 1.81e-03 | 13 |
| GO:007142811 | Esophagus | ESCC | rRNA-containing ribonucleoprotein complex export from nucleus | 13/8552 | 15/18723 | 1.31e-03 | 6.26e-03 | 13 |
| GO:002261322 | Liver | HCC | ribonucleoprotein complex biogenesis | 355/7958 | 463/18723 | 7.76e-52 | 4.92e-48 | 355 |
| GO:004225422 | Liver | HCC | ribosome biogenesis | 246/7958 | 299/18723 | 4.99e-46 | 1.58e-42 | 246 |
| GO:000691322 | Liver | HCC | nucleocytoplasmic transport | 208/7958 | 301/18723 | 5.51e-21 | 8.12e-19 | 208 |
| GO:005116922 | Liver | HCC | nuclear transport | 208/7958 | 301/18723 | 5.51e-21 | 8.12e-19 | 208 |
| GO:005116822 | Liver | HCC | nuclear export | 113/7958 | 154/18723 | 6.30e-15 | 4.39e-13 | 113 |
| GO:005165621 | Liver | HCC | establishment of organelle localization | 226/7958 | 390/18723 | 4.15e-10 | 1.34e-08 | 226 |
| GO:00711661 | Liver | HCC | ribonucleoprotein complex localization | 59/7958 | 77/18723 | 1.09e-09 | 3.30e-08 | 59 |
| GO:00714261 | Liver | HCC | ribonucleoprotein complex export from nucleus | 58/7958 | 76/18723 | 1.98e-09 | 5.63e-08 | 58 |
| GO:00315031 | Liver | HCC | protein-containing complex localization | 129/7958 | 220/18723 | 9.38e-07 | 1.42e-05 | 129 |
| GO:00000544 | Liver | HCC | ribosomal subunit export from nucleus | 12/7958 | 14/18723 | 1.17e-03 | 6.54e-03 | 12 |
| GO:00337504 | Liver | HCC | ribosome localization | 12/7958 | 14/18723 | 1.17e-03 | 6.54e-03 | 12 |
| GO:00714282 | Liver | HCC | rRNA-containing ribonucleoprotein complex export from nucleus | 12/7958 | 15/18723 | 3.56e-03 | 1.59e-02 | 12 |
| GO:002261320 | Oral cavity | OSCC | ribonucleoprotein complex biogenesis | 333/7305 | 463/18723 | 8.28e-48 | 5.24e-44 | 333 |
| GO:004225420 | Oral cavity | OSCC | ribosome biogenesis | 230/7305 | 299/18723 | 3.22e-41 | 6.80e-38 | 230 |
| GO:000691317 | Oral cavity | OSCC | nucleocytoplasmic transport | 204/7305 | 301/18723 | 2.65e-24 | 6.98e-22 | 204 |
| GO:005116917 | Oral cavity | OSCC | nuclear transport | 204/7305 | 301/18723 | 2.65e-24 | 6.98e-22 | 204 |
| Page: 1 2 3 4 |
| Pathway ID | Tissue | Disease Stage | Description | Gene Ratio | Bg Ratio | pvalue | p.adjust | qvalue | Count |
| Page: 1 |
Top |
Cell-cell communication analysis |
| Identification of potential cell-cell interactions between two cell types and their ligand-receptor pairs for different disease states |
| Ligand | Receptor | LRpair | Pathway | Tissue | Disease Stage |
| Page: 1 |
Top |
Single-cell gene regulatory network inference analysis |
| Find out the significant the regulons (TFs) and the target genes of each regulon across cell types for different disease states |
| TF | Cell Type | Tissue | Disease Stage | Target Gene | RSS | Regulon Activity |
| ∗The dot plots of a searched regulon are shown for all cell subpopulations in each disease state of each tissue based on the regulon specific score inferred using pySCENIC and by calculating the average expression. |
| Page: 1 |
Top |
Somatic mutation of malignant transformation related genes |
| Annotation of somatic variants for genes involved in malignant transformation |
| Hugo Symbol | Variant Class | Variant Classification | dbSNP RS | HGVSc | HGVSp | HGVSp Short | SWISSPROT | BIOTYPE | SIFT | PolyPhen | Tumor Sample Barcode | Tissue | Histology | Sex | Age | Stage | Therapy Types | Drugs | Outcome |
| LSG1 | SNV | Missense_Mutation | rs547942305 | c.476G>A | p.Arg159Gln | p.R159Q | Q9H089 | protein_coding | deleterious(0.01) | probably_damaging(0.923) | TCGA-5L-AAT1-01 | Breast | breast invasive carcinoma | Female | <65 | III/IV | Hormone Therapy | letrozol | SD |
| LSG1 | SNV | Missense_Mutation | c.1102N>C | p.Glu368Gln | p.E368Q | Q9H089 | protein_coding | tolerated(0.1) | possibly_damaging(0.562) | TCGA-AC-A23H-01 | Breast | breast invasive carcinoma | Female | >=65 | I/II | Unknown | Unknown | PD | |
| LSG1 | SNV | Missense_Mutation | c.1579N>A | p.Asp527Asn | p.D527N | Q9H089 | protein_coding | deleterious(0) | probably_damaging(1) | TCGA-AR-A1AO-01 | Breast | breast invasive carcinoma | Female | <65 | I/II | Chemotherapy | doxorubicin | SD | |
| LSG1 | SNV | Missense_Mutation | rs147988904 | c.665G>A | p.Arg222Gln | p.R222Q | Q9H089 | protein_coding | deleterious(0) | probably_damaging(0.999) | TCGA-B6-A0I6-01 | Breast | breast invasive carcinoma | Female | <65 | I/II | Unknown | Unknown | PD |
| LSG1 | insertion | Nonsense_Mutation | novel | c.262_263insTTGACTCCATTTGAACGAAATTTGGACTTTTGGC | p.Arg88IlefsTer5 | p.R88Ifs*5 | Q9H089 | protein_coding | TCGA-A2-A04Y-01 | Breast | breast invasive carcinoma | Female | <65 | I/II | Chemotherapy | cytoxan | SD | ||
| LSG1 | deletion | In_Frame_Del | c.456_458delNNN | p.Ile153del | p.I153del | Q9H089 | protein_coding | TCGA-AN-A0AK-01 | Breast | breast invasive carcinoma | Female | >=65 | I/II | Unknown | Unknown | SD | |||
| LSG1 | SNV | Missense_Mutation | novel | c.1691G>A | p.Arg564Gln | p.R564Q | Q9H089 | protein_coding | tolerated(0.34) | benign(0) | TCGA-2W-A8YY-01 | Cervix | cervical & endocervical cancer | Female | <65 | I/II | Chemotherapy | cisplatin | CR |
| LSG1 | SNV | Missense_Mutation | novel | c.1223G>A | p.Gly408Asp | p.G408D | Q9H089 | protein_coding | tolerated(0.6) | possibly_damaging(0.864) | TCGA-2W-A8YY-01 | Cervix | cervical & endocervical cancer | Female | <65 | I/II | Chemotherapy | cisplatin | CR |
| LSG1 | SNV | Missense_Mutation | novel | c.927C>A | p.Asp309Glu | p.D309E | Q9H089 | protein_coding | tolerated(0.21) | benign(0.025) | TCGA-2W-A8YY-01 | Cervix | cervical & endocervical cancer | Female | <65 | I/II | Chemotherapy | cisplatin | CR |
| LSG1 | SNV | Missense_Mutation | novel | c.1066N>A | p.Gln356Lys | p.Q356K | Q9H089 | protein_coding | tolerated(0.93) | benign(0.001) | TCGA-C5-A902-01 | Cervix | cervical & endocervical cancer | Female | <65 | I/II | Chemotherapy | cisplatin | SD |
| Page: 1 2 3 4 5 6 7 |
Top |
Related drugs of malignant transformation related genes |
| Identification of chemicals and drugs interact with genes involved in malignant transfromation |
| (DGIdb 4.0) |
| Entrez ID | Symbol | Category | Interaction Types | Drug Claim Name | Drug Name | PMIDs |
| Page: 1 |

Copyright 2023-Present -The University of Texas Health Science Center at Houston |