Schematic overview of the cellular and molecular mechanisms involved in the cancer progression, including the proposed cellular and molecular mechanisms in cancer cells trajectory. AT1: alveolar type 1 cells; AT2: alveolar type 2 cells; AAH: atypical adenomatous hyperplasia; AIS: adenocarcinoma in situ; MIA: minimally invasive adenocarcinoma; IA: invasive adenocarcinoma; EMT: epithelial-mesenchymal transition

Home

Download

Statistics

Help

Contact

Center for Computational Systems Medicine
leaf

Gene summary

leaf

Malignant transformation analysis

leaf

Malignant transformation related pathway analysis

leaf

Cell-cell communication analysis

leaf

Single-cell gene regulatory network inference analysis

leaf

Somatic mutation of malignant transformation related genes

leaf

Related drugs of malignant transformation related genes

Gene: LEO1

Gene summary for LEO1

check button Gene summary.

Gene informationSpeciesHuman
Gene symbol

LEO1

Gene ID

123169

Gene nameLEO1 homolog, Paf1/RNA polymerase II complex component
Gene AliasRDL
Cytomap15q21.2
Gene Typeprotein-coding
GO ID

GO:0001704

UniProtAcc

Q8WVC0


Top

Malignant transformation analysis

check button Identification of the aberrant gene expression in precancerous and cancerous lesions by comparing the gene expression of stem-like cells in diseased tissues with normal stem cells
check button Malignant transformation involving gene list.
Entrez IDSymbolReplicatesSpeciesOrganTissueAdj P-valueLog2FCMalignancy
123169LEO1LZE4THumanEsophagusESCC1.30e-143.79e-010.0811
123169LEO1LZE6THumanEsophagusESCC3.53e-031.40e-010.0845
123169LEO1P1T-EHumanEsophagusESCC3.43e-093.20e-010.0875
123169LEO1P2T-EHumanEsophagusESCC4.19e-151.75e-010.1177
123169LEO1P4T-EHumanEsophagusESCC4.07e-296.53e-010.1323
123169LEO1P5T-EHumanEsophagusESCC3.04e-214.34e-010.1327
123169LEO1P8T-EHumanEsophagusESCC1.55e-233.95e-010.0889
123169LEO1P9T-EHumanEsophagusESCC1.25e-112.85e-010.1131
123169LEO1P10T-EHumanEsophagusESCC3.21e-325.75e-010.116
123169LEO1P11T-EHumanEsophagusESCC2.97e-081.97e-010.1426
123169LEO1P12T-EHumanEsophagusESCC4.04e-183.82e-010.1122
123169LEO1P15T-EHumanEsophagusESCC7.49e-184.15e-010.1149
123169LEO1P16T-EHumanEsophagusESCC1.27e-173.13e-010.1153
123169LEO1P19T-EHumanEsophagusESCC4.08e-035.62e-010.1662
123169LEO1P20T-EHumanEsophagusESCC3.83e-111.56e-010.1124
123169LEO1P21T-EHumanEsophagusESCC2.40e-162.81e-010.1617
123169LEO1P22T-EHumanEsophagusESCC4.96e-282.10e-010.1236
123169LEO1P23T-EHumanEsophagusESCC6.02e-142.83e-010.108
123169LEO1P24T-EHumanEsophagusESCC1.82e-133.08e-010.1287
123169LEO1P26T-EHumanEsophagusESCC9.26e-184.18e-010.1276
Page: 1 2 3 4 5 

check button Transcriptomic changes along malignancy continuum.
TissueExpression DynamicsAbbreviation
EsophagusThe image shows the transcriptomic changes along malignancy continuum.log2FC in expression of this searched gene in stem-like cells from each diseased tissue sample relative to stem-like cells in normal samples in each tissue plotted against the malignancy continuum. Samples are colored based on if they are from different disease stage.
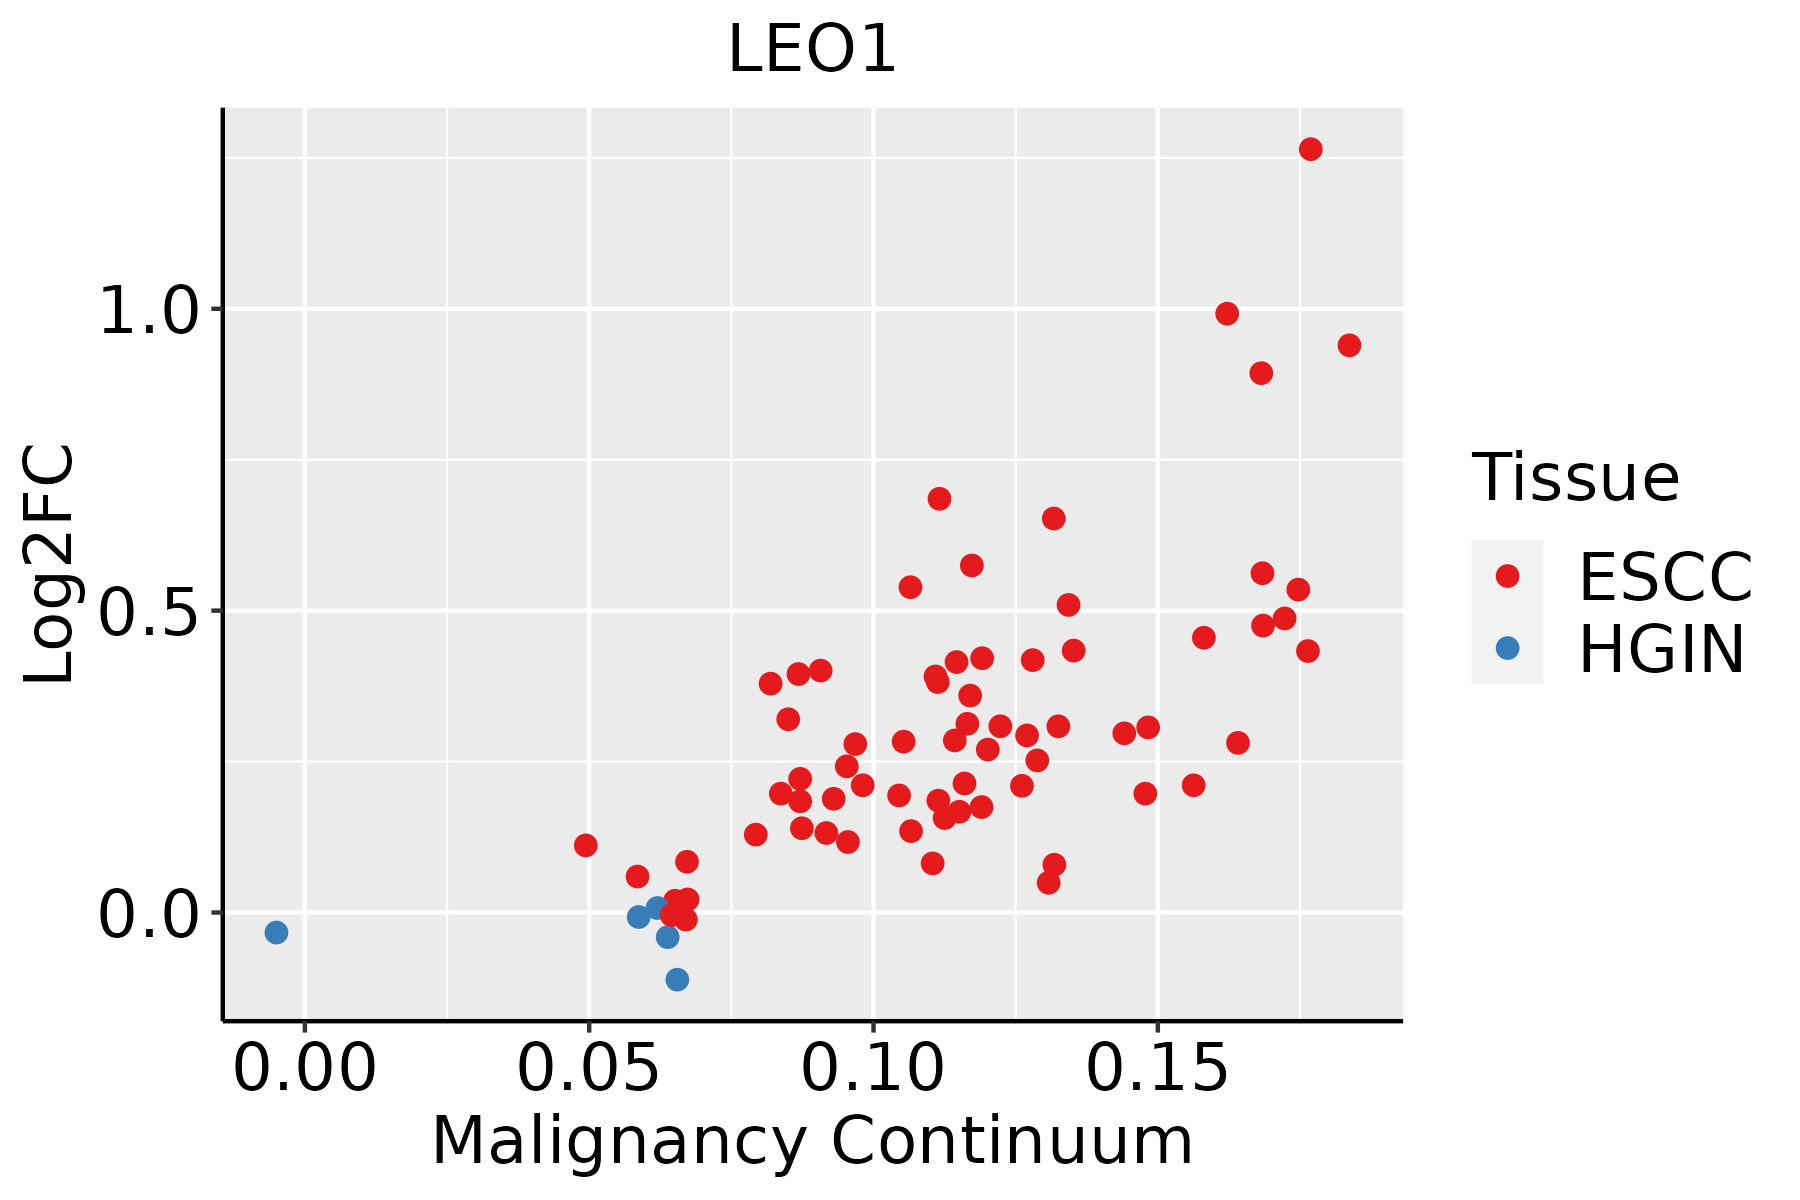
ESCC: Esophageal squamous cell carcinoma
HGIN: High-grade intraepithelial neoplasias
LGIN: Low-grade intraepithelial neoplasias
LiverThe image shows the transcriptomic changes along malignancy continuum.log2FC in expression of this searched gene in stem-like cells from each diseased tissue sample relative to stem-like cells in normal samples in each tissue plotted against the malignancy continuum. Samples are colored based on if they are from different disease stage.HCC: Hepatocellular carcinoma
NAFLD: Non-alcoholic fatty liver disease
Oral CavityThe image shows the transcriptomic changes along malignancy continuum.log2FC in expression of this searched gene in stem-like cells from each diseased tissue sample relative to stem-like cells in normal samples in each tissue plotted against the malignancy continuum. Samples are colored based on if they are from different disease stage.
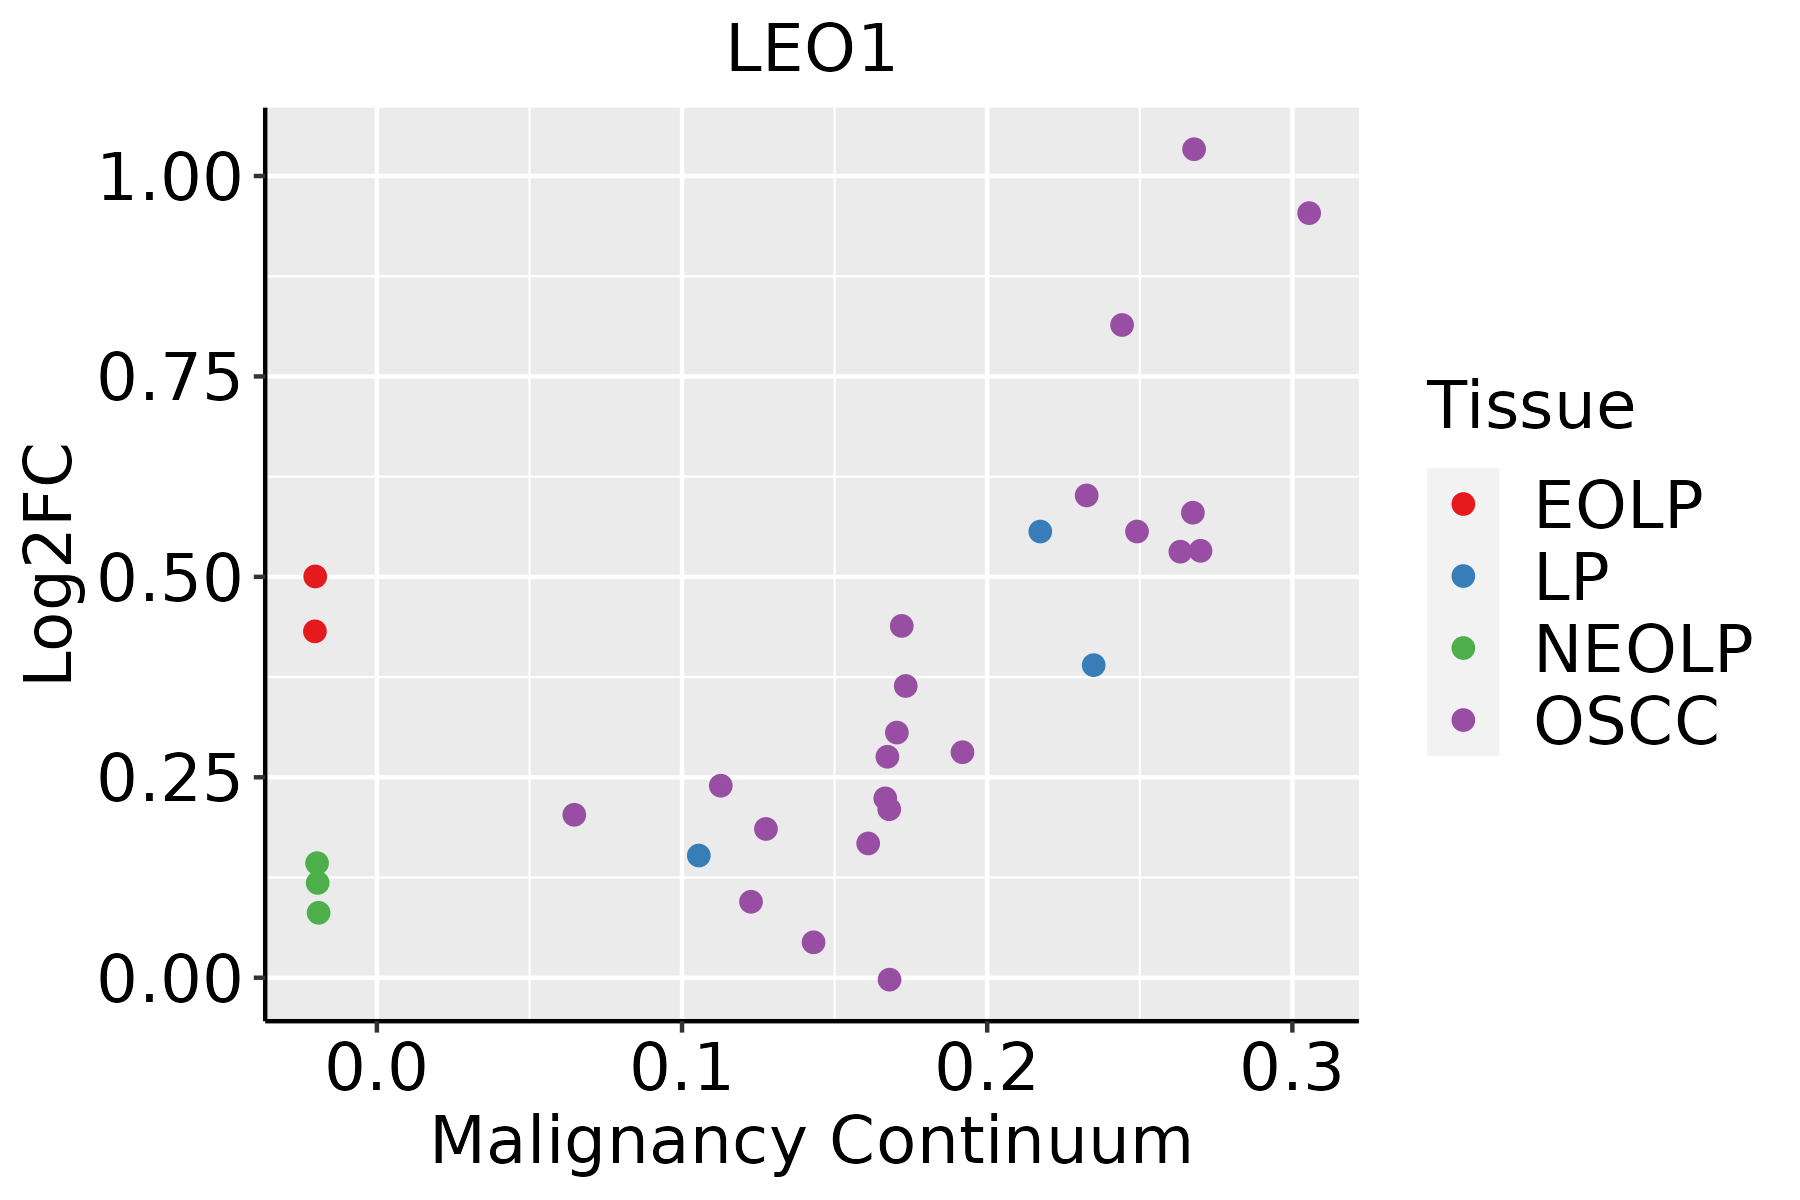
EOLP: Erosive Oral lichen planus
LP: leukoplakia
NEOLP: Non-erosive oral lichen planus
OSCC: Oral squamous cell carcinoma
SkinThe image shows the transcriptomic changes along malignancy continuum.log2FC in expression of this searched gene in stem-like cells from each diseased tissue sample relative to stem-like cells in normal samples in each tissue plotted against the malignancy continuum. Samples are colored based on if they are from different disease stage.AK: Actinic keratosis
cSCC: Cutaneous squamous cell carcinoma
SCCIS:squamous cell carcinoma in situ
ThyroidThe image shows the transcriptomic changes along malignancy continuum.log2FC in expression of this searched gene in stem-like cells from each diseased tissue sample relative to stem-like cells in normal samples in each tissue plotted against the malignancy continuum. Samples are colored based on if they are from different disease stage.
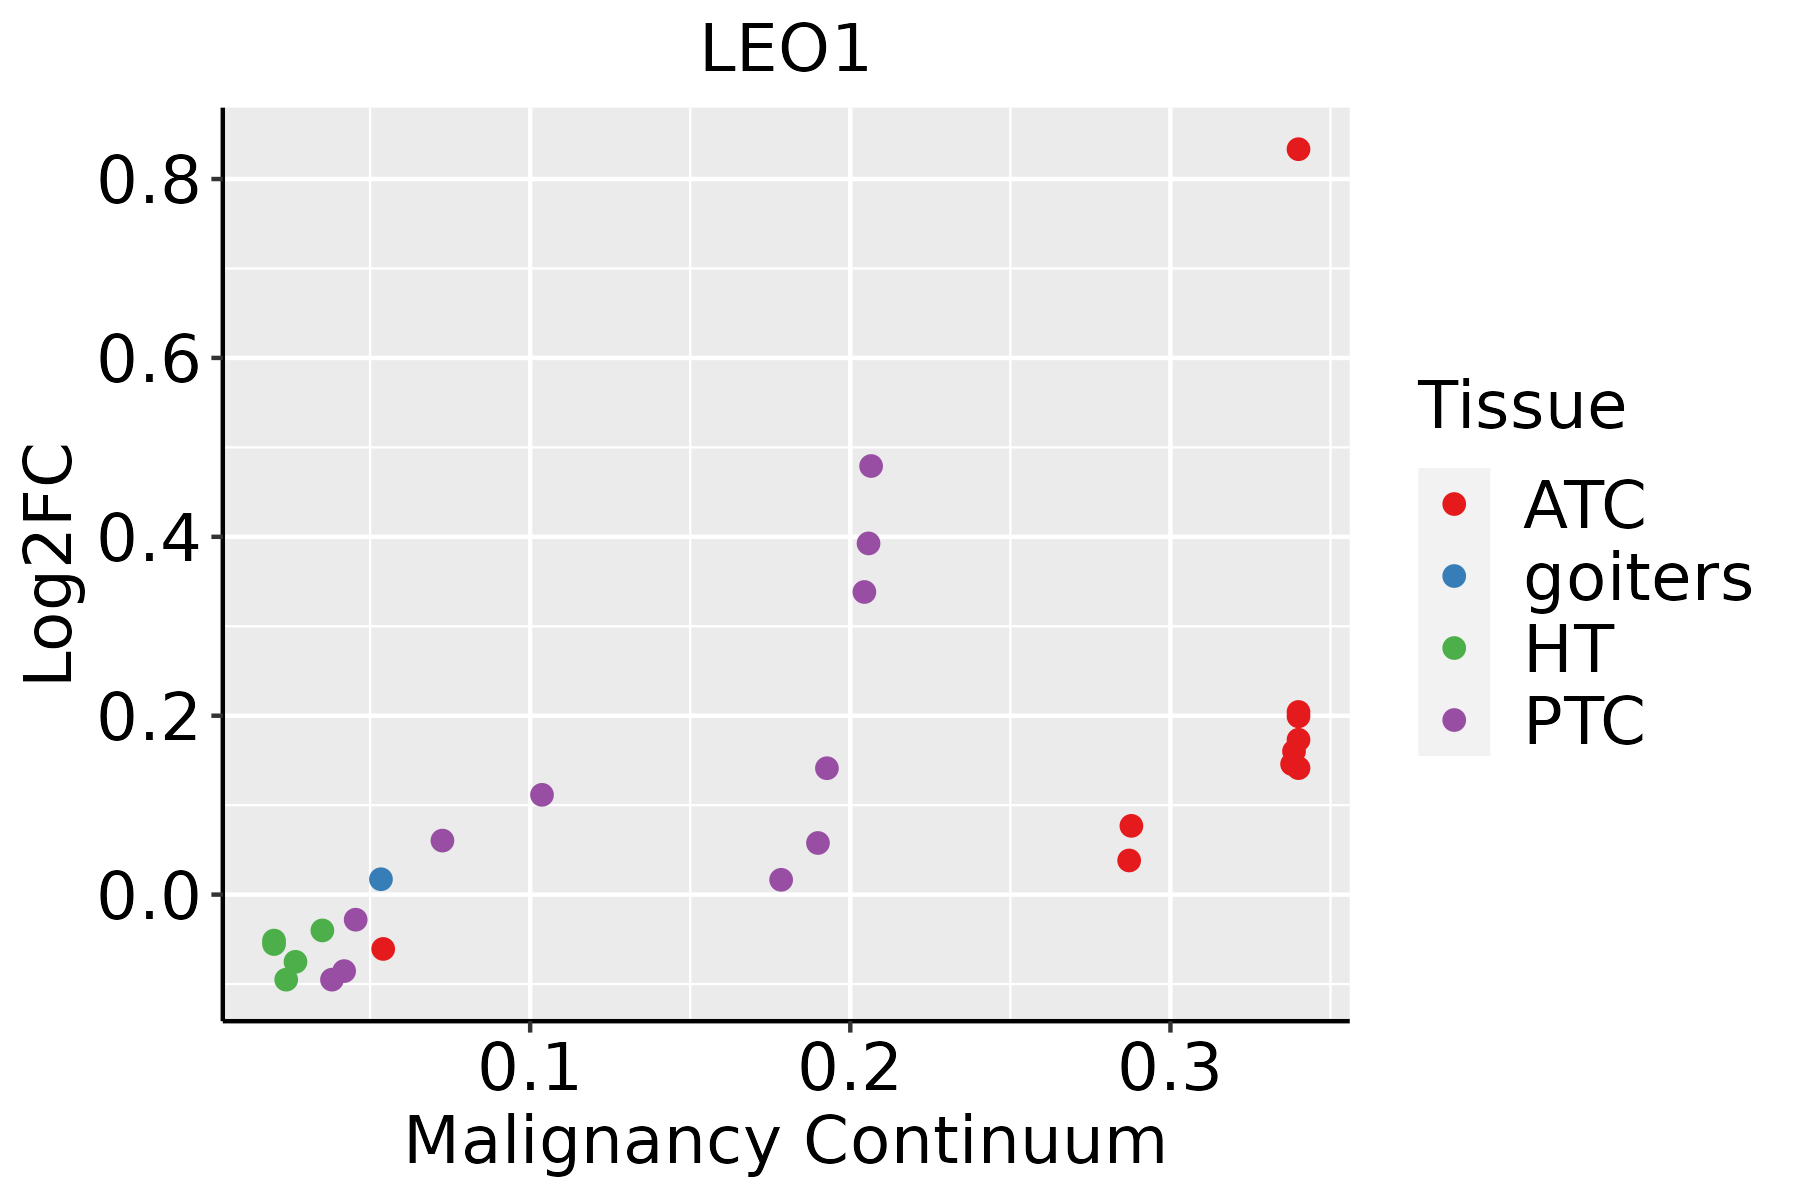
ATC: Anaplastic thyroid cancer
HT: Hashimoto's thyroiditis
PTC: Papillary thyroid cancer
∗log2FC in expression of this searched gene in stem-like cells from each diseased tissue sample relative to stem-like cells in normal samples in each tissue plotted against the malignancy continuum. Samples are colored based on if they are from different disease stage.

Top

Malignant transformation related pathway analysis

check buttonFind out the enriched GO biological processes and KEGG pathways involved in transition from healthy to precancer to cancer
check button Figure of enriched GO biological processes.
TissueDisease StageEnriched GO biological Processes
ColorectumADGO analysis - Figure of enriched GO biological processes: Top 15 enriched GO BP terms are showed in the bar plot of each disease state in each tissue. Each row represents a significant GO biological process which is colored according to the -log10(p.adjust).
ColorectumSERGO analysis - Figure of enriched GO biological processes: Top 15 enriched GO BP terms are showed in the bar plot of each disease state in each tissue. Each row represents a significant GO biological process which is colored according to the -log10(p.adjust).
ColorectumMSSGO analysis - Figure of enriched GO biological processes: Top 15 enriched GO BP terms are showed in the bar plot of each disease state in each tissue. Each row represents a significant GO biological process which is colored according to the -log10(p.adjust).
ColorectumMSI-HGO analysis - Figure of enriched GO biological processes: Top 15 enriched GO BP terms are showed in the bar plot of each disease state in each tissue. Each row represents a significant GO biological process which is colored according to the -log10(p.adjust).
ColorectumFAPGO analysis - Figure of enriched GO biological processes: Top 15 enriched GO BP terms are showed in the bar plot of each disease state in each tissue. Each row represents a significant GO biological process which is colored according to the -log10(p.adjust).
∗Top 15 enriched GO BP terms are showed in the bar plot of each disease state in each tissue. Each row represents a significant GO biological process which is colored according to the -log10(p.adjust).
Page: 1 2 3 4 5 6 7 8 9 

check button Enriched GO biological processes.
GO IDTissueDisease StageDescriptionGene RatioBg Ratiopvaluep.adjustCount
GO:00074926EsophagusESCCendoderm development54/855277/187231.20e-051.12e-0454
GO:00311233EsophagusESCCRNA 3'-end processing76/8552116/187231.25e-051.15e-0476
GO:00063783EsophagusESCCmRNA polyadenylation33/855244/187237.30e-055.49e-0433
GO:00335234EsophagusESCChistone H2B ubiquitination12/855212/187238.21e-056.01e-0412
GO:00436313EsophagusESCCRNA polyadenylation33/855245/187231.54e-041.02e-0333
GO:005068514EsophagusESCCpositive regulation of mRNA processing25/855232/187231.84e-041.17e-0325
GO:00017064EsophagusESCCendoderm formation38/855254/187232.08e-041.31e-0338
GO:00017044EsophagusESCCformation of primary germ layer75/8552121/187232.17e-041.36e-0375
GO:1903706110EsophagusESCCregulation of hemopoiesis201/8552367/187232.60e-041.58e-03201
GO:00359873EsophagusESCCendodermal cell differentiation32/855245/187234.87e-042.70e-0332
GO:003296812EsophagusESCCpositive regulation of transcription elongation from RNA polymerase II promoter12/855213/187236.18e-043.32e-0312
GO:0045637111EsophagusESCCregulation of myeloid cell differentiation118/8552210/187231.35e-036.43e-03118
GO:190331121LiverHCCregulation of mRNA metabolic process205/7958288/187233.38e-236.90e-21205
GO:005068421LiverHCCregulation of mRNA processing106/7958137/187237.64e-177.12e-15106
GO:001657021LiverHCChistone modification283/7958463/187232.68e-162.33e-14283
GO:190331321LiverHCCpositive regulation of mRNA metabolic process85/7958118/187237.10e-112.56e-0985
GO:00311241LiverHCCmRNA 3'-end processing50/795862/187238.44e-102.60e-0850
GO:00311231LiverHCCRNA 3'-end processing81/7958116/187232.27e-096.32e-0881
GO:019873821LiverHCCcell-cell signaling by wnt247/7958446/187232.11e-084.96e-07247
GO:00314401LiverHCCregulation of mRNA 3'-end processing26/795828/187232.82e-086.43e-0726
Page: 1 2 3 4 5 6 7 8 9 10 11 12 

check button Enriched KEGG pathways.
Pathway IDTissueDisease StageDescriptionGene RatioBg Ratiopvaluep.adjustqvalueCount
Page: 1 

Top

Cell-cell communication analysis

check buttonIdentification of potential cell-cell interactions between two cell types and their ligand-receptor pairs for different disease states
LigandReceptorLRpairPathwayTissueDisease Stage
Page: 1 

Top

Single-cell gene regulatory network inference analysis

check buttonFind out the significant the regulons (TFs) and the target genes of each regulon across cell types for different disease states
TFCell TypeTissueDisease StageTarget GeneRSSRegulon Activity
∗The dot plots of a searched regulon are shown for all cell subpopulations in each disease state of each tissue based on the regulon specific score inferred using pySCENIC and by calculating the average expression.
Page: 1 

Top

Somatic mutation of malignant transformation related genes

check buttonAnnotation of somatic variants for genes involved in malignant transformation
Hugo SymbolVariant ClassVariant ClassificationdbSNP RSHGVScHGVSpHGVSp ShortSWISSPROTBIOTYPESIFTPolyPhenTumor Sample BarcodeTissueHistologySexAgeStageTherapy TypesDrugsOutcome
LEO1SNVMissense_Mutationc.1512N>Ap.Met504Ilep.M504IQ8WVC0protein_codingtolerated(0.08)possibly_damaging(0.69)TCGA-AN-A0FT-01Breastbreast invasive carcinomaFemale<65I/IIUnknownUnknownSD
LEO1SNVMissense_Mutationnovelc.43N>Ap.Glu15Lysp.E15KQ8WVC0protein_codingdeleterious_low_confidence(0.01)benign(0.031)TCGA-BH-A0B6-01Breastbreast invasive carcinomaFemale<65I/IIUnknownUnknownSD
LEO1SNVMissense_Mutationc.68C>Tp.Ser23Phep.S23FQ8WVC0protein_codingtolerated_low_confidence(0.1)probably_damaging(0.991)TCGA-BH-A0HF-01Breastbreast invasive carcinomaFemale>=65I/IIHormone TherapyarimidexSD
LEO1deletionFrame_Shift_Delnovelc.233delNp.Asp78ValfsTer27p.D78Vfs*27Q8WVC0protein_codingTCGA-A7-A3J0-01Breastbreast invasive carcinomaFemale<65I/IIHormone TherapyanastrazoleSD
LEO1insertionNonsense_Mutationnovelc.144_145insATTAATTATATTTTGATCCTATCTTCTTAGCTTAAATATGAGGGCAp.Glu49IlefsTer10p.E49Ifs*10Q8WVC0protein_codingTCGA-A8-A0A1-01Breastbreast invasive carcinomaFemale>=65I/IIHormone TherapytamoxiphenSD
LEO1SNVMissense_Mutationc.1168N>Cp.Asp390Hisp.D390HQ8WVC0protein_codingdeleterious(0.04)probably_damaging(0.913)TCGA-LP-A4AW-01Cervixcervical & endocervical cancerFemale<65I/IIUnknownUnknownSD
LEO1SNVMissense_Mutationc.1033C>Gp.Gln345Glup.Q345EQ8WVC0protein_codingtolerated(0.86)benign(0.003)TCGA-LP-A7HU-01Cervixcervical & endocervical cancerFemale<65I/IIUnknownUnknownSD
LEO1SNVMissense_Mutationc.1505G>Cp.Arg502Thrp.R502TQ8WVC0protein_codingdeleterious(0)probably_damaging(0.953)TCGA-Q1-A73O-01Cervixcervical & endocervical cancerFemale<65I/IIChemotherapycisplatinCR
LEO1SNVMissense_Mutationrs767042967c.862N>Tp.Arg288Cysp.R288CQ8WVC0protein_codingdeleterious(0.01)possibly_damaging(0.543)TCGA-A6-6654-01Colorectumcolon adenocarcinomaFemale>=65III/IVChemotherapyoxaliplatinSD
LEO1SNVMissense_Mutationrs751561202c.1595N>Ap.Arg532Hisp.R532HQ8WVC0protein_codingdeleterious(0.02)benign(0.007)TCGA-A6-6782-01Colorectumcolon adenocarcinomaMale>=65I/IIUnknownUnknownSD
Page: 1 2 3 4 5 6 7 

Top

Related drugs of malignant transformation related genes

check buttonIdentification of chemicals and drugs interact with genes involved in malignant transfromation
(DGIdb 4.0)
Entrez IDSymbolCategoryInteraction TypesDrug Claim NameDrug NamePMIDs
Page: 1