
|
|||||
|
 | |
| |
| |
| |
| |
| |
|
Gene: LCK |
Gene summary for LCK |
| Gene information | Species | Human | Gene symbol | LCK | Gene ID | 3932 |
| Gene name | LCK proto-oncogene, Src family tyrosine kinase | |
| Gene Alias | IMD22 | |
| Cytomap | 1p35.2 | |
| Gene Type | protein-coding | GO ID | GO:0001775 | UniProtAcc | A0A0S2Z3Y8 |
Top |
Malignant transformation analysis |
| Identification of the aberrant gene expression in precancerous and cancerous lesions by comparing the gene expression of stem-like cells in diseased tissues with normal stem cells |
| Entrez ID | Symbol | Replicates | Species | Organ | Tissue | Adj P-value | Log2FC | Malignancy |
| 3932 | LCK | LZE4T | Human | Esophagus | ESCC | 5.68e-07 | 3.24e-01 | 0.0811 |
| 3932 | LCK | LZE7T | Human | Esophagus | ESCC | 6.11e-12 | 7.35e-01 | 0.0667 |
| 3932 | LCK | LZE8T | Human | Esophagus | ESCC | 1.65e-04 | 2.94e-01 | 0.067 |
| 3932 | LCK | LZE6T | Human | Esophagus | ESCC | 2.19e-23 | 1.01e+00 | 0.0845 |
| 3932 | LCK | P74T-E | Human | Esophagus | ESCC | 5.47e-21 | 5.05e-01 | 0.1479 |
| 3932 | LCK | P82T-E | Human | Esophagus | ESCC | 4.14e-03 | 2.42e-01 | 0.1072 |
| 3932 | LCK | P130T-E | Human | Esophagus | ESCC | 2.27e-21 | 5.00e-01 | 0.1676 |
| 3932 | LCK | C04 | Human | Oral cavity | OSCC | 2.83e-02 | 1.33e-01 | 0.2633 |
| 3932 | LCK | C21 | Human | Oral cavity | OSCC | 1.77e-20 | 6.06e-01 | 0.2678 |
| 3932 | LCK | C30 | Human | Oral cavity | OSCC | 6.35e-09 | 3.46e-01 | 0.3055 |
| 3932 | LCK | C38 | Human | Oral cavity | OSCC | 5.01e-10 | 9.00e-01 | 0.172 |
| 3932 | LCK | C46 | Human | Oral cavity | OSCC | 1.86e-13 | 1.46e-01 | 0.1673 |
| 3932 | LCK | C51 | Human | Oral cavity | OSCC | 1.89e-05 | 1.47e-01 | 0.2674 |
| 3932 | LCK | C09 | Human | Oral cavity | OSCC | 2.05e-02 | 7.16e-02 | 0.1431 |
| Page: 1 |
| Tissue | Expression Dynamics | Abbreviation |
| Esophagus | 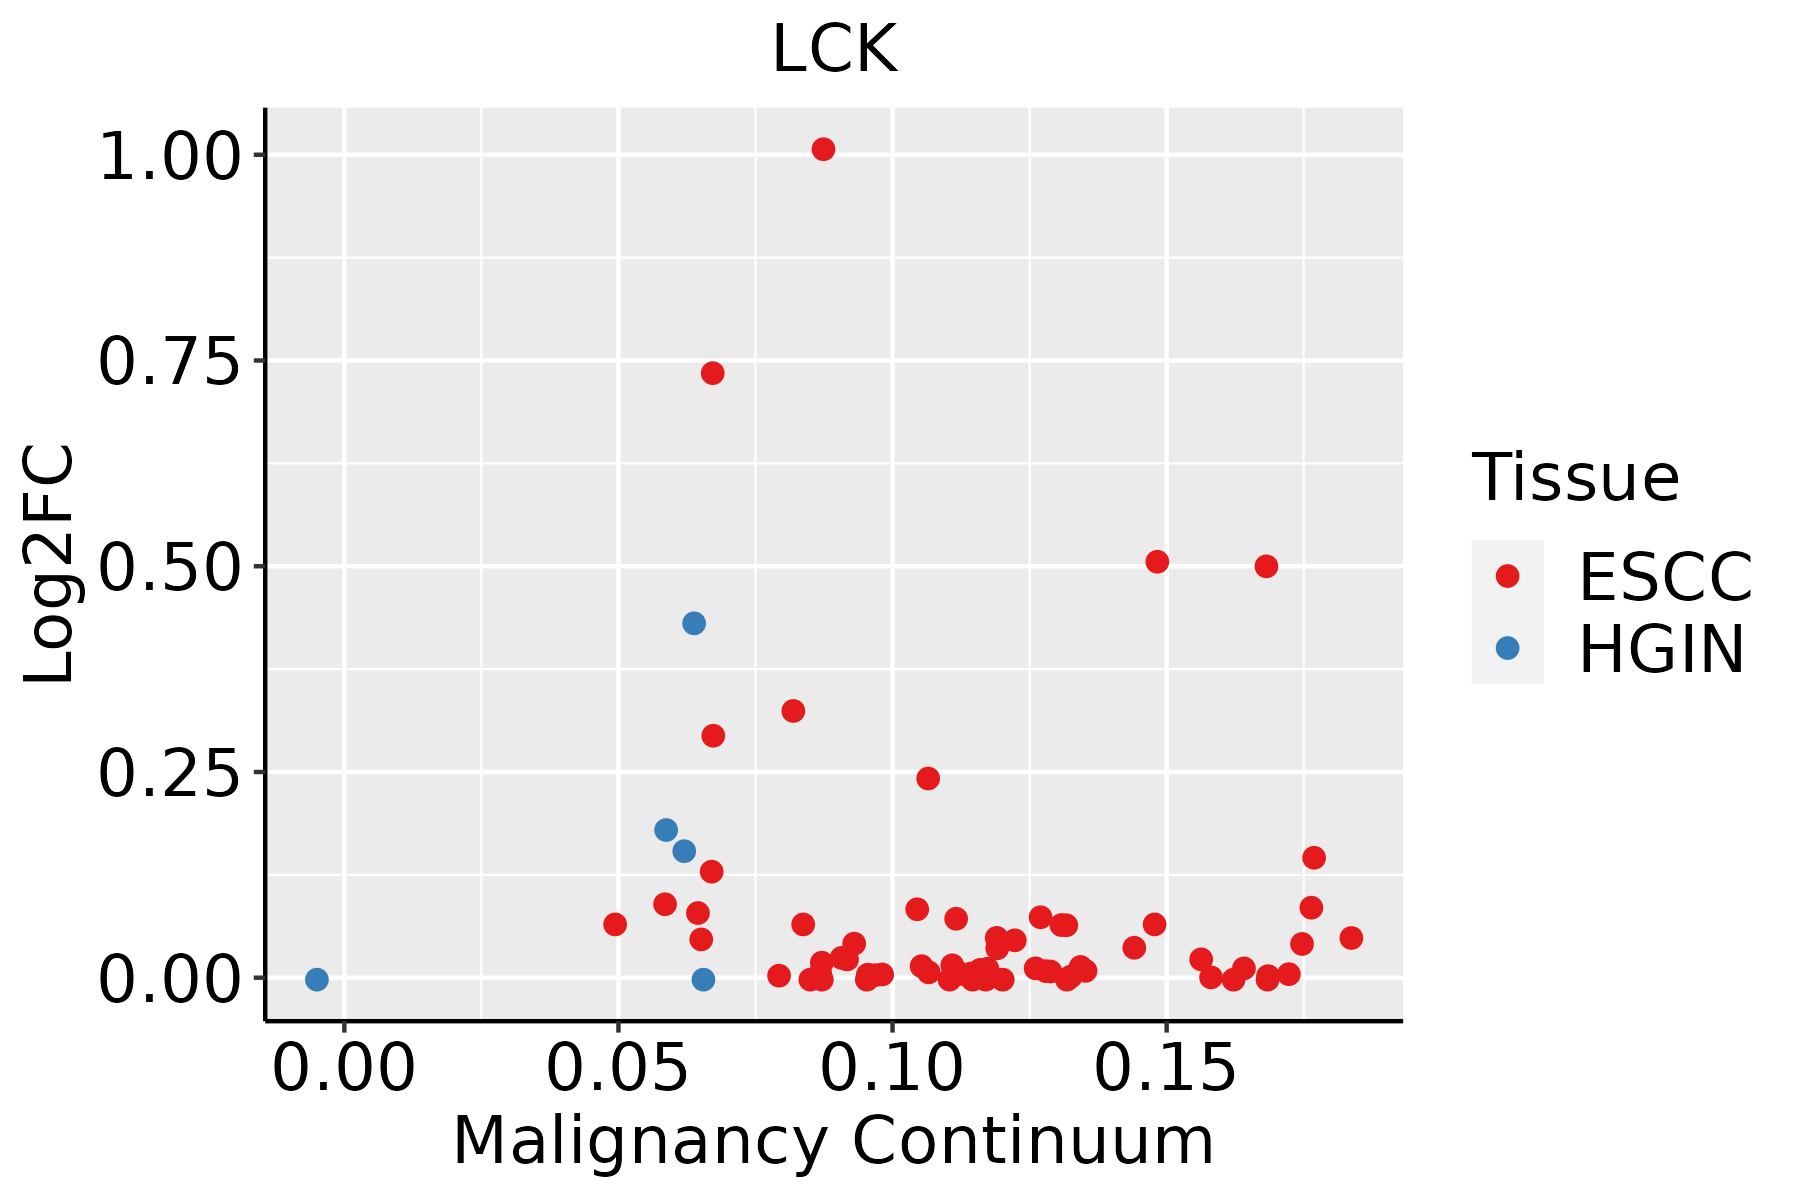 | ESCC: Esophageal squamous cell carcinoma |
| HGIN: High-grade intraepithelial neoplasias | ||
| LGIN: Low-grade intraepithelial neoplasias | ||
| Oral Cavity | 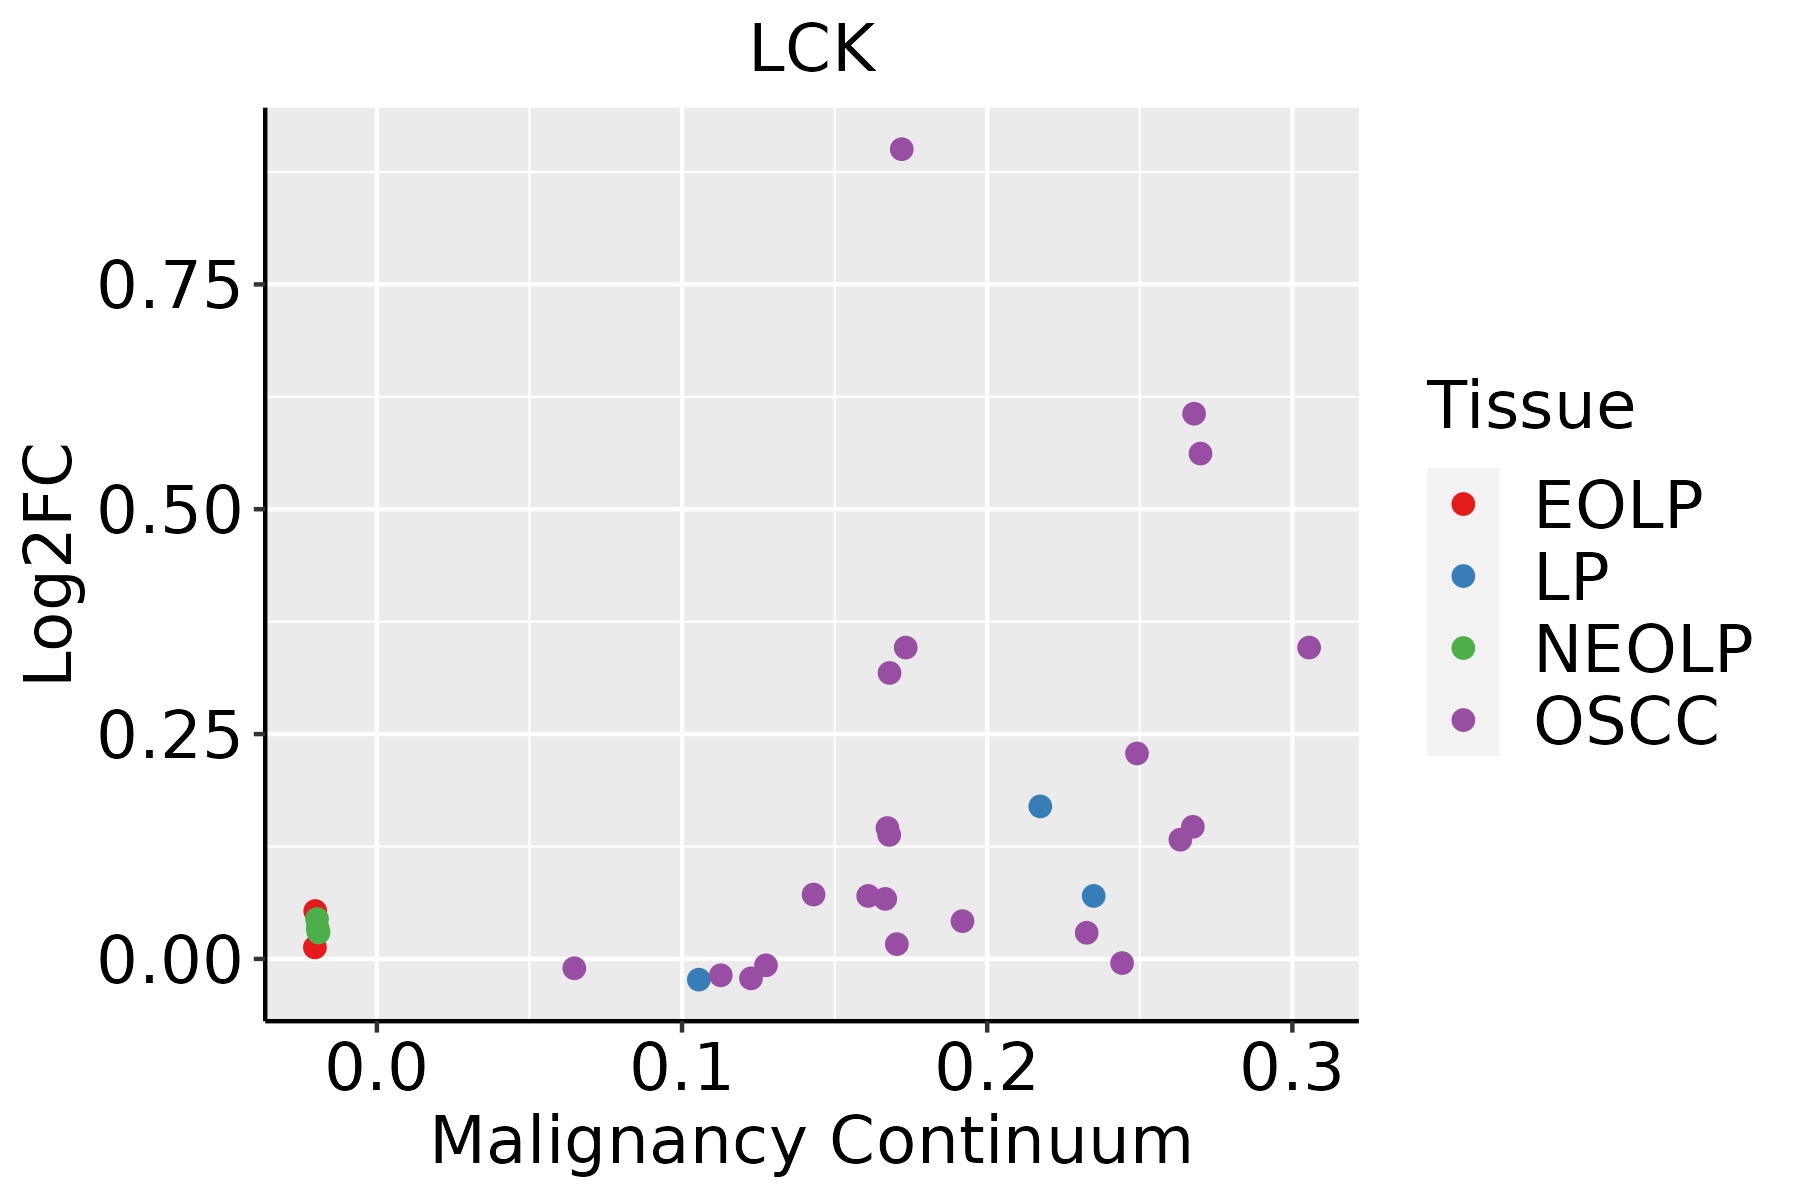 | EOLP: Erosive Oral lichen planus |
| LP: leukoplakia | ||
| NEOLP: Non-erosive oral lichen planus | ||
| OSCC: Oral squamous cell carcinoma |
| ∗log2FC in expression of this searched gene in stem-like cells from each diseased tissue sample relative to stem-like cells in normal samples in each tissue plotted against the malignancy continuum. Samples are colored based on if they are from different disease stage. |
Top |
Malignant transformation related pathway analysis |
| Find out the enriched GO biological processes and KEGG pathways involved in transition from healthy to precancer to cancer |
| Tissue | Disease Stage | Enriched GO biological Processes |
| Colorectum | AD |  |
| Colorectum | SER |  |
| Colorectum | MSS |  |
| Colorectum | MSI-H |  |
| Colorectum | FAP |  |
| ∗Top 15 enriched GO BP terms are showed in the bar plot of each disease state in each tissue. Each row represents a significant GO biological process which is colored according to the -log10(p.adjust). |
| Page: 1 2 3 4 5 6 7 8 9 |
| GO ID | Tissue | Disease Stage | Description | Gene Ratio | Bg Ratio | pvalue | p.adjust | Count |
| GO:005507617 | Esophagus | ESCC | transition metal ion homeostasis | 87/8552 | 138/18723 | 2.85e-05 | 2.37e-04 | 87 |
| GO:000941020 | Esophagus | ESCC | response to xenobiotic stimulus | 253/8552 | 462/18723 | 4.55e-05 | 3.58e-04 | 253 |
| GO:0051651111 | Esophagus | ESCC | maintenance of location in cell | 126/8552 | 214/18723 | 6.57e-05 | 5.00e-04 | 126 |
| GO:002240720 | Esophagus | ESCC | regulation of cell-cell adhesion | 239/8552 | 448/18723 | 5.88e-04 | 3.19e-03 | 239 |
| GO:00469169 | Esophagus | ESCC | cellular transition metal ion homeostasis | 70/8552 | 115/18723 | 7.28e-04 | 3.79e-03 | 70 |
| GO:004211018 | Esophagus | ESCC | T cell activation | 256/8552 | 487/18723 | 1.18e-03 | 5.87e-03 | 256 |
| GO:19031317 | Esophagus | ESCC | mononuclear cell differentiation | 226/8552 | 426/18723 | 1.20e-03 | 5.88e-03 | 226 |
| GO:00182124 | Esophagus | ESCC | peptidyl-tyrosine modification | 202/8552 | 378/18723 | 1.34e-03 | 6.39e-03 | 202 |
| GO:002240919 | Esophagus | ESCC | positive regulation of cell-cell adhesion | 155/8552 | 284/18723 | 1.50e-03 | 7.06e-03 | 155 |
| GO:00508528 | Esophagus | ESCC | T cell receptor signaling pathway | 73/8552 | 123/18723 | 1.54e-03 | 7.24e-03 | 73 |
| GO:00181084 | Esophagus | ESCC | peptidyl-tyrosine phosphorylation | 200/8552 | 375/18723 | 1.60e-03 | 7.45e-03 | 200 |
| GO:005087015 | Esophagus | ESCC | positive regulation of T cell activation | 117/8552 | 216/18723 | 7.23e-03 | 2.62e-02 | 117 |
| GO:00508565 | Esophagus | ESCC | regulation of T cell receptor signaling pathway | 27/8552 | 41/18723 | 7.31e-03 | 2.63e-02 | 27 |
| GO:00302176 | Esophagus | ESCC | T cell differentiation | 137/8552 | 257/18723 | 8.09e-03 | 2.87e-02 | 137 |
| GO:190303916 | Esophagus | ESCC | positive regulation of leukocyte cell-cell adhesion | 128/8552 | 239/18723 | 8.40e-03 | 2.96e-02 | 128 |
| GO:000715918 | Esophagus | ESCC | leukocyte cell-cell adhesion | 192/8552 | 371/18723 | 1.03e-02 | 3.51e-02 | 192 |
| GO:00341143 | Esophagus | ESCC | regulation of heterotypic cell-cell adhesion | 18/8552 | 26/18723 | 1.32e-02 | 4.31e-02 | 18 |
| GO:00341135 | Esophagus | ESCC | heterotypic cell-cell adhesion | 37/8552 | 61/18723 | 1.32e-02 | 4.31e-02 | 37 |
| GO:190303717 | Esophagus | ESCC | regulation of leukocyte cell-cell adhesion | 174/8552 | 336/18723 | 1.36e-02 | 4.43e-02 | 174 |
| GO:00300984 | Esophagus | ESCC | lymphocyte differentiation | 192/8552 | 374/18723 | 1.52e-02 | 4.93e-02 | 192 |
| Page: 1 2 3 4 5 |
| Pathway ID | Tissue | Disease Stage | Description | Gene Ratio | Bg Ratio | pvalue | p.adjust | qvalue | Count |
| hsa05166211 | Esophagus | ESCC | Human T-cell leukemia virus 1 infection | 164/4205 | 222/8465 | 8.13e-14 | 2.09e-12 | 1.07e-12 | 164 |
| hsa0513526 | Esophagus | ESCC | Yersinia infection | 100/4205 | 137/8465 | 1.80e-08 | 1.59e-07 | 8.12e-08 | 100 |
| hsa040645 | Esophagus | ESCC | NF-kappa B signaling pathway | 67/4205 | 104/8465 | 1.62e-03 | 4.89e-03 | 2.50e-03 | 67 |
| hsa052356 | Esophagus | ESCC | PD-L1 expression and PD-1 checkpoint pathway in cancer | 58/4205 | 89/8465 | 2.19e-03 | 6.16e-03 | 3.16e-03 | 58 |
| hsa046599 | Esophagus | ESCC | Th17 cell differentiation | 68/4205 | 108/8465 | 3.53e-03 | 9.30e-03 | 4.76e-03 | 68 |
| hsa046585 | Esophagus | ESCC | Th1 and Th2 cell differentiation | 58/4205 | 92/8465 | 6.49e-03 | 1.60e-02 | 8.19e-03 | 58 |
| hsa046607 | Esophagus | ESCC | T cell receptor signaling pathway | 63/4205 | 104/8465 | 1.60e-02 | 3.60e-02 | 1.84e-02 | 63 |
| hsa05166310 | Esophagus | ESCC | Human T-cell leukemia virus 1 infection | 164/4205 | 222/8465 | 8.13e-14 | 2.09e-12 | 1.07e-12 | 164 |
| hsa05135111 | Esophagus | ESCC | Yersinia infection | 100/4205 | 137/8465 | 1.80e-08 | 1.59e-07 | 8.12e-08 | 100 |
| hsa0406412 | Esophagus | ESCC | NF-kappa B signaling pathway | 67/4205 | 104/8465 | 1.62e-03 | 4.89e-03 | 2.50e-03 | 67 |
| hsa0523511 | Esophagus | ESCC | PD-L1 expression and PD-1 checkpoint pathway in cancer | 58/4205 | 89/8465 | 2.19e-03 | 6.16e-03 | 3.16e-03 | 58 |
| hsa0465914 | Esophagus | ESCC | Th17 cell differentiation | 68/4205 | 108/8465 | 3.53e-03 | 9.30e-03 | 4.76e-03 | 68 |
| hsa0465812 | Esophagus | ESCC | Th1 and Th2 cell differentiation | 58/4205 | 92/8465 | 6.49e-03 | 1.60e-02 | 8.19e-03 | 58 |
| hsa0466013 | Esophagus | ESCC | T cell receptor signaling pathway | 63/4205 | 104/8465 | 1.60e-02 | 3.60e-02 | 1.84e-02 | 63 |
| hsa0516630 | Oral cavity | OSCC | Human T-cell leukemia virus 1 infection | 150/3704 | 222/8465 | 3.68e-13 | 7.26e-12 | 3.70e-12 | 150 |
| hsa0513520 | Oral cavity | OSCC | Yersinia infection | 94/3704 | 137/8465 | 2.85e-09 | 3.08e-08 | 1.57e-08 | 94 |
| hsa040644 | Oral cavity | OSCC | NF-kappa B signaling pathway | 67/3704 | 104/8465 | 1.57e-05 | 6.75e-05 | 3.44e-05 | 67 |
| hsa046606 | Oral cavity | OSCC | T cell receptor signaling pathway | 67/3704 | 104/8465 | 1.57e-05 | 6.75e-05 | 3.44e-05 | 67 |
| hsa05235 | Oral cavity | OSCC | PD-L1 expression and PD-1 checkpoint pathway in cancer | 56/3704 | 89/8465 | 1.97e-04 | 6.55e-04 | 3.33e-04 | 56 |
| hsa046598 | Oral cavity | OSCC | Th17 cell differentiation | 65/3704 | 108/8465 | 4.02e-04 | 1.25e-03 | 6.35e-04 | 65 |
| Page: 1 2 |
Top |
Cell-cell communication analysis |
| Identification of potential cell-cell interactions between two cell types and their ligand-receptor pairs for different disease states |
| Ligand | Receptor | LRpair | Pathway | Tissue | Disease Stage |
| LCK | CD8 receptor | LCK_CD8A_CD8B1 | LCK | Breast | ADJ |
| LCK | CD8 receptor | LCK_CD8A_CD8B1 | LCK | Breast | DCIS |
| LCK | CD8 receptor | LCK_CD8A_CD8B1 | LCK | Breast | Healthy |
| LCK | CD8 receptor | LCK_CD8A_CD8B1 | LCK | Breast | IDC |
| LCK | CD8 receptor | LCK_CD8A_CD8B1 | LCK | Breast | Precancer |
| LCK | CD8 receptor | LCK_CD8A_CD8B1 | LCK | Cervix | ADJ |
| LCK | CD8 receptor | LCK_CD8A_CD8B1 | LCK | Cervix | CC |
| LCK | CD8 receptor | LCK_CD8A_CD8B1 | LCK | Cervix | Healthy |
| LCK | CD8 receptor | LCK_CD8A_CD8B1 | LCK | Cervix | Precancer |
| LCK | CD8 receptor | LCK_CD8A_CD8B1 | LCK | CRC | AD |
| LCK | CD8 receptor | LCK_CD8A_CD8B1 | LCK | CRC | ADJ |
| LCK | CD8 receptor | LCK_CD8A_CD8B1 | LCK | CRC | MSI-H |
| LCK | CD8 receptor | LCK_CD8A_CD8B1 | LCK | CRC | MSS |
| LCK | CD8 receptor | LCK_CD8A_CD8B1 | LCK | CRC | SER |
| LCK | CD8 receptor | LCK_CD8A_CD8B1 | LCK | Endometrium | ADJ |
| LCK | CD8 receptor | LCK_CD8A_CD8B1 | LCK | Endometrium | AEH |
| LCK | CD8 receptor | LCK_CD8A_CD8B1 | LCK | Endometrium | EEC |
| LCK | CD8 receptor | LCK_CD8A_CD8B1 | LCK | GC | ADJ |
| LCK | CD8 receptor | LCK_CD8A_CD8B1 | LCK | HNSCC | ADJ |
| LCK | CD8 receptor | LCK_CD8A_CD8B1 | LCK | HNSCC | Healthy |
| Page: 1 2 |
Top |
Single-cell gene regulatory network inference analysis |
| Find out the significant the regulons (TFs) and the target genes of each regulon across cell types for different disease states |
| TF | Cell Type | Tissue | Disease Stage | Target Gene | RSS | Regulon Activity |
| ∗The dot plots of a searched regulon are shown for all cell subpopulations in each disease state of each tissue based on the regulon specific score inferred using pySCENIC and by calculating the average expression. |
| Page: 1 |
Top |
Somatic mutation of malignant transformation related genes |
| Annotation of somatic variants for genes involved in malignant transformation |
| Hugo Symbol | Variant Class | Variant Classification | dbSNP RS | HGVSc | HGVSp | HGVSp Short | SWISSPROT | BIOTYPE | SIFT | PolyPhen | Tumor Sample Barcode | Tissue | Histology | Sex | Age | Stage | Therapy Types | Drugs | Outcome |
| LCK | SNV | Missense_Mutation | c.876N>C | p.Met292Ile | p.M292I | P06239 | protein_coding | deleterious(0) | possibly_damaging(0.875) | TCGA-5L-AAT1-01 | Breast | breast invasive carcinoma | Female | <65 | III/IV | Hormone Therapy | letrozol | SD | |
| LCK | SNV | Missense_Mutation | c.1419N>A | p.Met473Ile | p.M473I | P06239 | protein_coding | tolerated(0.07) | benign(0.334) | TCGA-D8-A1JA-01 | Breast | breast invasive carcinoma | Female | <65 | III/IV | Chemotherapy | adriamycin | PD | |
| LCK | SNV | Missense_Mutation | c.1062N>A | p.Phe354Leu | p.F354L | P06239 | protein_coding | deleterious(0) | benign(0.043) | TCGA-E9-A1RB-01 | Breast | breast invasive carcinoma | Female | <65 | I/II | Chemotherapy | methotrexate | SD | |
| LCK | SNV | Missense_Mutation | novel | c.469G>A | p.Glu157Lys | p.E157K | P06239 | protein_coding | deleterious(0.01) | probably_damaging(1) | TCGA-VS-A958-01 | Cervix | cervical & endocervical cancer | Female | <65 | I/II | Chemotherapy | cisplatin | CR |
| LCK | SNV | Missense_Mutation | novel | c.821N>A | p.Ser274Asn | p.S274N | P06239 | protein_coding | tolerated(0.15) | benign(0) | TCGA-VS-A9UI-01 | Cervix | cervical & endocervical cancer | Female | >=65 | I/II | Unknown | Unknown | SD |
| LCK | SNV | Missense_Mutation | c.1077T>A | p.Asn359Lys | p.N359K | P06239 | protein_coding | deleterious(0.02) | probably_damaging(0.943) | TCGA-A6-2681-01 | Colorectum | colon adenocarcinoma | Female | >=65 | I/II | Unknown | Unknown | PD | |
| LCK | SNV | Missense_Mutation | novel | c.905G>A | p.Arg302Gln | p.R302Q | P06239 | protein_coding | tolerated(0.77) | possibly_damaging(0.901) | TCGA-AA-3949-01 | Colorectum | colon adenocarcinoma | Female | >=65 | III/IV | Unknown | Unknown | SD |
| LCK | SNV | Missense_Mutation | rs749760246 | c.665N>A | p.Arg222His | p.R222H | P06239 | protein_coding | tolerated(0.34) | benign(0.001) | TCGA-AA-3984-01 | Colorectum | colon adenocarcinoma | Female | <65 | I/II | Unknown | Unknown | SD |
| LCK | SNV | Missense_Mutation | c.695C>T | p.Pro232Leu | p.P232L | P06239 | protein_coding | deleterious(0.05) | possibly_damaging(0.775) | TCGA-CM-6680-01 | Colorectum | colon adenocarcinoma | Female | >=65 | III/IV | Unknown | Unknown | SD | |
| LCK | SNV | Missense_Mutation | novel | c.497C>T | p.Ser166Leu | p.S166L | P06239 | protein_coding | deleterious(0) | probably_damaging(0.995) | TCGA-AG-A002-01 | Colorectum | rectum adenocarcinoma | Male | <65 | I/II | Unknown | Unknown | SD |
| Page: 1 2 3 4 5 6 |
Top |
Related drugs of malignant transformation related genes |
| Identification of chemicals and drugs interact with genes involved in malignant transfromation |
| (DGIdb 4.0) |
| Entrez ID | Symbol | Category | Interaction Types | Drug Claim Name | Drug Name | PMIDs |
| 3932 | LCK | KINASE, ENZYME, DRUGGABLE GENOME, CLINICALLY ACTIONABLE, TYROSINE KINASE | inhibitor | 315661265 | ||
| 3932 | LCK | KINASE, ENZYME, DRUGGABLE GENOME, CLINICALLY ACTIONABLE, TYROSINE KINASE | inhibitor | CHEMBL1201733 | PAZOPANIB HYDROCHLORIDE | |
| 3932 | LCK | KINASE, ENZYME, DRUGGABLE GENOME, CLINICALLY ACTIONABLE, TYROSINE KINASE | inhibitor | 249565748 | ||
| 3932 | LCK | KINASE, ENZYME, DRUGGABLE GENOME, CLINICALLY ACTIONABLE, TYROSINE KINASE | CENISERTIB | CENISERTIB | ||
| 3932 | LCK | KINASE, ENZYME, DRUGGABLE GENOME, CLINICALLY ACTIONABLE, TYROSINE KINASE | inhibitor | 249565866 | ||
| 3932 | LCK | KINASE, ENZYME, DRUGGABLE GENOME, CLINICALLY ACTIONABLE, TYROSINE KINASE | TCMDC-125758 | CHEMBL546797 | ||
| 3932 | LCK | KINASE, ENZYME, DRUGGABLE GENOME, CLINICALLY ACTIONABLE, TYROSINE KINASE | inhibitor | 223366064 | SARACATINIB | |
| 3932 | LCK | KINASE, ENZYME, DRUGGABLE GENOME, CLINICALLY ACTIONABLE, TYROSINE KINASE | TRIDOLGOSIR | TRIDOLGOSIR | 17897956 | |
| 3932 | LCK | KINASE, ENZYME, DRUGGABLE GENOME, CLINICALLY ACTIONABLE, TYROSINE KINASE | SB-220025 | SB-220025 | ||
| 3932 | LCK | KINASE, ENZYME, DRUGGABLE GENOME, CLINICALLY ACTIONABLE, TYROSINE KINASE | AZAKENPAULLONE | AZAKENPAULLONE |
| Page: 1 2 3 4 5 6 7 8 9 |

Copyright 2023-Present -The University of Texas Health Science Center at Houston |