
|
|||||
|
 | |
| |
| |
| |
| |
| |
|
Gene: KIF13B |
Gene summary for KIF13B |
| Gene information | Species | Human | Gene symbol | KIF13B | Gene ID | 23303 |
| Gene name | kinesin family member 13B | |
| Gene Alias | GAKIN | |
| Cytomap | 8p12 | |
| Gene Type | protein-coding | GO ID | GO:0000902 | UniProtAcc | Q9NQT8 |
Top |
Malignant transformation analysis |
| Identification of the aberrant gene expression in precancerous and cancerous lesions by comparing the gene expression of stem-like cells in diseased tissues with normal stem cells |
| Entrez ID | Symbol | Replicates | Species | Organ | Tissue | Adj P-value | Log2FC | Malignancy |
| 23303 | KIF13B | HTA11_3410_2000001011 | Human | Colorectum | AD | 4.05e-27 | -7.70e-01 | 0.0155 |
| 23303 | KIF13B | HTA11_2951_2000001011 | Human | Colorectum | AD | 1.20e-02 | -7.14e-01 | 0.0216 |
| 23303 | KIF13B | HTA11_347_2000001011 | Human | Colorectum | AD | 7.81e-04 | 3.69e-01 | -0.1954 |
| 23303 | KIF13B | HTA11_2992_2000001011 | Human | Colorectum | SER | 5.23e-04 | -3.72e-01 | -0.1706 |
| 23303 | KIF13B | HTA11_866_3004761011 | Human | Colorectum | AD | 8.10e-17 | -6.59e-01 | 0.096 |
| 23303 | KIF13B | HTA11_9408_2000001011 | Human | Colorectum | AD | 4.06e-03 | -8.33e-01 | 0.0451 |
| 23303 | KIF13B | HTA11_8622_2000001021 | Human | Colorectum | SER | 1.23e-02 | -7.19e-01 | 0.0528 |
| 23303 | KIF13B | HTA11_10711_2000001011 | Human | Colorectum | AD | 3.22e-12 | -6.90e-01 | 0.0338 |
| 23303 | KIF13B | HTA11_7696_3000711011 | Human | Colorectum | AD | 3.07e-21 | -6.31e-01 | 0.0674 |
| 23303 | KIF13B | HTA11_6818_2000001021 | Human | Colorectum | AD | 9.02e-04 | -5.84e-01 | 0.0588 |
| 23303 | KIF13B | HTA11_99999970781_79442 | Human | Colorectum | MSS | 4.03e-39 | -7.57e-01 | 0.294 |
| 23303 | KIF13B | HTA11_99999965104_69814 | Human | Colorectum | MSS | 1.97e-08 | -5.65e-01 | 0.281 |
| 23303 | KIF13B | HTA11_99999971662_82457 | Human | Colorectum | MSS | 1.56e-29 | -7.35e-01 | 0.3859 |
| 23303 | KIF13B | HTA11_99999973899_84307 | Human | Colorectum | MSS | 3.51e-05 | -6.43e-01 | 0.2585 |
| 23303 | KIF13B | HTA11_99999974143_84620 | Human | Colorectum | MSS | 1.99e-05 | -3.72e-01 | 0.3005 |
| 23303 | KIF13B | F007 | Human | Colorectum | FAP | 4.05e-04 | -4.34e-01 | 0.1176 |
| 23303 | KIF13B | A002-C-010 | Human | Colorectum | FAP | 9.06e-08 | -4.03e-01 | 0.242 |
| 23303 | KIF13B | A001-C-207 | Human | Colorectum | FAP | 2.47e-03 | -2.60e-01 | 0.1278 |
| 23303 | KIF13B | A015-C-203 | Human | Colorectum | FAP | 2.87e-44 | -6.82e-01 | -0.1294 |
| 23303 | KIF13B | A015-C-204 | Human | Colorectum | FAP | 3.21e-06 | -4.41e-01 | -0.0228 |
| Page: 1 2 3 4 5 6 7 8 |
| Tissue | Expression Dynamics | Abbreviation |
| Colorectum (GSE201348) |  | FAP: Familial adenomatous polyposis |
| CRC: Colorectal cancer | ||
| Colorectum (HTA11) |  | AD: Adenomas |
| SER: Sessile serrated lesions | ||
| MSI-H: Microsatellite-high colorectal cancer | ||
| MSS: Microsatellite stable colorectal cancer | ||
| Endometrium | 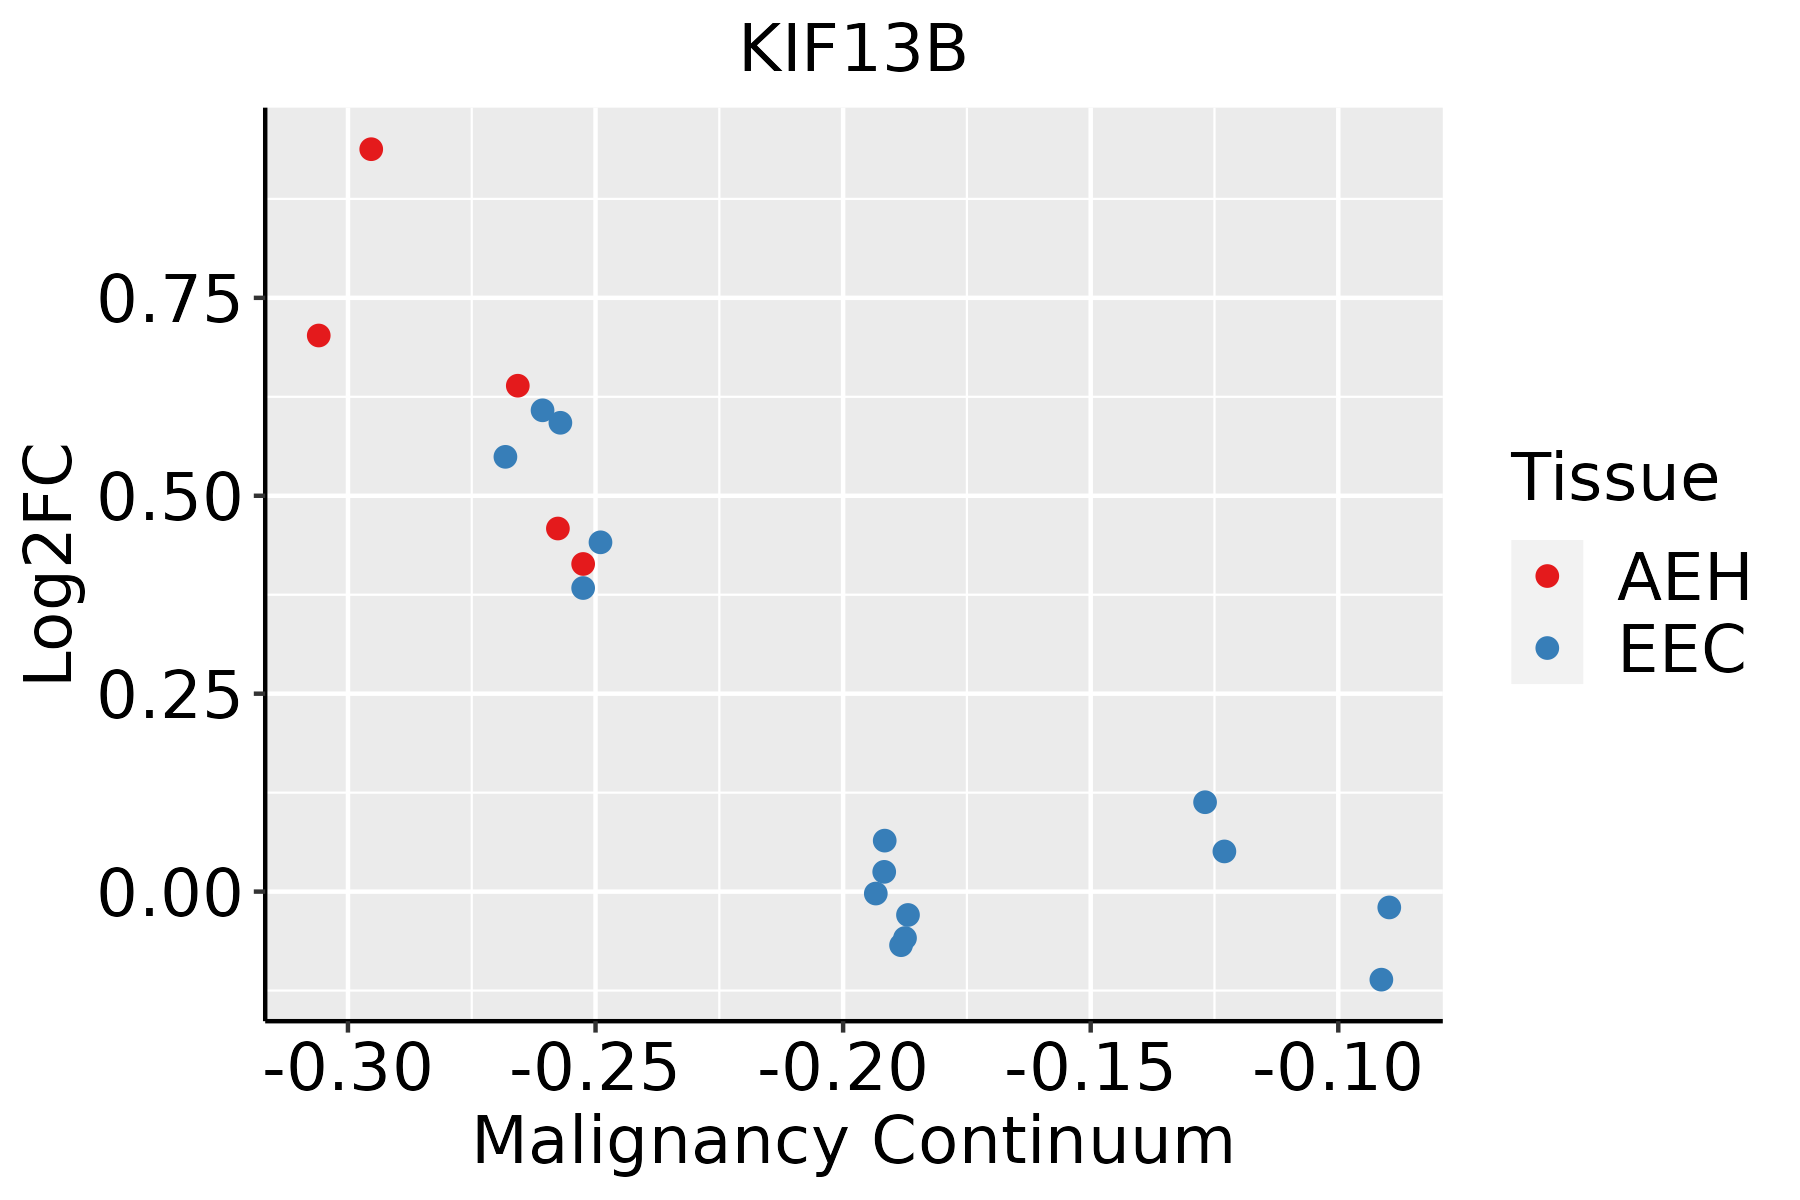 | AEH: Atypical endometrial hyperplasia |
| EEC: Endometrioid Cancer | ||
| Esophagus |  | ESCC: Esophageal squamous cell carcinoma |
| HGIN: High-grade intraepithelial neoplasias | ||
| LGIN: Low-grade intraepithelial neoplasias | ||
| GC | 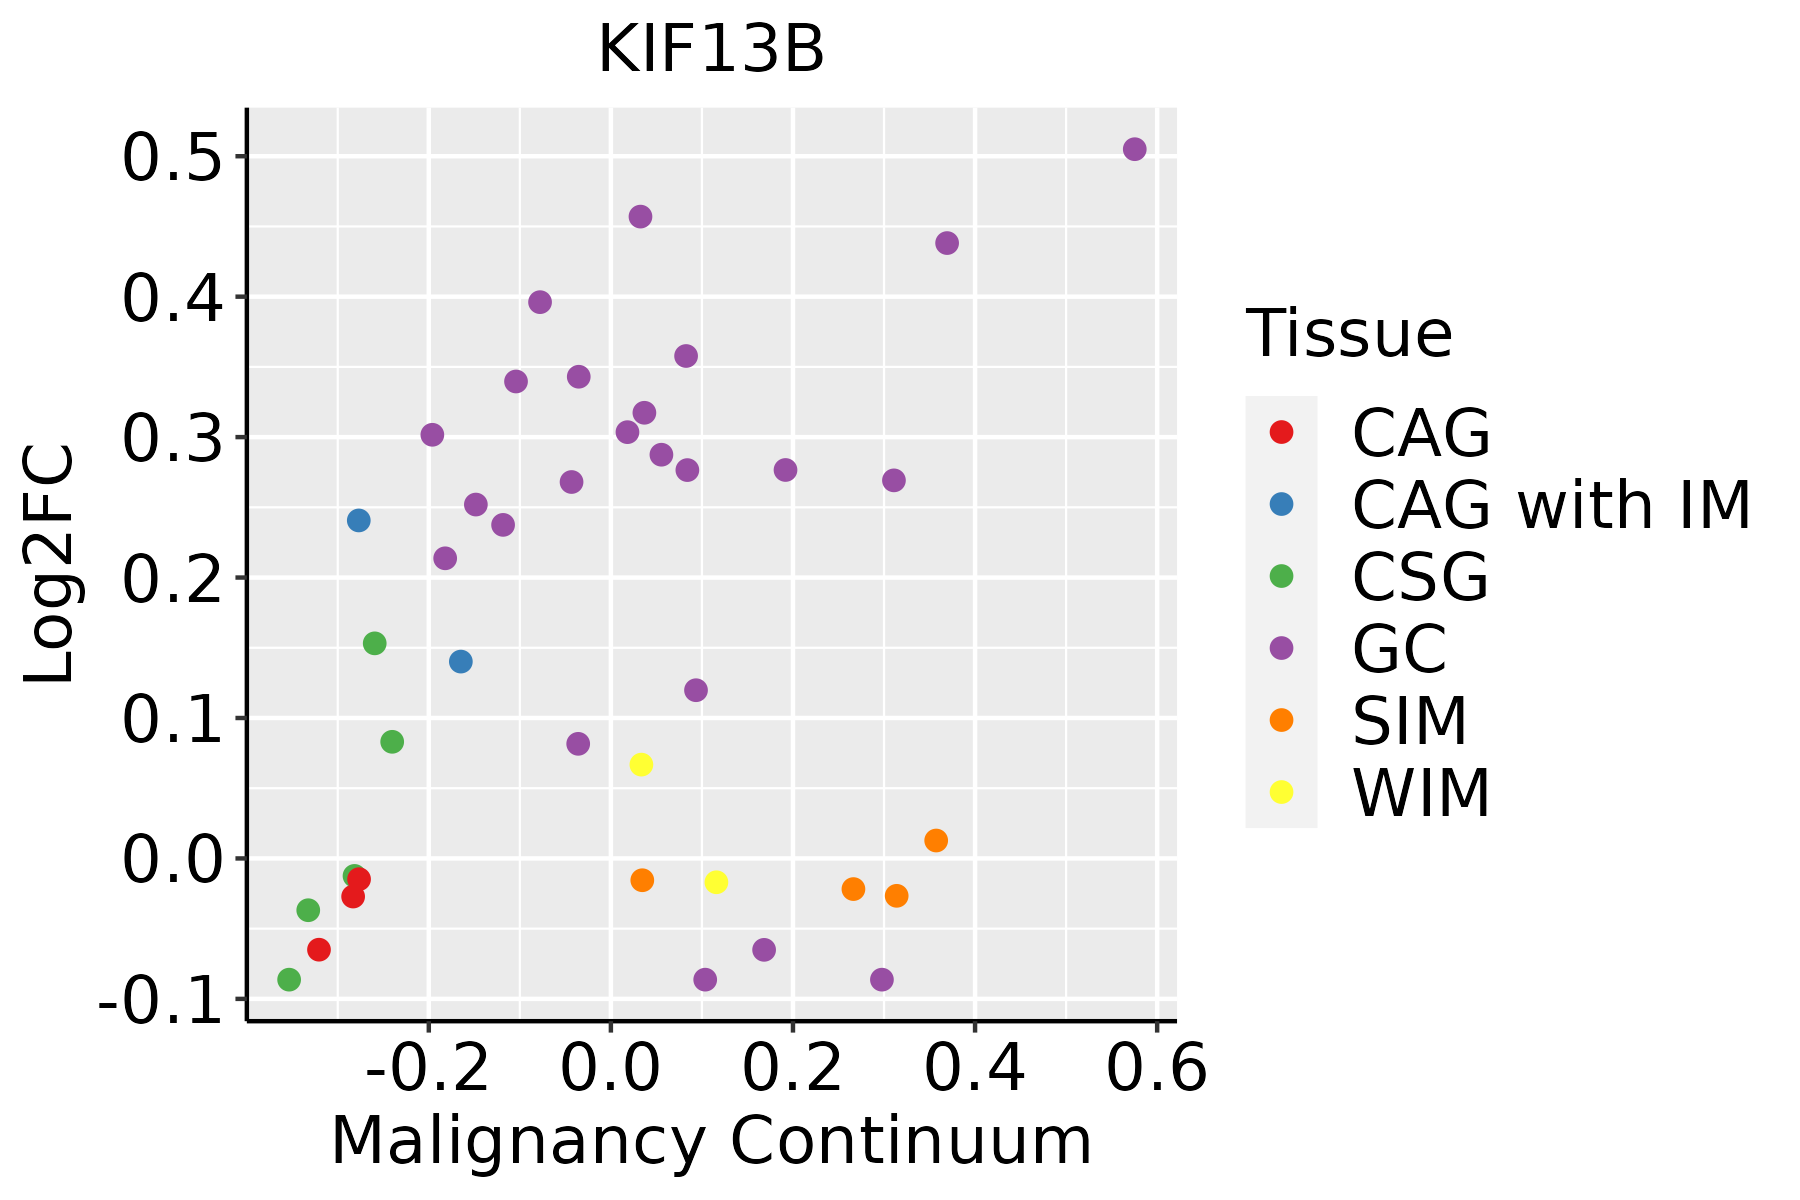 | CAG: Chronic atrophic gastritis |
| CAG with IM: Chronic atrophic gastritis with intestinal metaplasia | ||
| CSG: Chronic superficial gastritis | ||
| GC: Gastric cancer | ||
| SIM: Severe intestinal metaplasia | ||
| WIM: Wild intestinal metaplasia | ||
| Prostate | 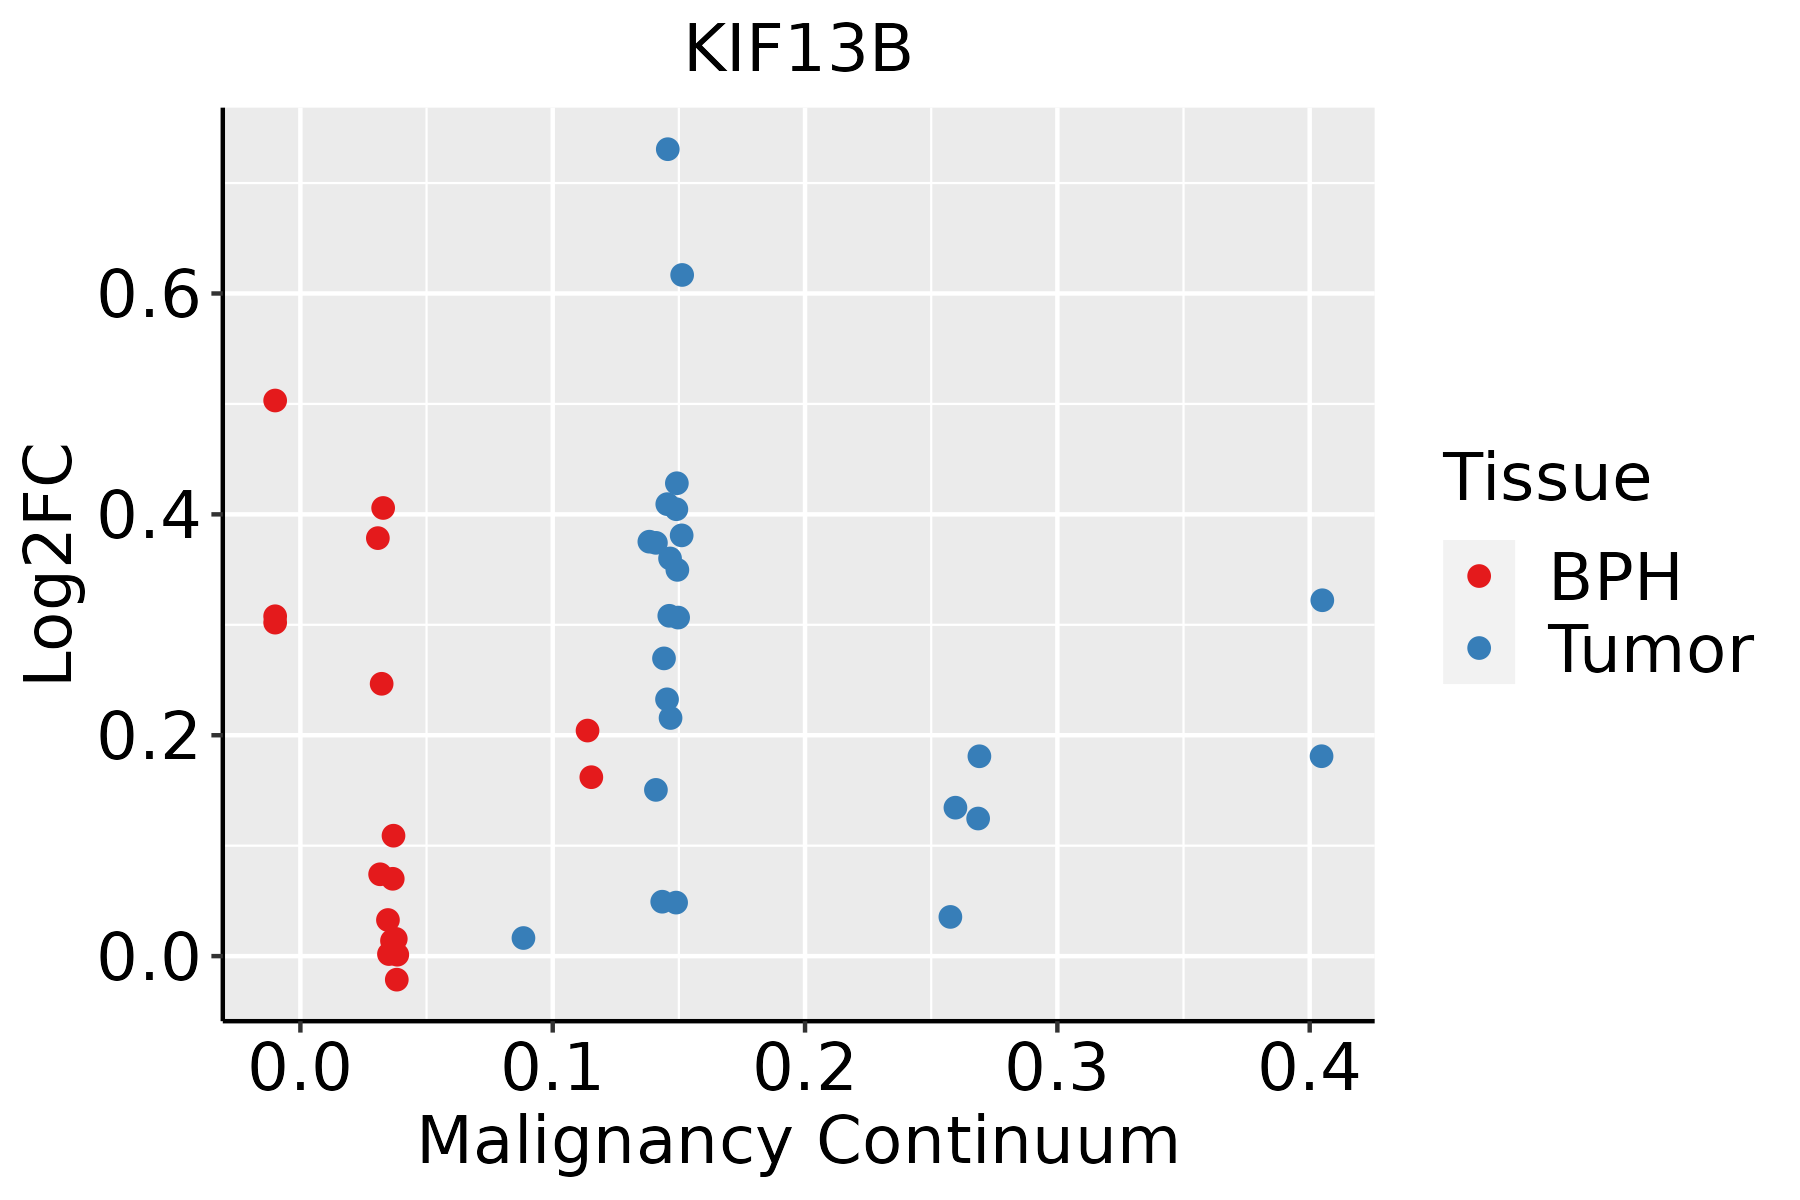 | BPH: Benign Prostatic Hyperplasia |
| Thyroid | 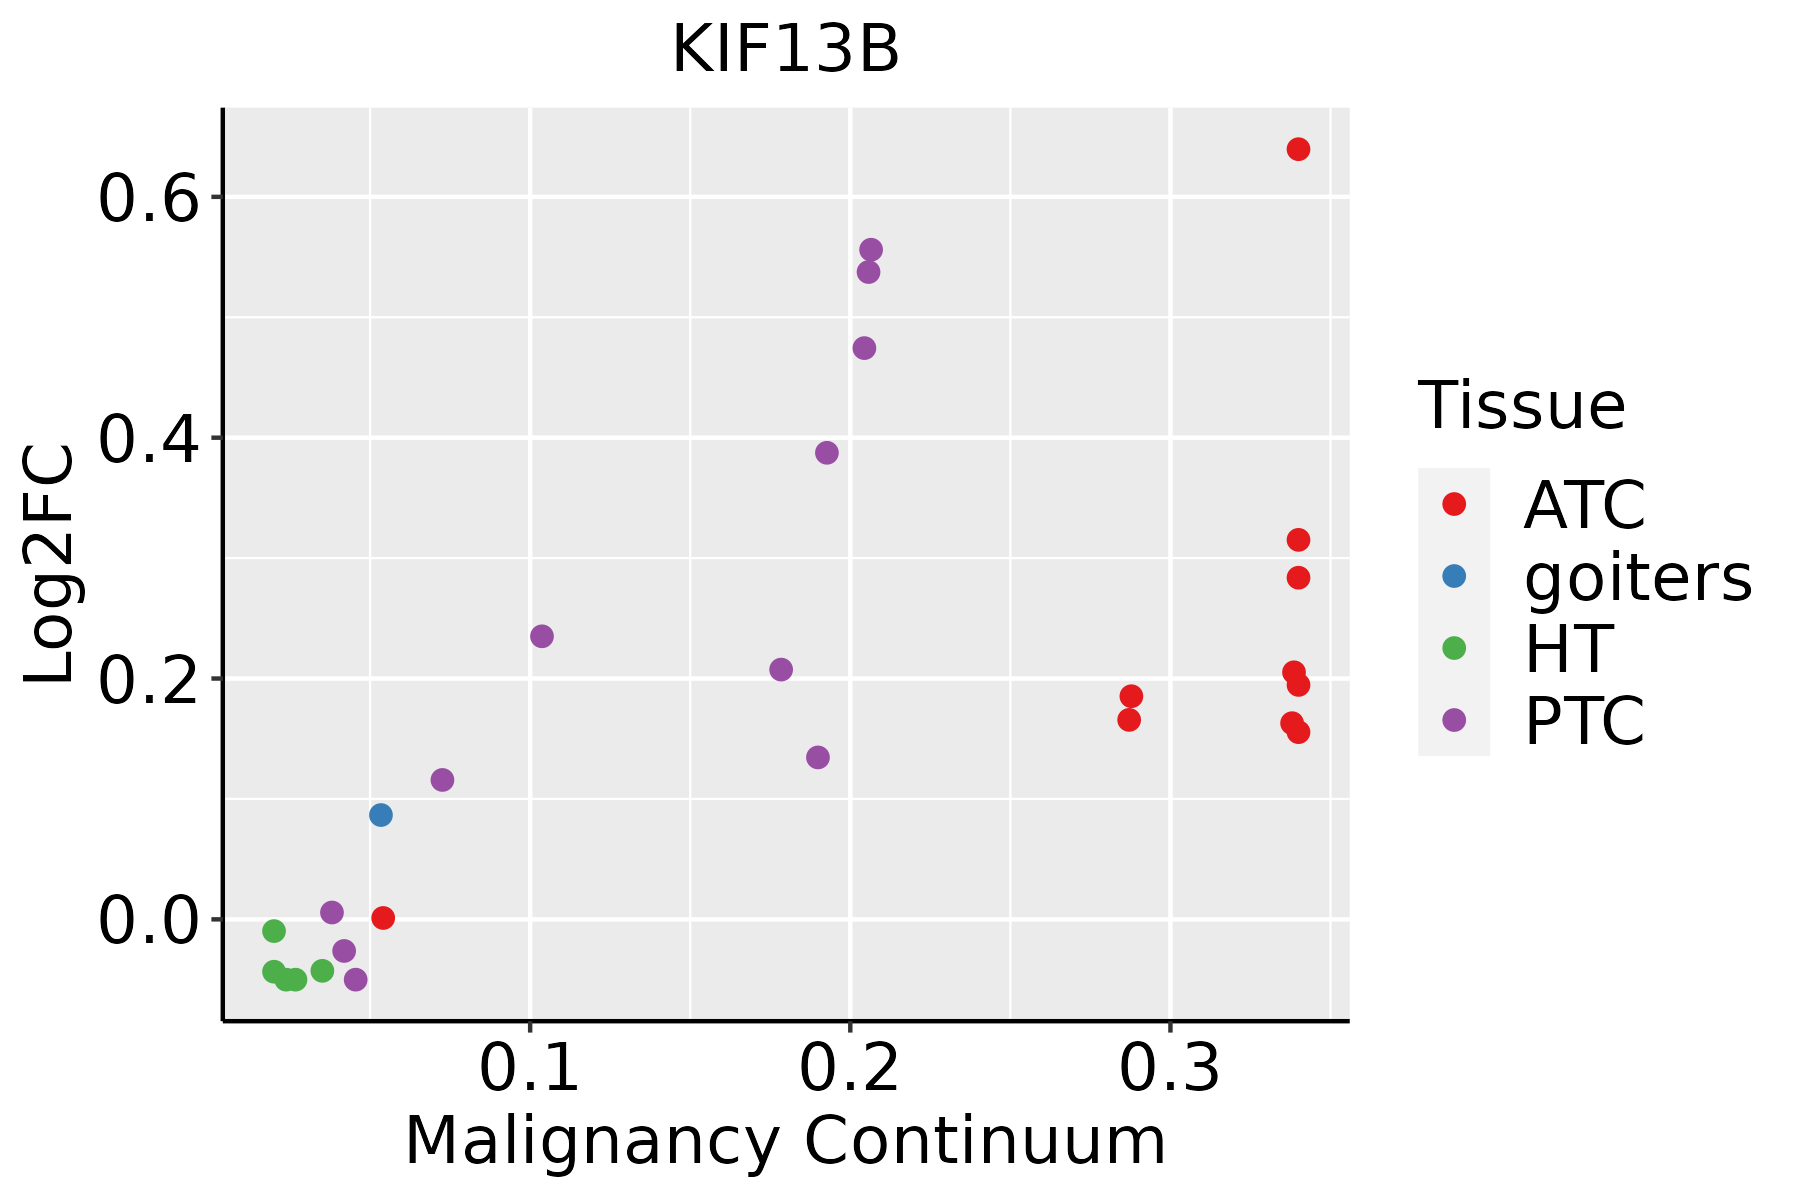 | ATC: Anaplastic thyroid cancer |
| HT: Hashimoto's thyroiditis | ||
| PTC: Papillary thyroid cancer |
| ∗log2FC in expression of this searched gene in stem-like cells from each diseased tissue sample relative to stem-like cells in normal samples in each tissue plotted against the malignancy continuum. Samples are colored based on if they are from different disease stage. |
Top |
Malignant transformation related pathway analysis |
| Find out the enriched GO biological processes and KEGG pathways involved in transition from healthy to precancer to cancer |
| Tissue | Disease Stage | Enriched GO biological Processes |
| Colorectum | AD |  |
| Colorectum | SER |  |
| Colorectum | MSS |  |
| Colorectum | MSI-H |  |
| Colorectum | FAP |  |
| ∗Top 15 enriched GO BP terms are showed in the bar plot of each disease state in each tissue. Each row represents a significant GO biological process which is colored according to the -log10(p.adjust). |
| Page: 1 2 3 4 5 6 7 8 9 |
| GO ID | Tissue | Disease Stage | Description | Gene Ratio | Bg Ratio | pvalue | p.adjust | Count |
| GO:00615644 | Colorectum | CRC | axon development | 86/2078 | 467/18723 | 1.48e-06 | 8.12e-05 | 86 |
| GO:00109754 | Colorectum | CRC | regulation of neuron projection development | 82/2078 | 445/18723 | 2.51e-06 | 1.19e-04 | 82 |
| GO:00507703 | Colorectum | CRC | regulation of axonogenesis | 34/2078 | 154/18723 | 6.37e-05 | 1.39e-03 | 34 |
| GO:00066055 | Colorectum | CRC | protein targeting | 54/2078 | 314/18723 | 7.17e-04 | 9.28e-03 | 54 |
| GO:000660516 | Endometrium | AEH | protein targeting | 68/2100 | 314/18723 | 6.30e-08 | 3.38e-06 | 68 |
| GO:00074098 | Endometrium | AEH | axonogenesis | 81/2100 | 418/18723 | 5.54e-07 | 2.12e-05 | 81 |
| GO:00615648 | Endometrium | AEH | axon development | 88/2100 | 467/18723 | 6.39e-07 | 2.38e-05 | 88 |
| GO:00421109 | Endometrium | AEH | T cell activation | 81/2100 | 487/18723 | 1.78e-04 | 2.30e-03 | 81 |
| GO:00109758 | Endometrium | AEH | regulation of neuron projection development | 75/2100 | 445/18723 | 2.01e-04 | 2.54e-03 | 75 |
| GO:006156412 | Endometrium | EEC | axon development | 93/2168 | 467/18723 | 9.60e-08 | 4.69e-06 | 93 |
| GO:000660517 | Endometrium | EEC | protein targeting | 69/2168 | 314/18723 | 9.61e-08 | 4.69e-06 | 69 |
| GO:000740912 | Endometrium | EEC | axonogenesis | 82/2168 | 418/18723 | 1.03e-06 | 3.49e-05 | 82 |
| GO:001097513 | Endometrium | EEC | regulation of neuron projection development | 79/2168 | 445/18723 | 6.80e-05 | 1.01e-03 | 79 |
| GO:004211014 | Endometrium | EEC | T cell activation | 85/2168 | 487/18723 | 6.81e-05 | 1.01e-03 | 85 |
| GO:0006605111 | Esophagus | ESCC | protein targeting | 229/8552 | 314/18723 | 4.93e-23 | 1.01e-20 | 229 |
| GO:006156415 | Esophagus | ESCC | axon development | 251/8552 | 467/18723 | 2.41e-04 | 1.49e-03 | 251 |
| GO:001097516 | Esophagus | ESCC | regulation of neuron projection development | 240/8552 | 445/18723 | 2.48e-04 | 1.53e-03 | 240 |
| GO:004211018 | Esophagus | ESCC | T cell activation | 256/8552 | 487/18723 | 1.18e-03 | 5.87e-03 | 256 |
| GO:000740915 | Esophagus | ESCC | axonogenesis | 219/8552 | 418/18723 | 3.14e-03 | 1.31e-02 | 219 |
| GO:000660518 | Prostate | BPH | protein targeting | 102/3107 | 314/18723 | 2.51e-12 | 2.05e-10 | 102 |
| Page: 1 2 3 4 |
| Pathway ID | Tissue | Disease Stage | Description | Gene Ratio | Bg Ratio | pvalue | p.adjust | qvalue | Count |
| hsa048144 | Endometrium | AEH | Motor proteins | 42/1197 | 193/8465 | 2.41e-03 | 1.42e-02 | 1.04e-02 | 42 |
| hsa0481411 | Endometrium | AEH | Motor proteins | 42/1197 | 193/8465 | 2.41e-03 | 1.42e-02 | 1.04e-02 | 42 |
| hsa048142 | Endometrium | EEC | Motor proteins | 42/1237 | 193/8465 | 4.43e-03 | 2.39e-02 | 1.78e-02 | 42 |
| hsa048143 | Endometrium | EEC | Motor proteins | 42/1237 | 193/8465 | 4.43e-03 | 2.39e-02 | 1.78e-02 | 42 |
| Page: 1 |
Top |
Cell-cell communication analysis |
| Identification of potential cell-cell interactions between two cell types and their ligand-receptor pairs for different disease states |
| Ligand | Receptor | LRpair | Pathway | Tissue | Disease Stage |
| Page: 1 |
Top |
Single-cell gene regulatory network inference analysis |
| Find out the significant the regulons (TFs) and the target genes of each regulon across cell types for different disease states |
| TF | Cell Type | Tissue | Disease Stage | Target Gene | RSS | Regulon Activity |
| ∗The dot plots of a searched regulon are shown for all cell subpopulations in each disease state of each tissue based on the regulon specific score inferred using pySCENIC and by calculating the average expression. |
| Page: 1 |
Top |
Somatic mutation of malignant transformation related genes |
| Annotation of somatic variants for genes involved in malignant transformation |
| Hugo Symbol | Variant Class | Variant Classification | dbSNP RS | HGVSc | HGVSp | HGVSp Short | SWISSPROT | BIOTYPE | SIFT | PolyPhen | Tumor Sample Barcode | Tissue | Histology | Sex | Age | Stage | Therapy Types | Drugs | Outcome |
| KIF13B | SNV | Missense_Mutation | novel | c.1851N>T | p.Gln617His | p.Q617H | Q9NQT8 | protein_coding | deleterious(0.03) | benign(0.141) | TCGA-AN-A046-01 | Breast | breast invasive carcinoma | Female | >=65 | I/II | Unknown | Unknown | SD |
| KIF13B | SNV | Missense_Mutation | novel | c.2320G>A | p.Glu774Lys | p.E774K | Q9NQT8 | protein_coding | tolerated(0.54) | benign(0.062) | TCGA-BH-A0B0-01 | Breast | breast invasive carcinoma | Female | <65 | I/II | Chemotherapy | adriamycin | CR |
| KIF13B | SNV | Missense_Mutation | rs759564273 | c.3275N>A | p.Arg1092His | p.R1092H | Q9NQT8 | protein_coding | deleterious(0) | probably_damaging(0.997) | TCGA-D8-A1JE-01 | Breast | breast invasive carcinoma | Female | <65 | I/II | Chemotherapy | adriamicin | SD |
| KIF13B | SNV | Missense_Mutation | rs753292093 | c.2935N>T | p.Arg979Trp | p.R979W | Q9NQT8 | protein_coding | deleterious(0.01) | probably_damaging(0.982) | TCGA-E9-A1NG-01 | Breast | breast invasive carcinoma | Female | <65 | I/II | Hormone Therapy | letrozole | SD |
| KIF13B | SNV | Missense_Mutation | novel | c.340A>G | p.Met114Val | p.M114V | Q9NQT8 | protein_coding | deleterious(0) | probably_damaging(0.953) | TCGA-EW-A2FV-01 | Breast | breast invasive carcinoma | Female | <65 | III/IV | Chemotherapy | docetaxel | SD |
| KIF13B | insertion | In_Frame_Ins | novel | c.1235_1236insTCTTTCAAAATCTATTTCTGACAG | p.Glu412delinsAspLeuSerLysSerIleSerAspArg | p.E412delinsDLSKSISDR | Q9NQT8 | protein_coding | TCGA-A2-A04V-01 | Breast | breast invasive carcinoma | Female | <65 | I/II | Chemotherapy | cytoxan | PD | ||
| KIF13B | insertion | Nonsense_Mutation | novel | c.4135_4136insTACATGGGGTTGTTTCATAACAGTGG | p.Ser1379IlefsTer7 | p.S1379Ifs*7 | Q9NQT8 | protein_coding | TCGA-AN-A03X-01 | Breast | breast invasive carcinoma | Female | >=65 | I/II | Unknown | Unknown | SD | ||
| KIF13B | insertion | Frame_Shift_Ins | novel | c.4133_4134insTGGTGTCCATGCGTCA | p.Arg1378SerfsTer64 | p.R1378Sfs*64 | Q9NQT8 | protein_coding | TCGA-AN-A03X-01 | Breast | breast invasive carcinoma | Female | >=65 | I/II | Unknown | Unknown | SD | ||
| KIF13B | insertion | Nonsense_Mutation | novel | c.4147_4148insAAGGCGGATAACGTCTCATTTATTCAGAAAATGA | p.Pro1383GlnfsTer4 | p.P1383Qfs*4 | Q9NQT8 | protein_coding | TCGA-BH-A0B1-01 | Breast | breast invasive carcinoma | Female | >=65 | I/II | Chemotherapy | adriamycin | SD | ||
| KIF13B | SNV | Missense_Mutation | rs192432763 | c.5374N>A | p.Ala1792Thr | p.A1792T | Q9NQT8 | protein_coding | tolerated(0.3) | benign(0.009) | TCGA-EA-A3HS-01 | Cervix | cervical & endocervical cancer | Female | <65 | I/II | Unknown | Unknown | SD |
| Page: 1 2 3 4 5 6 7 8 9 10 11 12 13 14 15 |
Top |
Related drugs of malignant transformation related genes |
| Identification of chemicals and drugs interact with genes involved in malignant transfromation |
| (DGIdb 4.0) |
| Entrez ID | Symbol | Category | Interaction Types | Drug Claim Name | Drug Name | PMIDs |
| Page: 1 |

Copyright 2023-Present -The University of Texas Health Science Center at Houston |