
|
|||||
|
 | |
| |
| |
| |
| |
| |
|
Gene: ITGA5 |
Gene summary for ITGA5 |
| Gene information | Species | Human | Gene symbol | ITGA5 | Gene ID | 3678 |
| Gene name | integrin subunit alpha 5 | |
| Gene Alias | CD49e | |
| Cytomap | 12q13.13 | |
| Gene Type | protein-coding | GO ID | GO:0001525 | UniProtAcc | B2R627 |
Top |
Malignant transformation analysis |
| Identification of the aberrant gene expression in precancerous and cancerous lesions by comparing the gene expression of stem-like cells in diseased tissues with normal stem cells |
| Entrez ID | Symbol | Replicates | Species | Organ | Tissue | Adj P-value | Log2FC | Malignancy |
| 3678 | ITGA5 | LZE4T | Human | Esophagus | ESCC | 4.45e-05 | 3.84e-01 | 0.0811 |
| 3678 | ITGA5 | LZE24T | Human | Esophagus | ESCC | 9.35e-04 | 1.95e-01 | 0.0596 |
| 3678 | ITGA5 | LZE6T | Human | Esophagus | ESCC | 8.11e-09 | 5.24e-01 | 0.0845 |
| 3678 | ITGA5 | P2T-E | Human | Esophagus | ESCC | 8.43e-08 | 2.18e-01 | 0.1177 |
| 3678 | ITGA5 | P4T-E | Human | Esophagus | ESCC | 2.15e-13 | 4.61e-01 | 0.1323 |
| 3678 | ITGA5 | P5T-E | Human | Esophagus | ESCC | 2.28e-63 | 1.36e+00 | 0.1327 |
| 3678 | ITGA5 | P9T-E | Human | Esophagus | ESCC | 1.54e-03 | 3.43e-01 | 0.1131 |
| 3678 | ITGA5 | P11T-E | Human | Esophagus | ESCC | 6.51e-12 | 6.86e-01 | 0.1426 |
| 3678 | ITGA5 | P15T-E | Human | Esophagus | ESCC | 9.33e-09 | 3.94e-01 | 0.1149 |
| 3678 | ITGA5 | P17T-E | Human | Esophagus | ESCC | 1.84e-07 | 6.03e-01 | 0.1278 |
| 3678 | ITGA5 | P19T-E | Human | Esophagus | ESCC | 1.19e-04 | 8.04e-01 | 0.1662 |
| 3678 | ITGA5 | P21T-E | Human | Esophagus | ESCC | 9.51e-13 | 5.03e-01 | 0.1617 |
| 3678 | ITGA5 | P22T-E | Human | Esophagus | ESCC | 5.11e-05 | 1.91e-01 | 0.1236 |
| 3678 | ITGA5 | P23T-E | Human | Esophagus | ESCC | 7.43e-07 | 4.95e-01 | 0.108 |
| 3678 | ITGA5 | P24T-E | Human | Esophagus | ESCC | 1.62e-11 | 4.37e-01 | 0.1287 |
| 3678 | ITGA5 | P26T-E | Human | Esophagus | ESCC | 2.34e-26 | 7.29e-01 | 0.1276 |
| 3678 | ITGA5 | P28T-E | Human | Esophagus | ESCC | 2.01e-08 | 3.60e-01 | 0.1149 |
| 3678 | ITGA5 | P31T-E | Human | Esophagus | ESCC | 1.95e-06 | 2.56e-01 | 0.1251 |
| 3678 | ITGA5 | P32T-E | Human | Esophagus | ESCC | 5.37e-39 | 1.03e+00 | 0.1666 |
| 3678 | ITGA5 | P36T-E | Human | Esophagus | ESCC | 1.06e-22 | 1.05e+00 | 0.1187 |
| Page: 1 2 3 4 |
| Tissue | Expression Dynamics | Abbreviation |
| Esophagus | 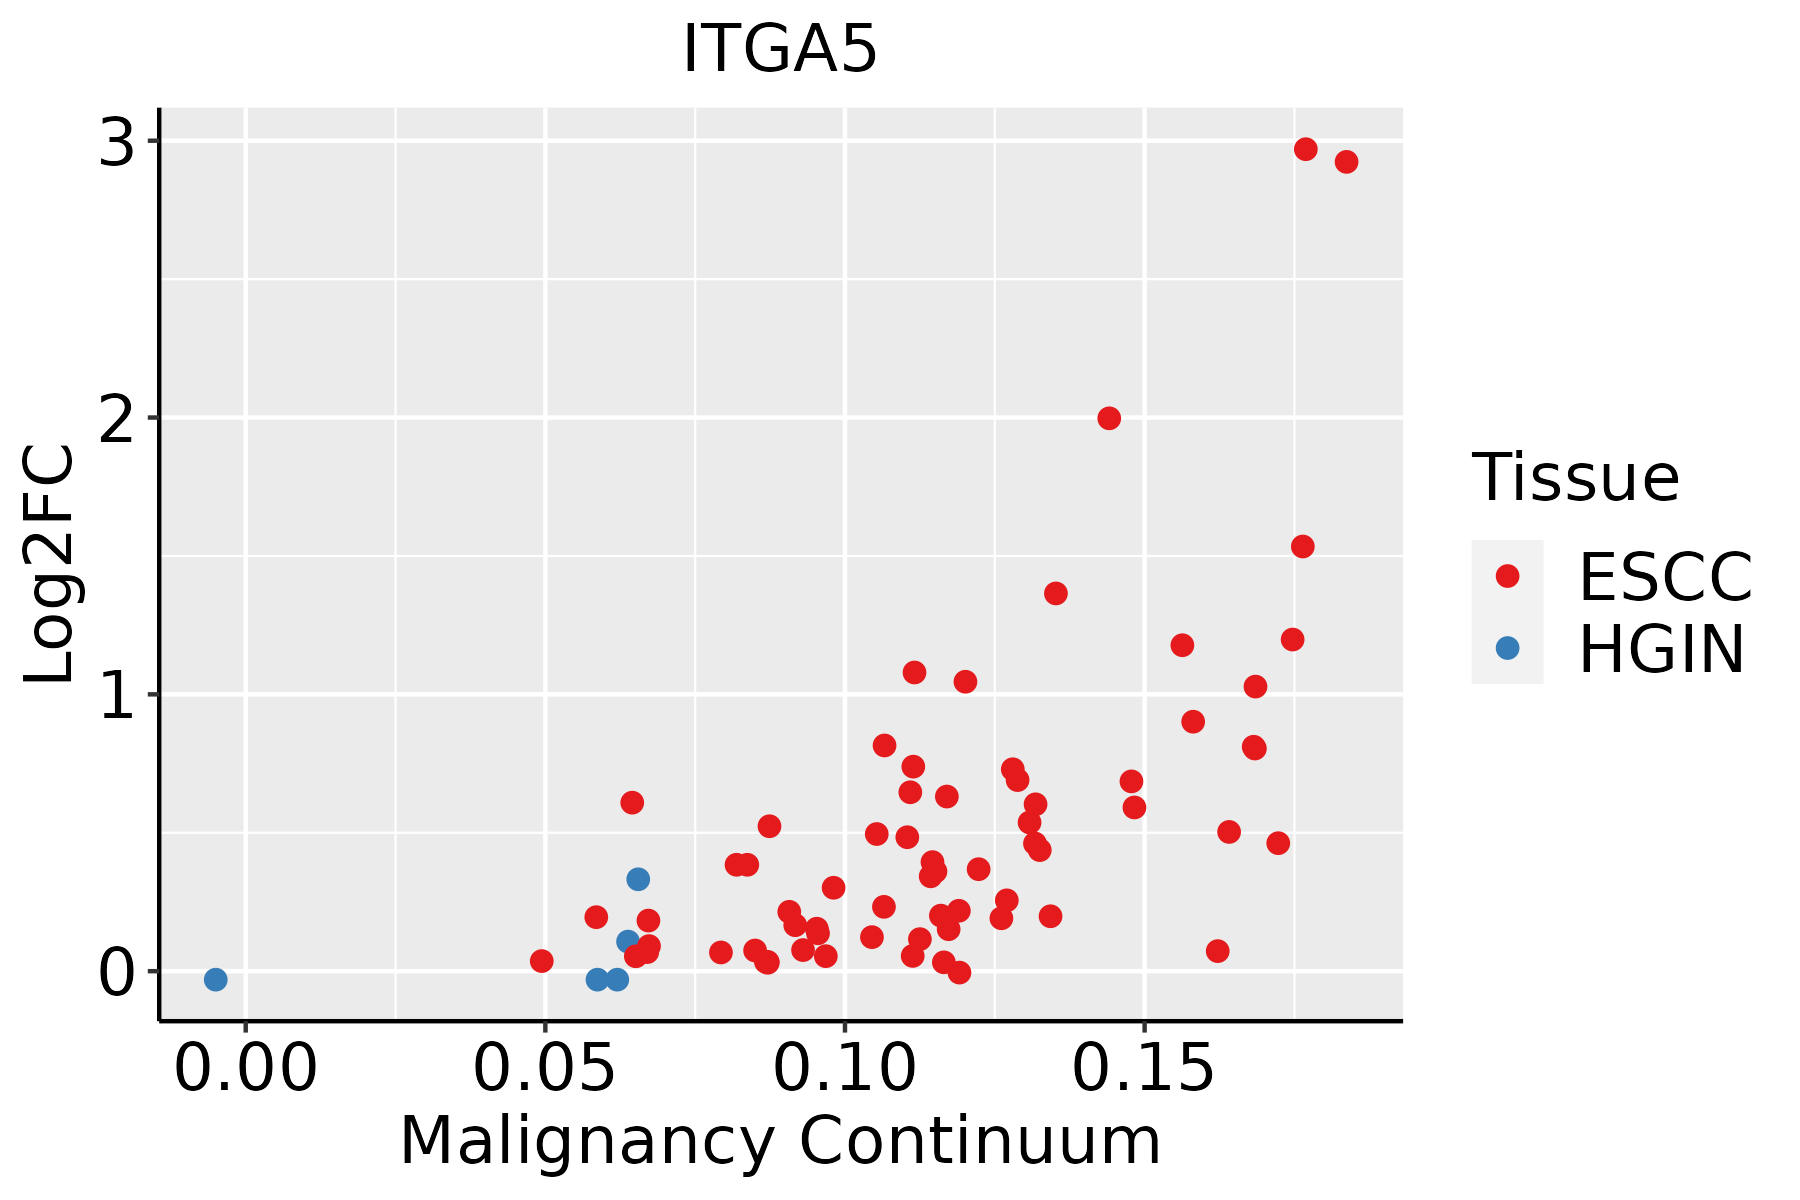 | ESCC: Esophageal squamous cell carcinoma |
| HGIN: High-grade intraepithelial neoplasias | ||
| LGIN: Low-grade intraepithelial neoplasias | ||
| Liver | 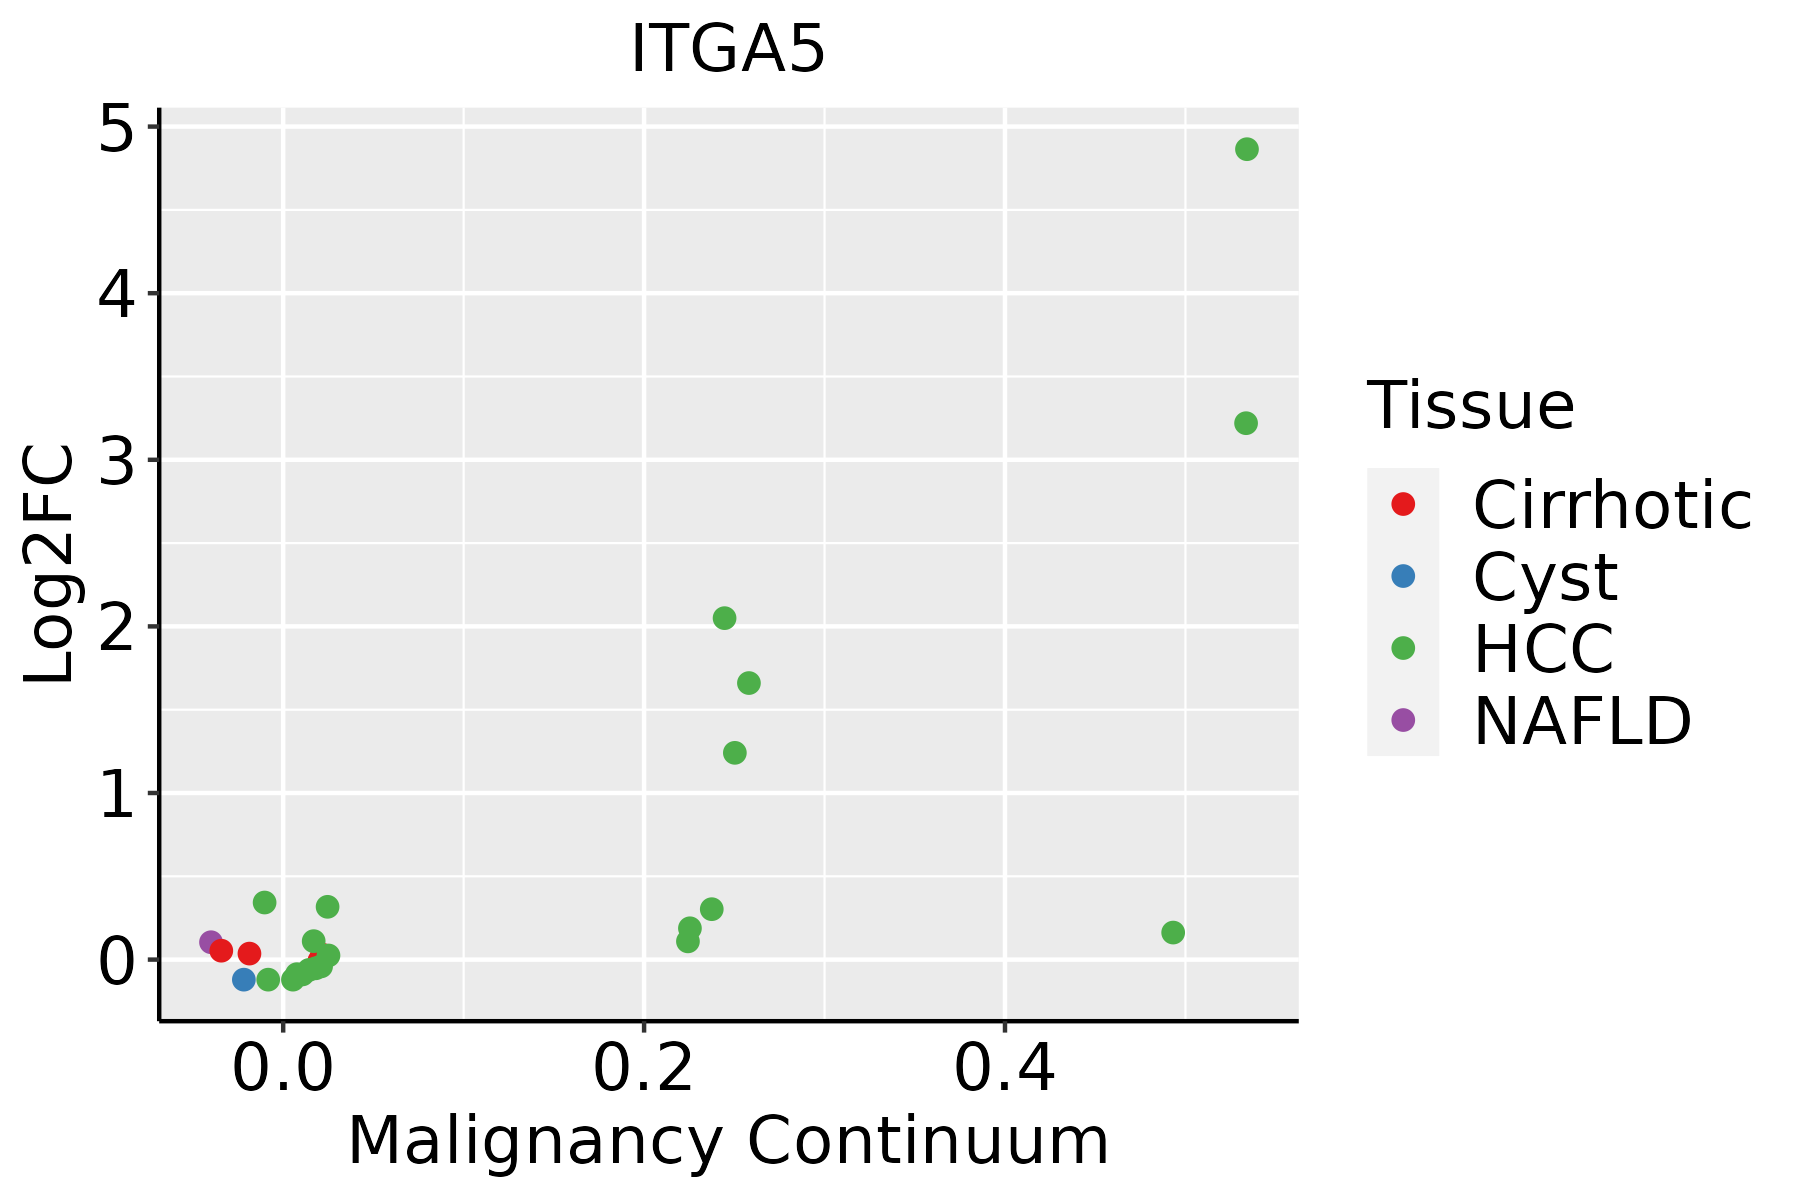 | HCC: Hepatocellular carcinoma |
| NAFLD: Non-alcoholic fatty liver disease | ||
| Oral Cavity |  | EOLP: Erosive Oral lichen planus |
| LP: leukoplakia | ||
| NEOLP: Non-erosive oral lichen planus | ||
| OSCC: Oral squamous cell carcinoma | ||
| Thyroid | 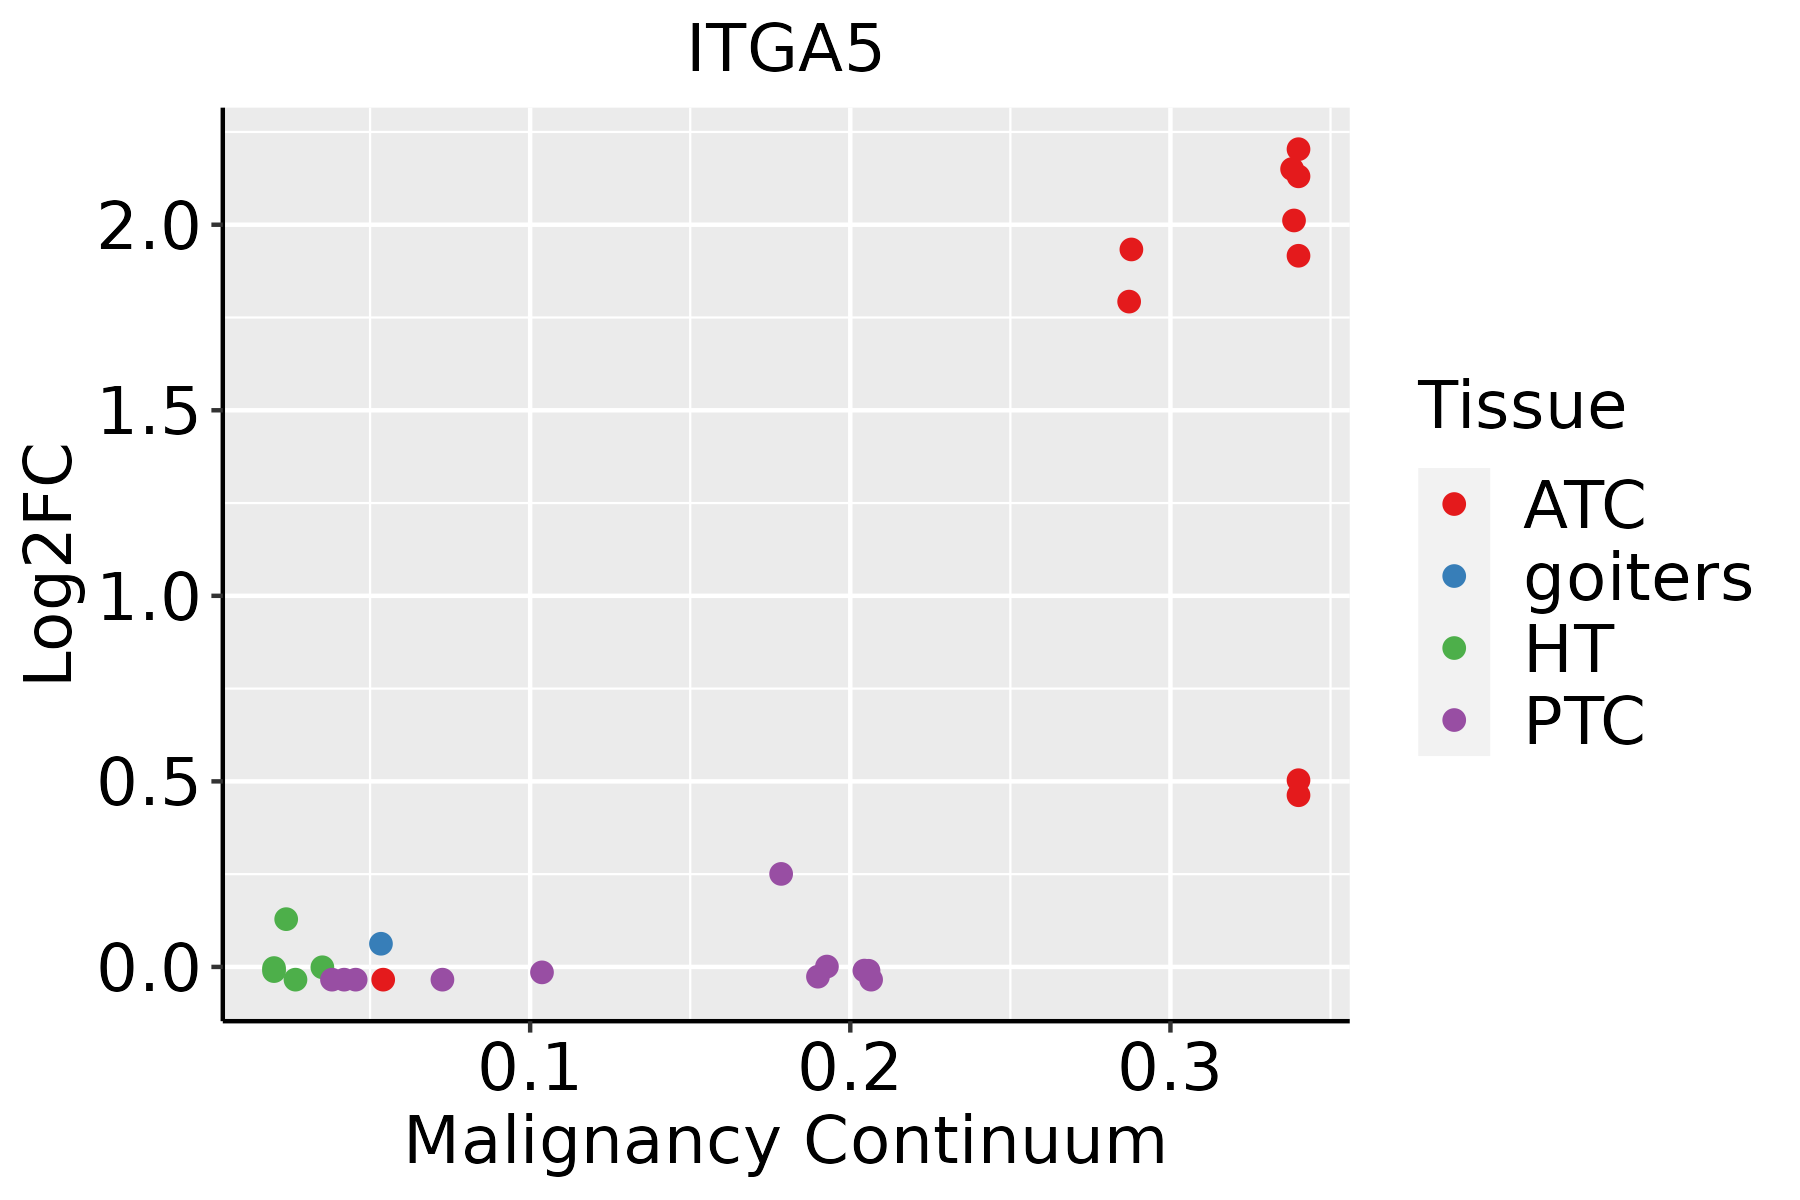 | ATC: Anaplastic thyroid cancer |
| HT: Hashimoto's thyroiditis | ||
| PTC: Papillary thyroid cancer |
| ∗log2FC in expression of this searched gene in stem-like cells from each diseased tissue sample relative to stem-like cells in normal samples in each tissue plotted against the malignancy continuum. Samples are colored based on if they are from different disease stage. |
Top |
Malignant transformation related pathway analysis |
| Find out the enriched GO biological processes and KEGG pathways involved in transition from healthy to precancer to cancer |
| Tissue | Disease Stage | Enriched GO biological Processes |
| Colorectum | AD |  |
| Colorectum | SER |  |
| Colorectum | MSS |  |
| Colorectum | MSI-H |  |
| Colorectum | FAP |  |
| ∗Top 15 enriched GO BP terms are showed in the bar plot of each disease state in each tissue. Each row represents a significant GO biological process which is colored according to the -log10(p.adjust). |
| Page: 1 2 3 4 5 6 7 8 9 |
| GO ID | Tissue | Disease Stage | Description | Gene Ratio | Bg Ratio | pvalue | p.adjust | Count |
| GO:00905047 | Esophagus | ESCC | epiboly | 26/8552 | 35/18723 | 5.57e-04 | 3.04e-03 | 26 |
| GO:00182124 | Esophagus | ESCC | peptidyl-tyrosine modification | 202/8552 | 378/18723 | 1.34e-03 | 6.39e-03 | 202 |
| GO:00181084 | Esophagus | ESCC | peptidyl-tyrosine phosphorylation | 200/8552 | 375/18723 | 1.60e-03 | 7.45e-03 | 200 |
| GO:20008113 | Esophagus | ESCC | negative regulation of anoikis | 14/8552 | 17/18723 | 2.22e-03 | 9.78e-03 | 14 |
| GO:00507303 | Esophagus | ESCC | regulation of peptidyl-tyrosine phosphorylation | 144/8552 | 264/18723 | 2.22e-03 | 9.78e-03 | 144 |
| GO:00336275 | Esophagus | ESCC | cell adhesion mediated by integrin | 45/8552 | 72/18723 | 2.97e-03 | 1.24e-02 | 45 |
| GO:00353132 | Esophagus | ESCC | wound healing, spreading of epidermal cells | 14/8552 | 19/18723 | 1.27e-02 | 4.21e-02 | 14 |
| GO:00341135 | Esophagus | ESCC | heterotypic cell-cell adhesion | 37/8552 | 61/18723 | 1.32e-02 | 4.31e-02 | 37 |
| GO:001603212 | Liver | Cirrhotic | viral process | 203/4634 | 415/18723 | 5.40e-27 | 3.76e-24 | 203 |
| GO:001905812 | Liver | Cirrhotic | viral life cycle | 148/4634 | 317/18723 | 1.12e-17 | 1.64e-15 | 148 |
| GO:004440312 | Liver | Cirrhotic | biological process involved in symbiotic interaction | 131/4634 | 290/18723 | 2.00e-14 | 1.84e-12 | 131 |
| GO:005170112 | Liver | Cirrhotic | biological process involved in interaction with host | 88/4634 | 203/18723 | 4.55e-09 | 1.82e-07 | 88 |
| GO:004206012 | Liver | Cirrhotic | wound healing | 155/4634 | 422/18723 | 2.12e-08 | 7.56e-07 | 155 |
| GO:00521267 | Liver | Cirrhotic | movement in host environment | 75/4634 | 175/18723 | 1.08e-07 | 3.07e-06 | 75 |
| GO:003158912 | Liver | Cirrhotic | cell-substrate adhesion | 128/4634 | 363/18723 | 4.10e-06 | 6.90e-05 | 128 |
| GO:000722911 | Liver | Cirrhotic | integrin-mediated signaling pathway | 46/4634 | 107/18723 | 2.66e-05 | 3.42e-04 | 46 |
| GO:00444097 | Liver | Cirrhotic | entry into host | 58/4634 | 151/18723 | 1.33e-04 | 1.30e-03 | 58 |
| GO:00467187 | Liver | Cirrhotic | viral entry into host cell | 55/4634 | 144/18723 | 2.31e-04 | 2.11e-03 | 55 |
| GO:00341132 | Liver | Cirrhotic | heterotypic cell-cell adhesion | 25/4634 | 61/18723 | 3.80e-03 | 2.08e-02 | 25 |
| GO:0007492 | Liver | Cirrhotic | endoderm development | 29/4634 | 77/18723 | 8.02e-03 | 3.76e-02 | 29 |
| Page: 1 2 3 4 5 6 7 8 |
| Pathway ID | Tissue | Disease Stage | Description | Gene Ratio | Bg Ratio | pvalue | p.adjust | qvalue | Count |
| hsa05131211 | Esophagus | ESCC | Shigellosis | 176/4205 | 247/8465 | 2.27e-12 | 4.01e-11 | 2.05e-11 | 176 |
| hsa0516510 | Esophagus | ESCC | Human papillomavirus infection | 215/4205 | 331/8465 | 7.86e-09 | 7.12e-08 | 3.65e-08 | 215 |
| hsa0513526 | Esophagus | ESCC | Yersinia infection | 100/4205 | 137/8465 | 1.80e-08 | 1.59e-07 | 8.12e-08 | 100 |
| hsa0520529 | Esophagus | ESCC | Proteoglycans in cancer | 138/4205 | 205/8465 | 1.79e-07 | 1.40e-06 | 7.15e-07 | 138 |
| hsa05100211 | Esophagus | ESCC | Bacterial invasion of epithelial cells | 59/4205 | 77/8465 | 1.05e-06 | 6.76e-06 | 3.46e-06 | 59 |
| hsa0414530 | Esophagus | ESCC | Phagosome | 100/4205 | 152/8465 | 3.81e-05 | 1.72e-04 | 8.82e-05 | 100 |
| hsa0451020 | Esophagus | ESCC | Focal adhesion | 127/4205 | 203/8465 | 1.25e-04 | 4.99e-04 | 2.56e-04 | 127 |
| hsa0481028 | Esophagus | ESCC | Regulation of actin cytoskeleton | 133/4205 | 229/8465 | 5.94e-03 | 1.48e-02 | 7.56e-03 | 133 |
| hsa051339 | Esophagus | ESCC | Pertussis | 48/4205 | 76/8465 | 1.21e-02 | 2.77e-02 | 1.42e-02 | 48 |
| hsa041517 | Esophagus | ESCC | PI3K-Akt signaling pathway | 197/4205 | 354/8465 | 1.24e-02 | 2.83e-02 | 1.45e-02 | 197 |
| hsa05131310 | Esophagus | ESCC | Shigellosis | 176/4205 | 247/8465 | 2.27e-12 | 4.01e-11 | 2.05e-11 | 176 |
| hsa0516515 | Esophagus | ESCC | Human papillomavirus infection | 215/4205 | 331/8465 | 7.86e-09 | 7.12e-08 | 3.65e-08 | 215 |
| hsa05135111 | Esophagus | ESCC | Yersinia infection | 100/4205 | 137/8465 | 1.80e-08 | 1.59e-07 | 8.12e-08 | 100 |
| hsa0520537 | Esophagus | ESCC | Proteoglycans in cancer | 138/4205 | 205/8465 | 1.79e-07 | 1.40e-06 | 7.15e-07 | 138 |
| hsa05100310 | Esophagus | ESCC | Bacterial invasion of epithelial cells | 59/4205 | 77/8465 | 1.05e-06 | 6.76e-06 | 3.46e-06 | 59 |
| hsa04145114 | Esophagus | ESCC | Phagosome | 100/4205 | 152/8465 | 3.81e-05 | 1.72e-04 | 8.82e-05 | 100 |
| hsa04510111 | Esophagus | ESCC | Focal adhesion | 127/4205 | 203/8465 | 1.25e-04 | 4.99e-04 | 2.56e-04 | 127 |
| hsa04810112 | Esophagus | ESCC | Regulation of actin cytoskeleton | 133/4205 | 229/8465 | 5.94e-03 | 1.48e-02 | 7.56e-03 | 133 |
| hsa0513314 | Esophagus | ESCC | Pertussis | 48/4205 | 76/8465 | 1.21e-02 | 2.77e-02 | 1.42e-02 | 48 |
| hsa0415114 | Esophagus | ESCC | PI3K-Akt signaling pathway | 197/4205 | 354/8465 | 1.24e-02 | 2.83e-02 | 1.45e-02 | 197 |
| Page: 1 2 3 4 5 6 |
Top |
Cell-cell communication analysis |
| Identification of potential cell-cell interactions between two cell types and their ligand-receptor pairs for different disease states |
| Ligand | Receptor | LRpair | Pathway | Tissue | Disease Stage |
| NAMPT | ITGA5_ITGB1 | NAMPT_ITGA5_ITGB1 | VISFATIN | Breast | ADJ |
| ANGPT2 | ITGA5_ITGB1 | ANGPT2_ITGA5_ITGB1 | ANGPT | Breast | ADJ |
| ANGPTL2 | ITGA5_ITGB1 | ANGPTL2_ITGA5_ITGB1 | ANGPTL | Breast | ADJ |
| ANGPTL4 | ITGA5_ITGB1 | ANGPTL4_ITGA5_ITGB1 | ANGPTL | Breast | ADJ |
| FN1 | ITGA5_ITGB1 | FN1_ITGA5_ITGB1 | FN1 | Breast | ADJ |
| SPP1 | ITGA5_ITGB1 | SPP1_ITGA5_ITGB1 | SPP1 | Breast | DCIS |
| FN1 | ITGA5_ITGB1 | FN1_ITGA5_ITGB1 | FN1 | Breast | DCIS |
| NAMPT | ITGA5_ITGB1 | NAMPT_ITGA5_ITGB1 | VISFATIN | Breast | DCIS |
| ANGPTL2 | ITGA5_ITGB1 | ANGPTL2_ITGA5_ITGB1 | ANGPTL | Breast | DCIS |
| ANGPTL4 | ITGA5_ITGB1 | ANGPTL4_ITGA5_ITGB1 | ANGPTL | Breast | DCIS |
| CD40LG | ITGA5_ITGB1 | CD40LG_ITGA5_ITGB1 | CD40 | Breast | DCIS |
| ANGPT2 | ITGA5_ITGB1 | ANGPT2_ITGA5_ITGB1 | ANGPT | Breast | DCIS |
| NAMPT | ITGA5_ITGB1 | NAMPT_ITGA5_ITGB1 | VISFATIN | Breast | Healthy |
| ANGPT2 | ITGA5_ITGB1 | ANGPT2_ITGA5_ITGB1 | ANGPT | Breast | Healthy |
| FN1 | ITGA5_ITGB1 | FN1_ITGA5_ITGB1 | FN1 | Breast | Healthy |
| ANGPTL2 | ITGA5_ITGB1 | ANGPTL2_ITGA5_ITGB1 | ANGPTL | Breast | Healthy |
| ANGPTL4 | ITGA5_ITGB1 | ANGPTL4_ITGA5_ITGB1 | ANGPTL | Breast | Healthy |
| CD40LG | ITGA5_ITGB1 | CD40LG_ITGA5_ITGB1 | CD40 | Breast | Healthy |
| FN1 | ITGA5_ITGB1 | FN1_ITGA5_ITGB1 | FN1 | Breast | IDC |
| NAMPT | ITGA5_ITGB1 | NAMPT_ITGA5_ITGB1 | VISFATIN | Breast | IDC |
| Page: 1 |
Top |
Single-cell gene regulatory network inference analysis |
| Find out the significant the regulons (TFs) and the target genes of each regulon across cell types for different disease states |
| TF | Cell Type | Tissue | Disease Stage | Target Gene | RSS | Regulon Activity |
| ∗The dot plots of a searched regulon are shown for all cell subpopulations in each disease state of each tissue based on the regulon specific score inferred using pySCENIC and by calculating the average expression. |
| Page: 1 |
Top |
Somatic mutation of malignant transformation related genes |
| Annotation of somatic variants for genes involved in malignant transformation |
| Hugo Symbol | Variant Class | Variant Classification | dbSNP RS | HGVSc | HGVSp | HGVSp Short | SWISSPROT | BIOTYPE | SIFT | PolyPhen | Tumor Sample Barcode | Tissue | Histology | Sex | Age | Stage | Therapy Types | Drugs | Outcome |
| ITGA5 | SNV | Missense_Mutation | rs767288282 | c.2588N>C | p.Arg863Thr | p.R863T | P08648 | protein_coding | tolerated(0.34) | benign(0.079) | TCGA-AC-A23H-01 | Breast | breast invasive carcinoma | Female | >=65 | I/II | Unknown | Unknown | PD |
| ITGA5 | SNV | Missense_Mutation | novel | c.1393N>T | p.Asp465Tyr | p.D465Y | P08648 | protein_coding | deleterious(0) | probably_damaging(1) | TCGA-AN-A046-01 | Breast | breast invasive carcinoma | Female | >=65 | I/II | Unknown | Unknown | SD |
| ITGA5 | SNV | Missense_Mutation | c.376N>C | p.Ser126Pro | p.S126P | P08648 | protein_coding | tolerated(0.14) | benign(0.333) | TCGA-AR-A24H-01 | Breast | breast invasive carcinoma | Female | >=65 | I/II | Hormone Therapy | tamoxiphen | SD | |
| ITGA5 | SNV | Missense_Mutation | rs762335174 | c.1003N>A | p.Val335Ile | p.V335I | P08648 | protein_coding | tolerated(1) | benign(0.003) | TCGA-C8-A12W-01 | Breast | breast invasive carcinoma | Female | <65 | III/IV | Unknown | Unknown | SD |
| ITGA5 | SNV | Missense_Mutation | novel | c.2180N>A | p.Arg727His | p.R727H | P08648 | protein_coding | deleterious(0.01) | probably_damaging(0.986) | TCGA-2W-A8YY-01 | Cervix | cervical & endocervical cancer | Female | <65 | I/II | Chemotherapy | cisplatin | CR |
| ITGA5 | SNV | Missense_Mutation | novel | c.2755N>A | p.Leu919Met | p.L919M | P08648 | protein_coding | deleterious(0.02) | probably_damaging(0.995) | TCGA-C5-A2M1-01 | Cervix | cervical & endocervical cancer | Female | <65 | I/II | Unknown | Unknown | SD |
| ITGA5 | SNV | Missense_Mutation | novel | c.1453N>C | p.Val485Leu | p.V485L | P08648 | protein_coding | tolerated(0.06) | benign(0.014) | TCGA-DS-A1OC-01 | Cervix | cervical & endocervical cancer | Female | <65 | I/II | Chemotherapy | gemcitabine | SD |
| ITGA5 | SNV | Missense_Mutation | novel | c.355N>T | p.Arg119Trp | p.R119W | P08648 | protein_coding | deleterious(0) | probably_damaging(0.996) | TCGA-AA-3872-01 | Colorectum | colon adenocarcinoma | Male | <65 | III/IV | Unknown | Unknown | SD |
| ITGA5 | SNV | Missense_Mutation | novel | c.217N>A | p.Gly73Arg | p.G73R | P08648 | protein_coding | tolerated(0.39) | benign(0.02) | TCGA-AA-3877-01 | Colorectum | colon adenocarcinoma | Female | >=65 | I/II | Unknown | Unknown | SD |
| ITGA5 | SNV | Missense_Mutation | c.1099N>T | p.Val367Phe | p.V367F | P08648 | protein_coding | deleterious(0) | possibly_damaging(0.633) | TCGA-AA-3930-01 | Colorectum | colon adenocarcinoma | Male | >=65 | III/IV | Chemotherapy | capecitabine | PD |
| Page: 1 2 3 4 5 6 7 8 9 |
Top |
Related drugs of malignant transformation related genes |
| Identification of chemicals and drugs interact with genes involved in malignant transfromation |
| (DGIdb 4.0) |
| Entrez ID | Symbol | Category | Interaction Types | Drug Claim Name | Drug Name | PMIDs |
| 3678 | ITGA5 | DRUGGABLE GENOME, EXTERNAL SIDE OF PLASMA MEMBRANE, CELL SURFACE | antagonist | CHEMBL2108061 | VOLOCIXIMAB | |
| 3678 | ITGA5 | DRUGGABLE GENOME, EXTERNAL SIDE OF PLASMA MEMBRANE, CELL SURFACE | F200 | |||
| 3678 | ITGA5 | DRUGGABLE GENOME, EXTERNAL SIDE OF PLASMA MEMBRANE, CELL SURFACE | antibody | PF-04605412 | PF-04605412 | |
| 3678 | ITGA5 | DRUGGABLE GENOME, EXTERNAL SIDE OF PLASMA MEMBRANE, CELL SURFACE | GLPG0187 | GLPG-0187 | ||
| 3678 | ITGA5 | DRUGGABLE GENOME, EXTERNAL SIDE OF PLASMA MEMBRANE, CELL SURFACE | JSM 6427 | |||
| 3678 | ITGA5 | DRUGGABLE GENOME, EXTERNAL SIDE OF PLASMA MEMBRANE, CELL SURFACE | antibody | VITAXIN | ETARACIZUMAB | |
| 3678 | ITGA5 | DRUGGABLE GENOME, EXTERNAL SIDE OF PLASMA MEMBRANE, CELL SURFACE | JSM 6427 | |||
| 3678 | ITGA5 | DRUGGABLE GENOME, EXTERNAL SIDE OF PLASMA MEMBRANE, CELL SURFACE | M-CSF | CILMOSTIM | 11061591 | |
| 3678 | ITGA5 | DRUGGABLE GENOME, EXTERNAL SIDE OF PLASMA MEMBRANE, CELL SURFACE | DMSO | DIMETHYL SULFOXIDE | 9678720 | |
| 3678 | ITGA5 | DRUGGABLE GENOME, EXTERNAL SIDE OF PLASMA MEMBRANE, CELL SURFACE | antibody | VOLOCIXIMAB | VOLOCIXIMAB |
| Page: 1 2 |

Copyright 2023-Present -The University of Texas Health Science Center at Houston |