
|
|||||
|
 | |
| |
| |
| |
| |
| |
|
Gene: IRAK3 |
Gene summary for IRAK3 |
| Gene information | Species | Human | Gene symbol | IRAK3 | Gene ID | 11213 |
| Gene name | interleukin 1 receptor associated kinase 3 | |
| Gene Alias | ASRT5 | |
| Cytomap | 12q14.3 | |
| Gene Type | protein-coding | GO ID | GO:0000165 | UniProtAcc | Q9Y616 |
Top |
Malignant transformation analysis |
| Identification of the aberrant gene expression in precancerous and cancerous lesions by comparing the gene expression of stem-like cells in diseased tissues with normal stem cells |
| Entrez ID | Symbol | Replicates | Species | Organ | Tissue | Adj P-value | Log2FC | Malignancy |
| 11213 | IRAK3 | HTA11_2487_2000001011 | Human | Colorectum | SER | 6.13e-16 | 7.88e-01 | -0.1808 |
| 11213 | IRAK3 | HTA11_2951_2000001011 | Human | Colorectum | AD | 6.30e-03 | 4.13e-01 | 0.0216 |
| 11213 | IRAK3 | HTA11_1938_2000001011 | Human | Colorectum | AD | 1.04e-03 | 2.77e-01 | -0.0811 |
| 11213 | IRAK3 | HTA11_78_2000001011 | Human | Colorectum | AD | 1.19e-07 | 3.39e-01 | -0.1088 |
| 11213 | IRAK3 | HTA11_347_2000001011 | Human | Colorectum | AD | 4.68e-03 | 1.25e-01 | -0.1954 |
| 11213 | IRAK3 | HTA11_3361_2000001011 | Human | Colorectum | AD | 1.69e-26 | 8.21e-01 | -0.1207 |
| 11213 | IRAK3 | HTA11_83_2000001011 | Human | Colorectum | SER | 7.07e-08 | 3.78e-01 | -0.1526 |
| 11213 | IRAK3 | HTA11_696_2000001011 | Human | Colorectum | AD | 1.26e-09 | 3.63e-01 | -0.1464 |
| 11213 | IRAK3 | HTA11_866_2000001011 | Human | Colorectum | AD | 1.64e-11 | 3.03e-01 | -0.1001 |
| 11213 | IRAK3 | HTA11_1391_2000001011 | Human | Colorectum | AD | 7.06e-12 | 4.76e-01 | -0.059 |
| 11213 | IRAK3 | HTA11_99999965062_69753 | Human | Colorectum | MSI-H | 2.31e-03 | 6.70e-01 | 0.3487 |
| 11213 | IRAK3 | AEH-subject4 | Human | Endometrium | AEH | 2.81e-07 | 3.54e-01 | -0.2657 |
| 11213 | IRAK3 | RNA-P3T-P3T-1 | Human | Lung | IAC | 2.55e-10 | 8.39e-01 | 0.1829 |
| 11213 | IRAK3 | RNA-P3T-P3T-2 | Human | Lung | IAC | 6.02e-10 | 7.79e-01 | 0.1835 |
| 11213 | IRAK3 | RNA-P3T-P3T-4 | Human | Lung | IAC | 1.37e-15 | 8.86e-01 | 0.1859 |
| 11213 | IRAK3 | RNA-P6T2-P6T2-1 | Human | Lung | IAC | 2.67e-03 | 2.45e-01 | -0.0166 |
| 11213 | IRAK3 | RNA-P6T2-P6T2-2 | Human | Lung | IAC | 1.09e-05 | 3.19e-01 | -0.0132 |
| 11213 | IRAK3 | RNA-P6T2-P6T2-3 | Human | Lung | IAC | 2.28e-06 | 2.83e-01 | -0.013 |
| 11213 | IRAK3 | RNA-P6T2-P6T2-4 | Human | Lung | IAC | 1.04e-05 | 2.94e-01 | -0.0121 |
| 11213 | IRAK3 | ATC13 | Human | Thyroid | ATC | 3.23e-51 | 8.52e-01 | 0.34 |
| Page: 1 2 |
| Tissue | Expression Dynamics | Abbreviation |
| Colorectum (GSE201348) |  | FAP: Familial adenomatous polyposis |
| CRC: Colorectal cancer | ||
| Colorectum (HTA11) |  | AD: Adenomas |
| SER: Sessile serrated lesions | ||
| MSI-H: Microsatellite-high colorectal cancer | ||
| MSS: Microsatellite stable colorectal cancer | ||
| Endometrium | 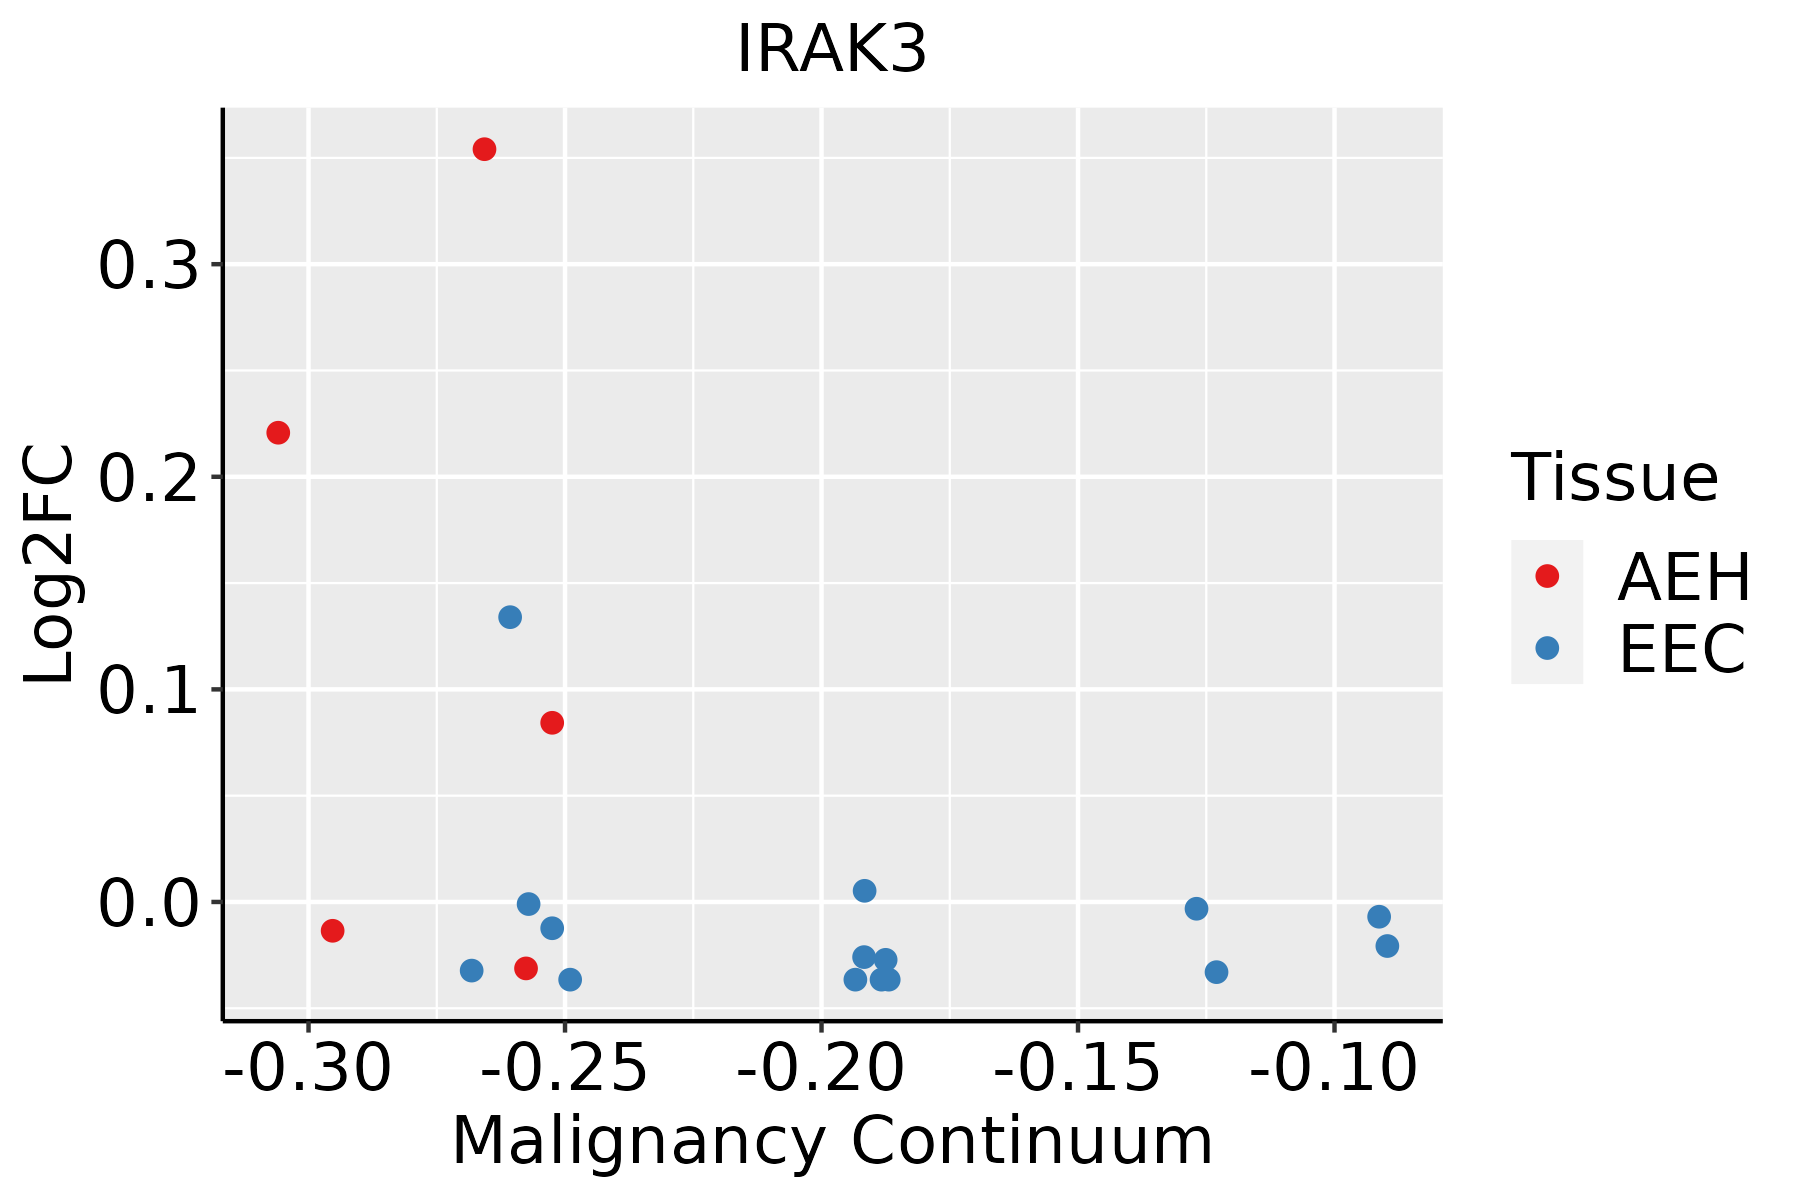 | AEH: Atypical endometrial hyperplasia |
| EEC: Endometrioid Cancer | ||
| Lung | 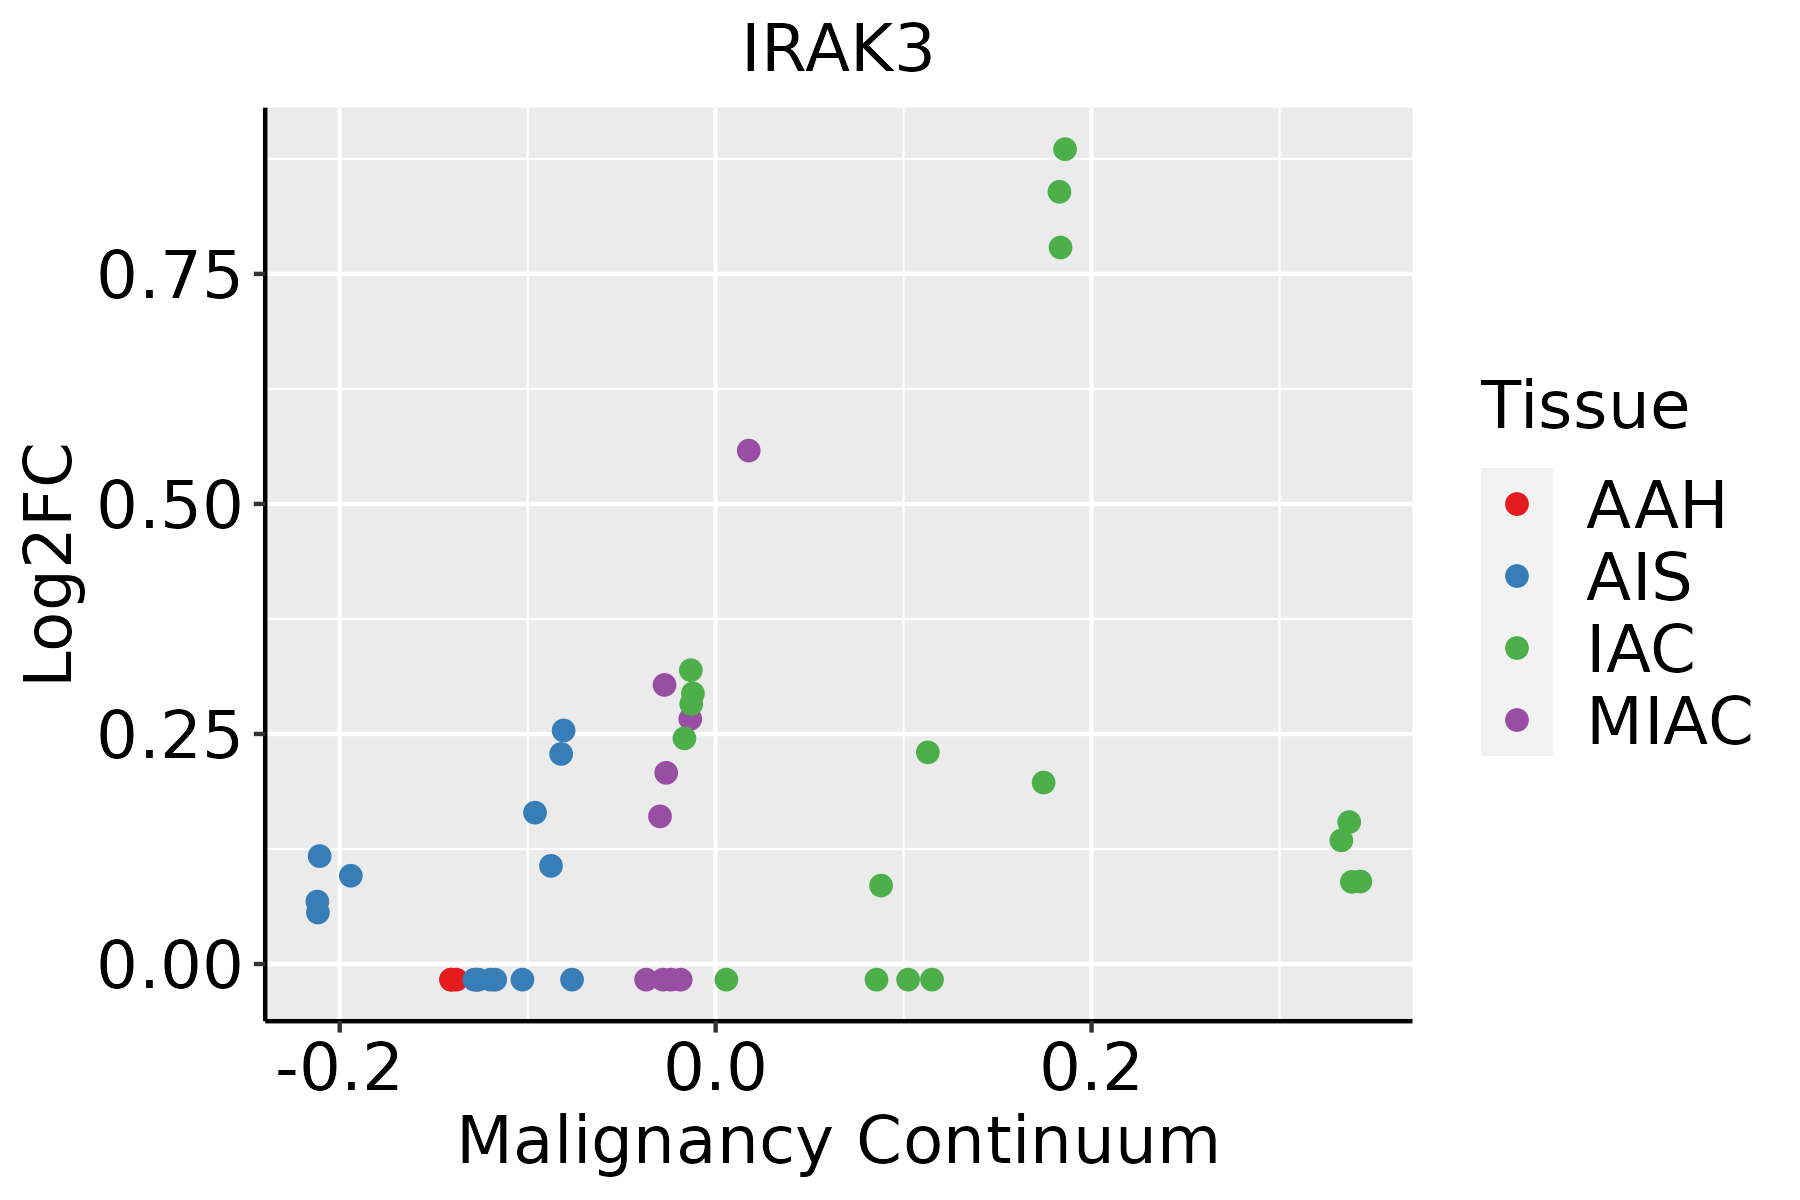 | AAH: Atypical adenomatous hyperplasia |
| AIS: Adenocarcinoma in situ | ||
| IAC: Invasive lung adenocarcinoma | ||
| MIA: Minimally invasive adenocarcinoma | ||
| Thyroid | 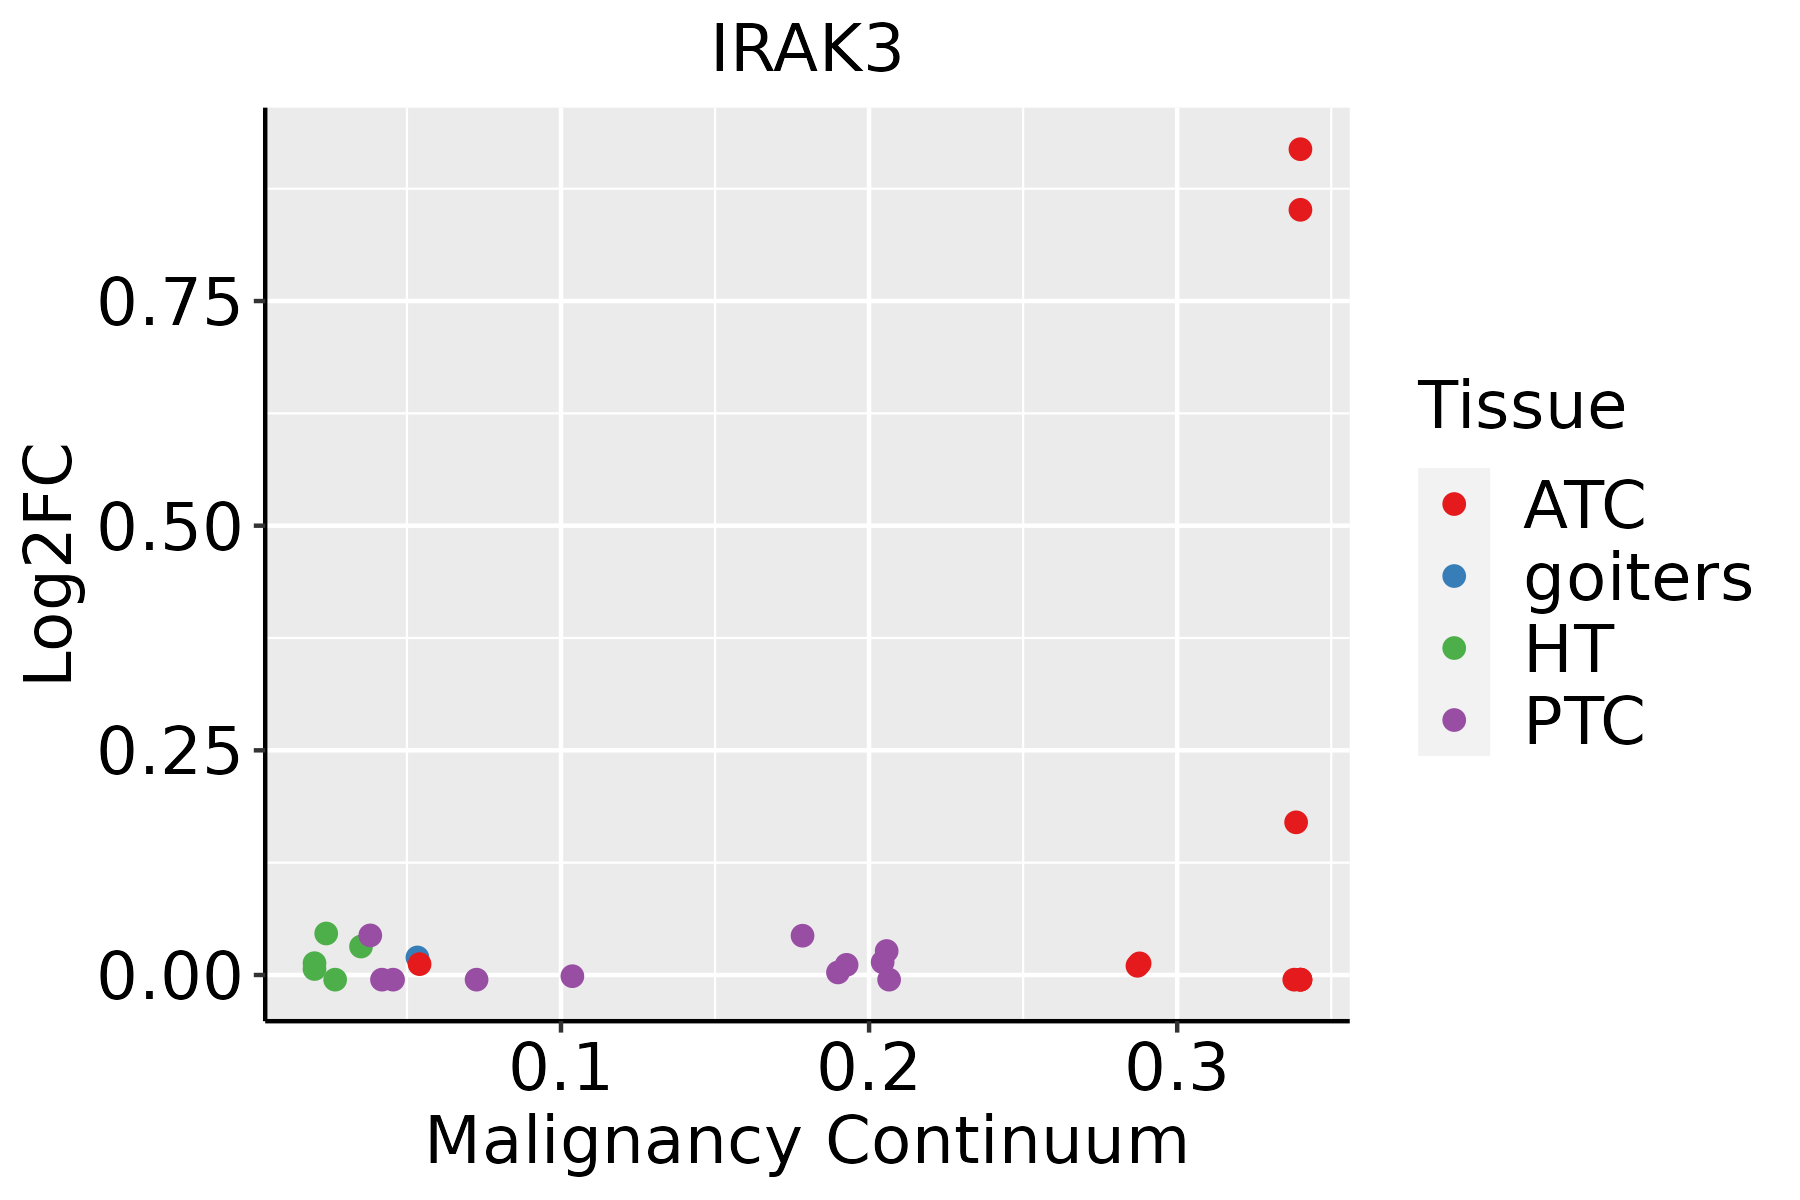 | ATC: Anaplastic thyroid cancer |
| HT: Hashimoto's thyroiditis | ||
| PTC: Papillary thyroid cancer |
| ∗log2FC in expression of this searched gene in stem-like cells from each diseased tissue sample relative to stem-like cells in normal samples in each tissue plotted against the malignancy continuum. Samples are colored based on if they are from different disease stage. |
Top |
Malignant transformation related pathway analysis |
| Find out the enriched GO biological processes and KEGG pathways involved in transition from healthy to precancer to cancer |
| Tissue | Disease Stage | Enriched GO biological Processes |
| Colorectum | AD |  |
| Colorectum | SER |  |
| Colorectum | MSS |  |
| Colorectum | MSI-H |  |
| Colorectum | FAP |  |
| ∗Top 15 enriched GO BP terms are showed in the bar plot of each disease state in each tissue. Each row represents a significant GO biological process which is colored according to the -log10(p.adjust). |
| Page: 1 2 3 4 5 6 7 8 9 |
| GO ID | Tissue | Disease Stage | Description | Gene Ratio | Bg Ratio | pvalue | p.adjust | Count |
| GO:00098951 | Colorectum | SER | negative regulation of catabolic process | 84/2897 | 320/18723 | 3.93e-07 | 2.06e-05 | 84 |
| GO:00329841 | Colorectum | SER | protein-containing complex disassembly | 61/2897 | 224/18723 | 4.17e-06 | 1.60e-04 | 61 |
| GO:00513481 | Colorectum | SER | negative regulation of transferase activity | 70/2897 | 268/18723 | 4.27e-06 | 1.62e-04 | 70 |
| GO:00421771 | Colorectum | SER | negative regulation of protein catabolic process | 38/2897 | 121/18723 | 8.20e-06 | 2.76e-04 | 38 |
| GO:00467771 | Colorectum | SER | protein autophosphorylation | 60/2897 | 227/18723 | 1.36e-05 | 4.25e-04 | 60 |
| GO:00105631 | Colorectum | SER | negative regulation of phosphorus metabolic process | 101/2897 | 442/18723 | 2.39e-05 | 6.70e-04 | 101 |
| GO:00459361 | Colorectum | SER | negative regulation of phosphate metabolic process | 100/2897 | 441/18723 | 3.62e-05 | 9.39e-04 | 100 |
| GO:00019331 | Colorectum | SER | negative regulation of protein phosphorylation | 79/2897 | 342/18723 | 1.21e-04 | 2.49e-03 | 79 |
| GO:00423261 | Colorectum | SER | negative regulation of phosphorylation | 86/2897 | 385/18723 | 2.10e-04 | 3.78e-03 | 86 |
| GO:00336731 | Colorectum | SER | negative regulation of kinase activity | 57/2897 | 237/18723 | 3.48e-04 | 5.46e-03 | 57 |
| GO:00064691 | Colorectum | SER | negative regulation of protein kinase activity | 52/2897 | 212/18723 | 3.75e-04 | 5.74e-03 | 52 |
| GO:00434091 | Colorectum | SER | negative regulation of MAPK cascade | 45/2897 | 180/18723 | 5.81e-04 | 7.98e-03 | 45 |
| GO:00432441 | Colorectum | SER | regulation of protein-containing complex disassembly | 30/2897 | 121/18723 | 5.03e-03 | 3.88e-02 | 30 |
| GO:00719001 | Colorectum | SER | regulation of protein serine/threonine kinase activity | 74/2897 | 359/18723 | 5.22e-03 | 3.96e-02 | 74 |
| GO:00510911 | Colorectum | SER | positive regulation of DNA-binding transcription factor activity | 56/2897 | 260/18723 | 5.55e-03 | 4.09e-02 | 56 |
| GO:00421763 | Colorectum | MSI-H | regulation of protein catabolic process | 65/1319 | 391/18723 | 6.96e-11 | 1.29e-08 | 65 |
| GO:00098953 | Colorectum | MSI-H | negative regulation of catabolic process | 46/1319 | 320/18723 | 3.00e-06 | 1.68e-04 | 46 |
| GO:00421773 | Colorectum | MSI-H | negative regulation of protein catabolic process | 23/1319 | 121/18723 | 1.08e-05 | 5.00e-04 | 23 |
| GO:00513483 | Colorectum | MSI-H | negative regulation of transferase activity | 38/1319 | 268/18723 | 2.89e-05 | 1.17e-03 | 38 |
| GO:00459363 | Colorectum | MSI-H | negative regulation of phosphate metabolic process | 53/1319 | 441/18723 | 9.54e-05 | 3.01e-03 | 53 |
| Page: 1 2 3 4 5 6 7 |
| Pathway ID | Tissue | Disease Stage | Description | Gene Ratio | Bg Ratio | pvalue | p.adjust | qvalue | Count |
| hsa04722 | Colorectum | AD | Neurotrophin signaling pathway | 50/2092 | 119/8465 | 2.28e-05 | 2.24e-04 | 1.43e-04 | 50 |
| hsa047221 | Colorectum | AD | Neurotrophin signaling pathway | 50/2092 | 119/8465 | 2.28e-05 | 2.24e-04 | 1.43e-04 | 50 |
| hsa047222 | Colorectum | SER | Neurotrophin signaling pathway | 35/1580 | 119/8465 | 2.80e-03 | 2.02e-02 | 1.47e-02 | 35 |
| hsa047223 | Colorectum | SER | Neurotrophin signaling pathway | 35/1580 | 119/8465 | 2.80e-03 | 2.02e-02 | 1.47e-02 | 35 |
| hsa0472216 | Endometrium | AEH | Neurotrophin signaling pathway | 31/1197 | 119/8465 | 4.07e-04 | 3.07e-03 | 2.25e-03 | 31 |
| hsa0472217 | Endometrium | AEH | Neurotrophin signaling pathway | 31/1197 | 119/8465 | 4.07e-04 | 3.07e-03 | 2.25e-03 | 31 |
| hsa0472212 | Lung | IAC | Neurotrophin signaling pathway | 29/1053 | 119/8465 | 2.34e-04 | 2.54e-03 | 1.68e-03 | 29 |
| hsa0472213 | Lung | IAC | Neurotrophin signaling pathway | 29/1053 | 119/8465 | 2.34e-04 | 2.54e-03 | 1.68e-03 | 29 |
| Page: 1 |
Top |
Cell-cell communication analysis |
| Identification of potential cell-cell interactions between two cell types and their ligand-receptor pairs for different disease states |
| Ligand | Receptor | LRpair | Pathway | Tissue | Disease Stage |
| Page: 1 |
Top |
Single-cell gene regulatory network inference analysis |
| Find out the significant the regulons (TFs) and the target genes of each regulon across cell types for different disease states |
| TF | Cell Type | Tissue | Disease Stage | Target Gene | RSS | Regulon Activity |
| ∗The dot plots of a searched regulon are shown for all cell subpopulations in each disease state of each tissue based on the regulon specific score inferred using pySCENIC and by calculating the average expression. |
| Page: 1 |
Top |
Somatic mutation of malignant transformation related genes |
| Annotation of somatic variants for genes involved in malignant transformation |
| Hugo Symbol | Variant Class | Variant Classification | dbSNP RS | HGVSc | HGVSp | HGVSp Short | SWISSPROT | BIOTYPE | SIFT | PolyPhen | Tumor Sample Barcode | Tissue | Histology | Sex | Age | Stage | Therapy Types | Drugs | Outcome |
| IRAK3 | SNV | Missense_Mutation | c.1312N>A | p.Glu438Lys | p.E438K | Q9Y616 | protein_coding | tolerated(0.09) | probably_damaging(0.941) | TCGA-A2-A0YK-01 | Breast | breast invasive carcinoma | Female | <65 | I/II | Chemotherapy | cytoxan | SD | |
| IRAK3 | SNV | Missense_Mutation | novel | c.1330N>A | p.Glu444Lys | p.E444K | Q9Y616 | protein_coding | deleterious(0.01) | possibly_damaging(0.679) | TCGA-AC-A5XS-01 | Breast | breast invasive carcinoma | Female | >=65 | I/II | Hormone Therapy | femara | SD |
| IRAK3 | SNV | Missense_Mutation | c.1408T>G | p.Phe470Val | p.F470V | Q9Y616 | protein_coding | tolerated(0.05) | possibly_damaging(0.471) | TCGA-E2-A154-01 | Breast | breast invasive carcinoma | Female | >=65 | I/II | Hormone Therapy | arimidex | SD | |
| IRAK3 | SNV | Missense_Mutation | novel | c.521N>T | p.Gly174Val | p.G174V | Q9Y616 | protein_coding | deleterious(0) | probably_damaging(0.996) | TCGA-JL-A3YW-01 | Breast | breast invasive carcinoma | Female | <65 | I/II | Unknown | Unknown | SD |
| IRAK3 | SNV | Missense_Mutation | novel | c.1257N>G | p.Phe419Leu | p.F419L | Q9Y616 | protein_coding | tolerated(1) | benign(0.031) | TCGA-LD-A74U-01 | Breast | breast invasive carcinoma | Female | >=65 | III/IV | Chemotherapy | taxotere | SD |
| IRAK3 | SNV | Missense_Mutation | novel | c.632C>T | p.Ser211Phe | p.S211F | Q9Y616 | protein_coding | deleterious(0) | probably_damaging(0.985) | TCGA-C5-A8XJ-01 | Cervix | cervical & endocervical cancer | Female | >=65 | I/II | Chemotherapy | cisplatin | SD |
| IRAK3 | SNV | Missense_Mutation | c.466N>G | p.Gln156Glu | p.Q156E | Q9Y616 | protein_coding | tolerated(0.47) | benign(0.057) | TCGA-EK-A2RO-01 | Cervix | cervical & endocervical cancer | Female | <65 | I/II | Unknown | Unknown | SD | |
| IRAK3 | SNV | Missense_Mutation | c.1226N>T | p.Pro409Leu | p.P409L | Q9Y616 | protein_coding | tolerated(0.07) | probably_damaging(0.986) | TCGA-Q1-A5R1-01 | Cervix | cervical & endocervical cancer | Female | <65 | I/II | Unknown | Unknown | SD | |
| IRAK3 | deletion | Frame_Shift_Del | c.592delN | p.Met200CysfsTer26 | p.M200Cfs*26 | Q9Y616 | protein_coding | TCGA-EA-A410-01 | Cervix | cervical & endocervical cancer | Female | <65 | I/II | Unknown | Unknown | SD | |||
| IRAK3 | SNV | Missense_Mutation | novel | c.591N>T | p.Glu197Asp | p.E197D | Q9Y616 | protein_coding | tolerated(0.25) | possibly_damaging(0.735) | TCGA-AA-3984-01 | Colorectum | colon adenocarcinoma | Female | <65 | I/II | Unknown | Unknown | SD |
| Page: 1 2 3 4 5 6 7 8 |
Top |
Related drugs of malignant transformation related genes |
| Identification of chemicals and drugs interact with genes involved in malignant transfromation |
| (DGIdb 4.0) |
| Entrez ID | Symbol | Category | Interaction Types | Drug Claim Name | Drug Name | PMIDs |
| 11213 | IRAK3 | SERINE THREONINE KINASE, KINASE, ENZYME, DRUGGABLE GENOME | inhibitor | 249565893 |
| Page: 1 |

Copyright 2023-Present -The University of Texas Health Science Center at Houston |