
|
|||||
|
 | |
| |
| |
| |
| |
| |
|
Gene: ING1 |
Gene summary for ING1 |
| Gene information | Species | Human | Gene symbol | ING1 | Gene ID | 3621 |
| Gene name | inhibitor of growth family member 1 | |
| Gene Alias | p24ING1c | |
| Cytomap | 13q34 | |
| Gene Type | protein-coding | GO ID | GO:0001558 | UniProtAcc | Q9UK53 |
Top |
Malignant transformation analysis |
| Identification of the aberrant gene expression in precancerous and cancerous lesions by comparing the gene expression of stem-like cells in diseased tissues with normal stem cells |
| Entrez ID | Symbol | Replicates | Species | Organ | Tissue | Adj P-value | Log2FC | Malignancy |
| 3621 | ING1 | LZE4T | Human | Esophagus | ESCC | 1.39e-03 | 3.99e-01 | 0.0811 |
| 3621 | ING1 | LZE7T | Human | Esophagus | ESCC | 2.01e-04 | 4.41e-01 | 0.0667 |
| 3621 | ING1 | LZE8T | Human | Esophagus | ESCC | 1.56e-05 | 2.74e-01 | 0.067 |
| 3621 | ING1 | LZE24T | Human | Esophagus | ESCC | 3.81e-05 | 2.31e-01 | 0.0596 |
| 3621 | ING1 | LZE21T | Human | Esophagus | ESCC | 1.42e-03 | 4.79e-01 | 0.0655 |
| 3621 | ING1 | P1T-E | Human | Esophagus | ESCC | 3.58e-11 | 3.62e-01 | 0.0875 |
| 3621 | ING1 | P2T-E | Human | Esophagus | ESCC | 7.07e-24 | 3.67e-01 | 0.1177 |
| 3621 | ING1 | P4T-E | Human | Esophagus | ESCC | 1.04e-18 | 5.45e-01 | 0.1323 |
| 3621 | ING1 | P5T-E | Human | Esophagus | ESCC | 1.07e-05 | 1.92e-01 | 0.1327 |
| 3621 | ING1 | P8T-E | Human | Esophagus | ESCC | 3.50e-24 | 5.32e-01 | 0.0889 |
| 3621 | ING1 | P9T-E | Human | Esophagus | ESCC | 2.13e-11 | 2.35e-01 | 0.1131 |
| 3621 | ING1 | P10T-E | Human | Esophagus | ESCC | 4.12e-19 | 4.23e-01 | 0.116 |
| 3621 | ING1 | P11T-E | Human | Esophagus | ESCC | 7.76e-16 | 9.99e-01 | 0.1426 |
| 3621 | ING1 | P12T-E | Human | Esophagus | ESCC | 3.76e-18 | 5.01e-01 | 0.1122 |
| 3621 | ING1 | P15T-E | Human | Esophagus | ESCC | 1.66e-13 | 3.16e-01 | 0.1149 |
| 3621 | ING1 | P16T-E | Human | Esophagus | ESCC | 1.55e-20 | 2.97e-01 | 0.1153 |
| 3621 | ING1 | P17T-E | Human | Esophagus | ESCC | 4.06e-02 | 4.42e-02 | 0.1278 |
| 3621 | ING1 | P20T-E | Human | Esophagus | ESCC | 3.46e-10 | 2.39e-01 | 0.1124 |
| 3621 | ING1 | P21T-E | Human | Esophagus | ESCC | 1.97e-09 | 1.32e-01 | 0.1617 |
| 3621 | ING1 | P22T-E | Human | Esophagus | ESCC | 8.48e-12 | 2.70e-01 | 0.1236 |
| Page: 1 2 3 4 |
| Tissue | Expression Dynamics | Abbreviation |
| Esophagus |  | ESCC: Esophageal squamous cell carcinoma |
| HGIN: High-grade intraepithelial neoplasias | ||
| LGIN: Low-grade intraepithelial neoplasias | ||
| Oral Cavity | 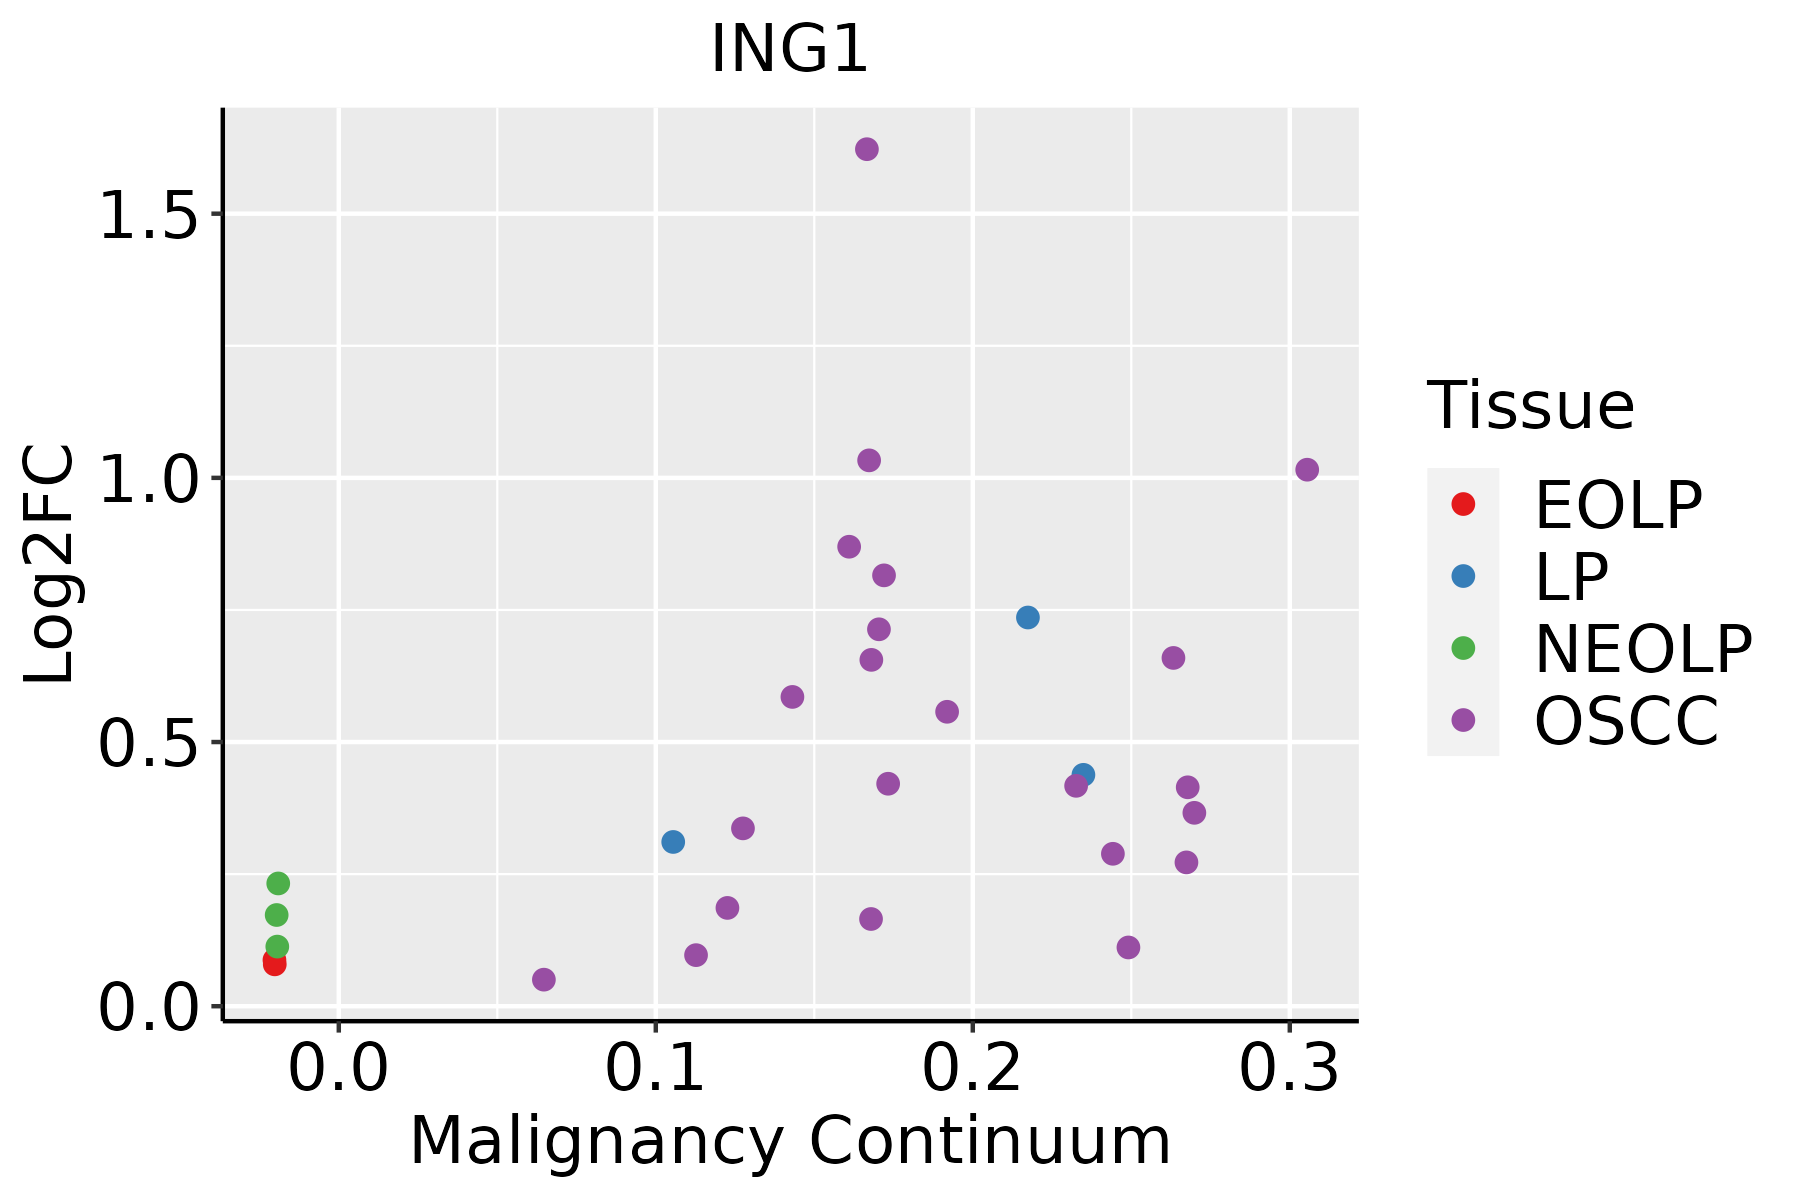 | EOLP: Erosive Oral lichen planus |
| LP: leukoplakia | ||
| NEOLP: Non-erosive oral lichen planus | ||
| OSCC: Oral squamous cell carcinoma |
| ∗log2FC in expression of this searched gene in stem-like cells from each diseased tissue sample relative to stem-like cells in normal samples in each tissue plotted against the malignancy continuum. Samples are colored based on if they are from different disease stage. |
Top |
Malignant transformation related pathway analysis |
| Find out the enriched GO biological processes and KEGG pathways involved in transition from healthy to precancer to cancer |
| Tissue | Disease Stage | Enriched GO biological Processes |
| Colorectum | AD |  |
| Colorectum | SER |  |
| Colorectum | MSS |  |
| Colorectum | MSI-H |  |
| Colorectum | FAP |  |
| ∗Top 15 enriched GO BP terms are showed in the bar plot of each disease state in each tissue. Each row represents a significant GO biological process which is colored according to the -log10(p.adjust). |
| Page: 1 2 3 4 5 6 7 8 9 |
| GO ID | Tissue | Disease Stage | Description | Gene Ratio | Bg Ratio | pvalue | p.adjust | Count |
| GO:00026983 | Cervix | CC | negative regulation of immune effector process | 26/2311 | 110/18723 | 7.40e-04 | 6.63e-03 | 26 |
| GO:00026973 | Cervix | CC | regulation of immune effector process | 62/2311 | 339/18723 | 9.25e-04 | 7.84e-03 | 62 |
| GO:00075996 | Cervix | CC | hemostasis | 44/2311 | 222/18723 | 9.47e-04 | 7.95e-03 | 44 |
| GO:00458243 | Cervix | CC | negative regulation of innate immune response | 18/2311 | 71/18723 | 2.01e-03 | 1.47e-02 | 18 |
| GO:0031348 | Cervix | CC | negative regulation of defense response | 48/2311 | 258/18723 | 2.30e-03 | 1.65e-02 | 48 |
| GO:00024603 | Cervix | CC | adaptive immune response based on somatic recombination of immune receptors built from immunoglobulin superfamily domains | 62/2311 | 356/18723 | 3.09e-03 | 2.03e-02 | 62 |
| GO:0002443 | Cervix | CC | leukocyte mediated immunity | 73/2311 | 440/18723 | 5.01e-03 | 2.98e-02 | 73 |
| GO:00069597 | Cervix | CC | humoral immune response | 54/2311 | 317/18723 | 8.57e-03 | 4.42e-02 | 54 |
| GO:00304492 | Cervix | CC | regulation of complement activation | 7/2311 | 21/18723 | 1.04e-02 | 4.97e-02 | 7 |
| GO:0009896 | Colorectum | AD | positive regulation of catabolic process | 180/3918 | 492/18723 | 4.33e-16 | 1.94e-13 | 180 |
| GO:0031331 | Colorectum | AD | positive regulation of cellular catabolic process | 156/3918 | 427/18723 | 4.68e-14 | 1.05e-11 | 156 |
| GO:0051098 | Colorectum | AD | regulation of binding | 126/3918 | 363/18723 | 6.01e-10 | 4.88e-08 | 126 |
| GO:0022411 | Colorectum | AD | cellular component disassembly | 147/3918 | 443/18723 | 8.53e-10 | 6.76e-08 | 147 |
| GO:0010506 | Colorectum | AD | regulation of autophagy | 111/3918 | 317/18723 | 3.57e-09 | 2.35e-07 | 111 |
| GO:0016236 | Colorectum | AD | macroautophagy | 103/3918 | 291/18723 | 6.76e-09 | 4.15e-07 | 103 |
| GO:0051099 | Colorectum | AD | positive regulation of binding | 66/3918 | 173/18723 | 1.47e-07 | 6.64e-06 | 66 |
| GO:1903008 | Colorectum | AD | organelle disassembly | 46/3918 | 114/18723 | 1.81e-06 | 5.48e-05 | 46 |
| GO:0043393 | Colorectum | AD | regulation of protein binding | 68/3918 | 196/18723 | 5.17e-06 | 1.34e-04 | 68 |
| GO:0061912 | Colorectum | AD | selective autophagy | 29/3918 | 68/18723 | 4.20e-05 | 7.39e-04 | 29 |
| GO:0016241 | Colorectum | AD | regulation of macroautophagy | 50/3918 | 141/18723 | 4.55e-05 | 7.92e-04 | 50 |
| Page: 1 2 3 4 5 6 7 8 9 10 11 12 13 14 15 16 17 18 19 20 |
| Pathway ID | Tissue | Disease Stage | Description | Gene Ratio | Bg Ratio | pvalue | p.adjust | qvalue | Count |
| Page: 1 |
Top |
Cell-cell communication analysis |
| Identification of potential cell-cell interactions between two cell types and their ligand-receptor pairs for different disease states |
| Ligand | Receptor | LRpair | Pathway | Tissue | Disease Stage |
| Page: 1 |
Top |
Single-cell gene regulatory network inference analysis |
| Find out the significant the regulons (TFs) and the target genes of each regulon across cell types for different disease states |
| TF | Cell Type | Tissue | Disease Stage | Target Gene | RSS | Regulon Activity |
| ∗The dot plots of a searched regulon are shown for all cell subpopulations in each disease state of each tissue based on the regulon specific score inferred using pySCENIC and by calculating the average expression. |
| Page: 1 |
Top |
Somatic mutation of malignant transformation related genes |
| Annotation of somatic variants for genes involved in malignant transformation |
| Hugo Symbol | Variant Class | Variant Classification | dbSNP RS | HGVSc | HGVSp | HGVSp Short | SWISSPROT | BIOTYPE | SIFT | PolyPhen | Tumor Sample Barcode | Tissue | Histology | Sex | Age | Stage | Therapy Types | Drugs | Outcome |
| ING1 | SNV | Missense_Mutation | c.149N>T | p.Gly50Val | p.G50V | protein_coding | tolerated_low_confidence(0.07) | possibly_damaging(0.858) | TCGA-AC-A23H-01 | Breast | breast invasive carcinoma | Female | >=65 | I/II | Unknown | Unknown | PD | ||
| ING1 | SNV | Missense_Mutation | c.943G>T | p.Ala315Ser | p.A315S | protein_coding | tolerated(0.71) | benign(0.07) | TCGA-AR-A1AH-01 | Breast | breast invasive carcinoma | Female | <65 | I/II | Unspecific | PD | |||
| ING1 | SNV | Missense_Mutation | novel | c.676G>C | p.Glu226Gln | p.E226Q | protein_coding | deleterious(0) | probably_damaging(0.996) | TCGA-BH-A0B6-01 | Breast | breast invasive carcinoma | Female | <65 | I/II | Unknown | Unknown | SD | |
| ING1 | SNV | Missense_Mutation | c.753N>G | p.Ser251Arg | p.S251R | protein_coding | deleterious(0.03) | benign(0.234) | TCGA-BH-A18H-01 | Breast | breast invasive carcinoma | Female | <65 | I/II | Chemotherapy | adriamycin | CR | ||
| ING1 | SNV | Missense_Mutation | novel | c.37G>A | p.Glu13Lys | p.E13K | protein_coding | tolerated_low_confidence(0.17) | benign(0.125) | TCGA-C5-A8XH-01 | Cervix | cervical & endocervical cancer | Female | <65 | I/II | Unknown | Unknown | SD | |
| ING1 | SNV | Missense_Mutation | c.898G>A | p.Glu300Lys | p.E300K | protein_coding | tolerated(0.07) | benign(0.248) | TCGA-DG-A2KJ-01 | Cervix | cervical & endocervical cancer | Female | <65 | III/IV | Chemotherapy | cisplatin | SD | ||
| ING1 | SNV | Missense_Mutation | novel | c.1102N>A | p.Gly368Ser | p.G368S | protein_coding | deleterious(0.02) | probably_damaging(0.953) | TCGA-EA-A3HS-01 | Cervix | cervical & endocervical cancer | Female | <65 | I/II | Unknown | Unknown | SD | |
| ING1 | SNV | Missense_Mutation | c.41G>A | p.Arg14Gln | p.R14Q | protein_coding | tolerated_low_confidence(0.12) | benign(0.001) | TCGA-MY-A5BE-01 | Cervix | cervical & endocervical cancer | Female | <65 | I/II | Unknown | Unknown | SD | ||
| ING1 | SNV | Missense_Mutation | novel | c.971C>T | p.Ala324Val | p.A324V | protein_coding | tolerated(0.12) | benign(0.108) | TCGA-UC-A7PI-01 | Cervix | cervical & endocervical cancer | Female | <65 | I/II | Unknown | Unknown | PD | |
| ING1 | SNV | Missense_Mutation | c.1108N>T | p.Asp370Tyr | p.D370Y | protein_coding | deleterious(0) | probably_damaging(0.97) | TCGA-AA-3502-01 | Colorectum | colon adenocarcinoma | Male | >=65 | I/II | Unknown | Unknown | SD |
| Page: 1 2 3 4 5 6 |
Top |
Related drugs of malignant transformation related genes |
| Identification of chemicals and drugs interact with genes involved in malignant transfromation |
| (DGIdb 4.0) |
| Entrez ID | Symbol | Category | Interaction Types | Drug Claim Name | Drug Name | PMIDs |
| Page: 1 |

Copyright 2023-Present -The University of Texas Health Science Center at Houston |