
|
|||||
|
 | |
| |
| |
| |
| |
| |
|
Gene: INAVA |
Gene summary for INAVA |
| Gene information | Species | Human | Gene symbol | INAVA | Gene ID | 55765 |
| Gene name | innate immunity activator | |
| Gene Alias | C1orf106 | |
| Cytomap | 1q32.1 | |
| Gene Type | protein-coding | GO ID | GO:0000165 | UniProtAcc | Q3KP66 |
Top |
Malignant transformation analysis |
| Identification of the aberrant gene expression in precancerous and cancerous lesions by comparing the gene expression of stem-like cells in diseased tissues with normal stem cells |
| Entrez ID | Symbol | Replicates | Species | Organ | Tissue | Adj P-value | Log2FC | Malignancy |
| 55765 | INAVA | CCI_1 | Human | Cervix | CC | 8.10e-05 | 6.70e-01 | 0.528 |
| 55765 | INAVA | CCI_3 | Human | Cervix | CC | 4.32e-09 | 6.41e-01 | 0.516 |
| 55765 | INAVA | sample3 | Human | Cervix | CC | 1.71e-19 | 3.59e-01 | 0.1387 |
| 55765 | INAVA | T3 | Human | Cervix | CC | 1.72e-12 | 3.36e-01 | 0.1389 |
| 55765 | INAVA | HTA11_3410_2000001011 | Human | Colorectum | AD | 2.41e-02 | 1.89e-01 | 0.0155 |
| 55765 | INAVA | HTA11_2487_2000001011 | Human | Colorectum | SER | 8.32e-24 | 1.03e+00 | -0.1808 |
| 55765 | INAVA | HTA11_1938_2000001011 | Human | Colorectum | AD | 1.25e-17 | 7.42e-01 | -0.0811 |
| 55765 | INAVA | HTA11_78_2000001011 | Human | Colorectum | AD | 1.24e-08 | 5.68e-01 | -0.1088 |
| 55765 | INAVA | HTA11_347_2000001011 | Human | Colorectum | AD | 9.32e-36 | 9.01e-01 | -0.1954 |
| 55765 | INAVA | HTA11_411_2000001011 | Human | Colorectum | SER | 1.87e-10 | 1.54e+00 | -0.2602 |
| 55765 | INAVA | HTA11_2112_2000001011 | Human | Colorectum | SER | 3.25e-13 | 1.23e+00 | -0.2196 |
| 55765 | INAVA | HTA11_3361_2000001011 | Human | Colorectum | AD | 1.39e-12 | 7.05e-01 | -0.1207 |
| 55765 | INAVA | HTA11_83_2000001011 | Human | Colorectum | SER | 1.10e-09 | 6.37e-01 | -0.1526 |
| 55765 | INAVA | HTA11_696_2000001011 | Human | Colorectum | AD | 3.38e-23 | 8.29e-01 | -0.1464 |
| 55765 | INAVA | HTA11_866_2000001011 | Human | Colorectum | AD | 5.77e-16 | 6.29e-01 | -0.1001 |
| 55765 | INAVA | HTA11_1391_2000001011 | Human | Colorectum | AD | 2.48e-13 | 6.87e-01 | -0.059 |
| 55765 | INAVA | HTA11_2992_2000001011 | Human | Colorectum | SER | 2.58e-10 | 8.38e-01 | -0.1706 |
| 55765 | INAVA | HTA11_5212_2000001011 | Human | Colorectum | AD | 4.70e-17 | 1.03e+00 | -0.2061 |
| 55765 | INAVA | HTA11_546_2000001011 | Human | Colorectum | AD | 1.20e-05 | 5.75e-01 | -0.0842 |
| 55765 | INAVA | HTA11_7696_3000711011 | Human | Colorectum | AD | 1.55e-03 | 3.10e-01 | 0.0674 |
| Page: 1 2 3 |
| Tissue | Expression Dynamics | Abbreviation |
| Cervix | 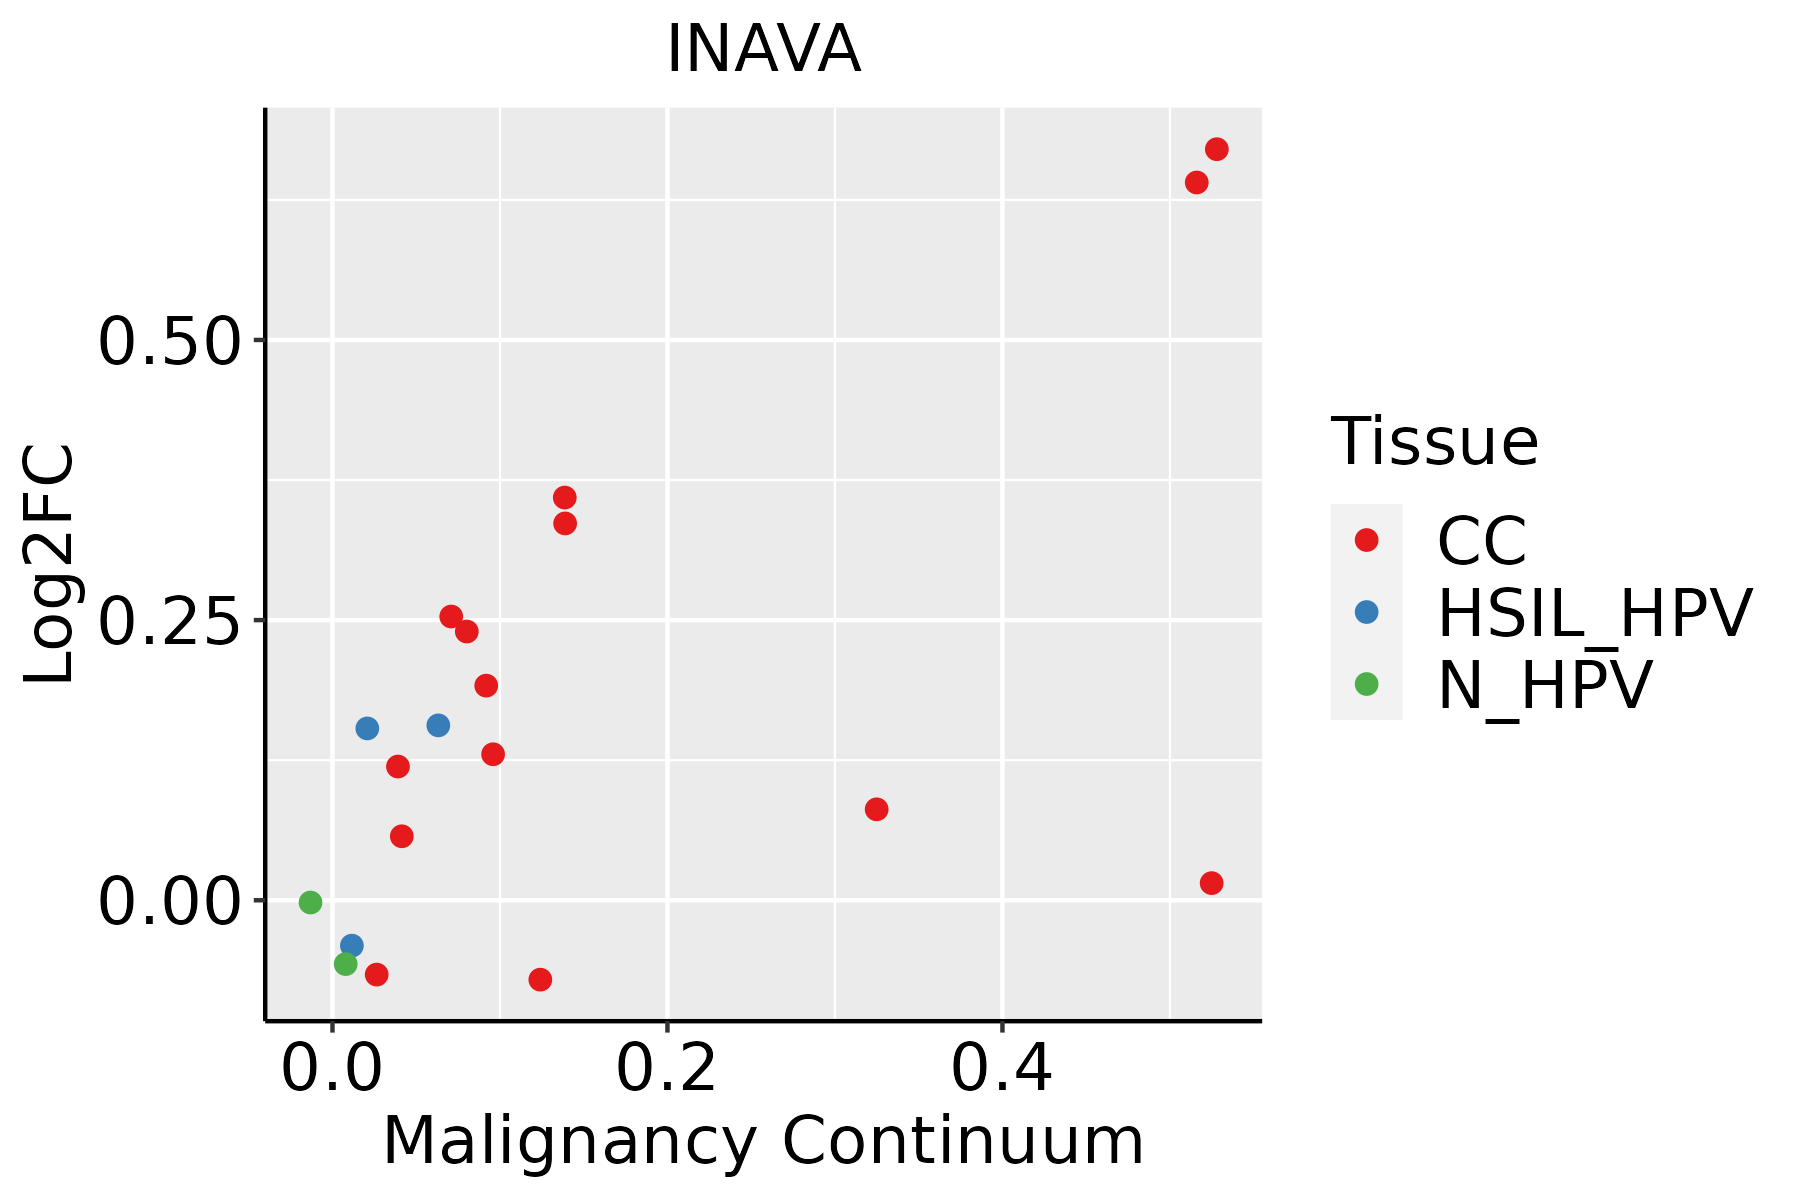 | CC: Cervix cancer |
| HSIL_HPV: HPV-infected high-grade squamous intraepithelial lesions | ||
| N_HPV: HPV-infected normal cervix | ||
| Colorectum (GSE201348) |  | FAP: Familial adenomatous polyposis |
| CRC: Colorectal cancer | ||
| Colorectum (HTA11) |  | AD: Adenomas |
| SER: Sessile serrated lesions | ||
| MSI-H: Microsatellite-high colorectal cancer | ||
| MSS: Microsatellite stable colorectal cancer | ||
| GC | 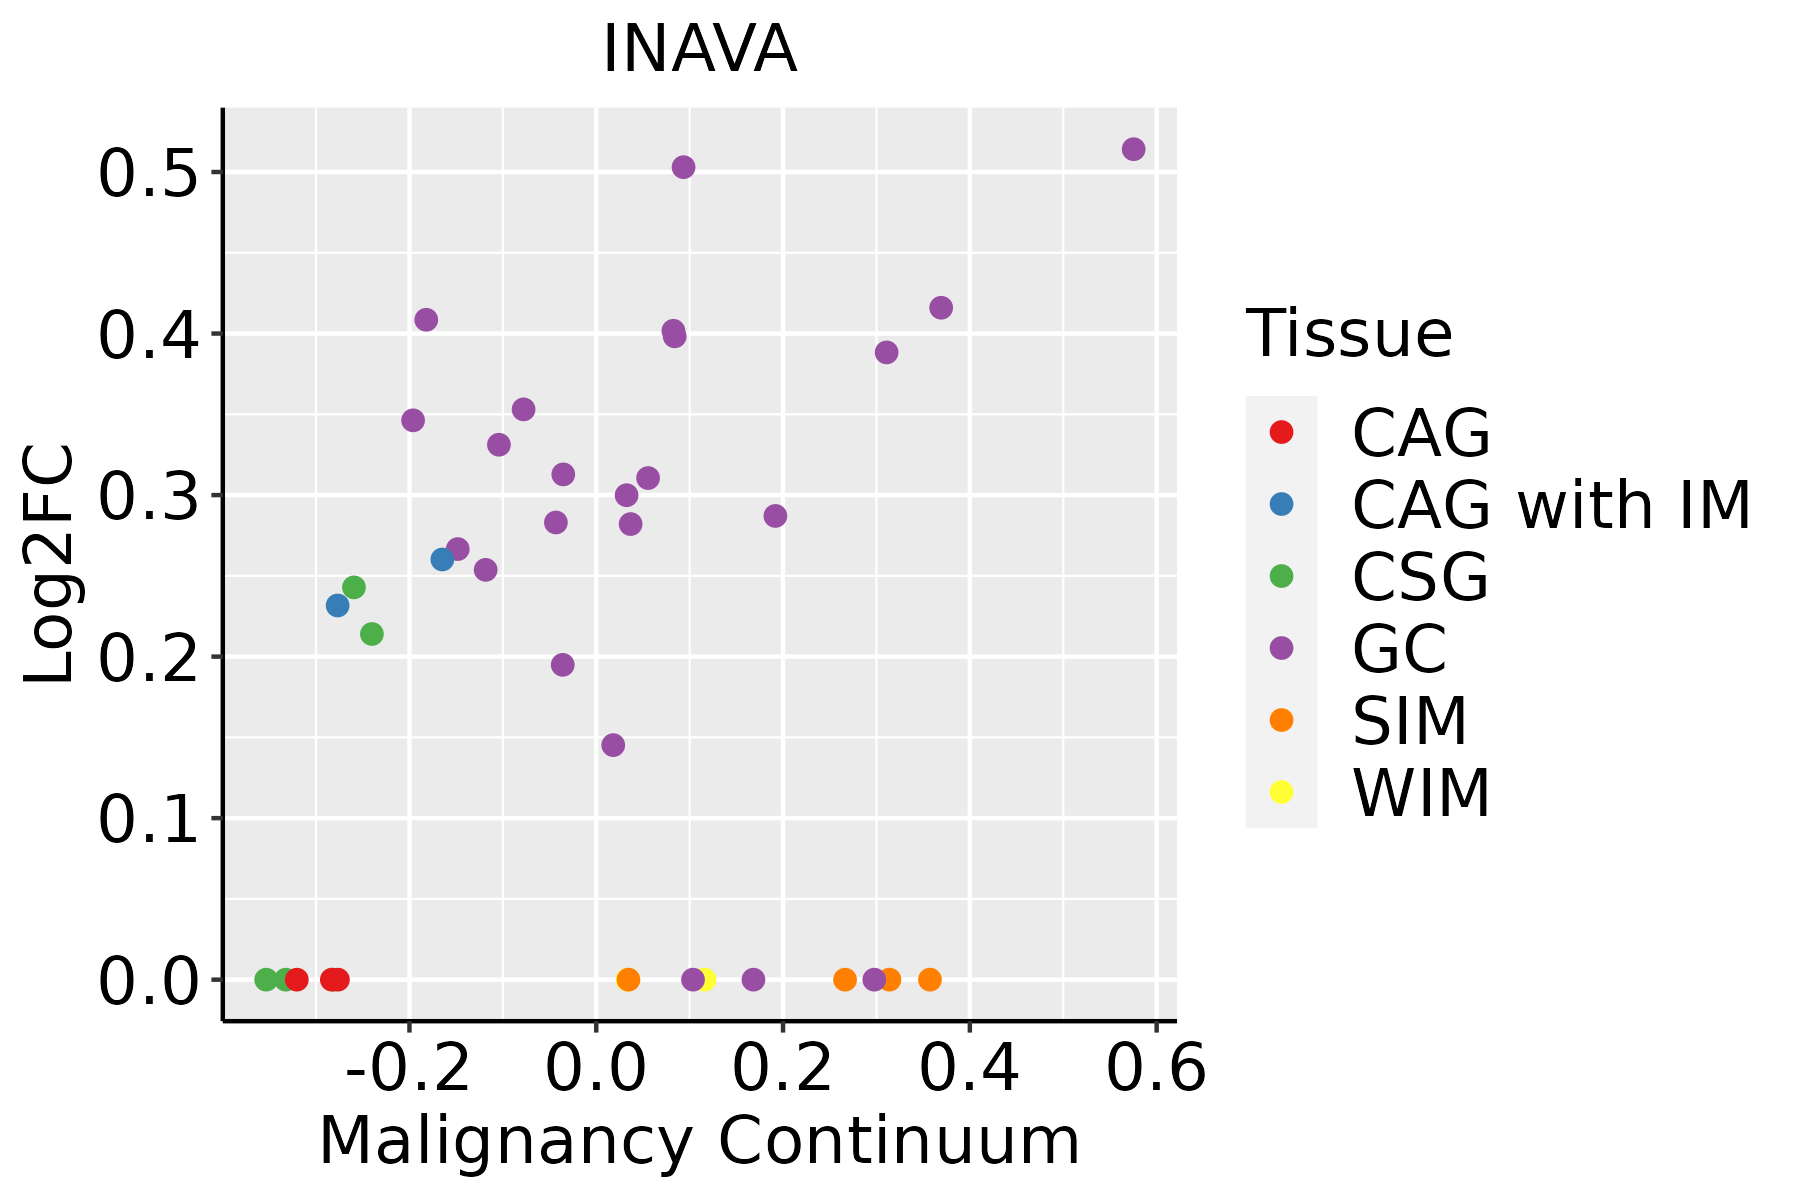 | CAG: Chronic atrophic gastritis |
| CAG with IM: Chronic atrophic gastritis with intestinal metaplasia | ||
| CSG: Chronic superficial gastritis | ||
| GC: Gastric cancer | ||
| SIM: Severe intestinal metaplasia | ||
| WIM: Wild intestinal metaplasia | ||
| Liver |  | HCC: Hepatocellular carcinoma |
| NAFLD: Non-alcoholic fatty liver disease |
| ∗log2FC in expression of this searched gene in stem-like cells from each diseased tissue sample relative to stem-like cells in normal samples in each tissue plotted against the malignancy continuum. Samples are colored based on if they are from different disease stage. |
Top |
Malignant transformation related pathway analysis |
| Find out the enriched GO biological processes and KEGG pathways involved in transition from healthy to precancer to cancer |
| Tissue | Disease Stage | Enriched GO biological Processes |
| Colorectum | AD |  |
| Colorectum | SER |  |
| Colorectum | MSS |  |
| Colorectum | MSI-H |  |
| Colorectum | FAP |  |
| ∗Top 15 enriched GO BP terms are showed in the bar plot of each disease state in each tissue. Each row represents a significant GO biological process which is colored according to the -log10(p.adjust). |
| Page: 1 2 3 4 5 6 7 8 9 |
| GO ID | Tissue | Disease Stage | Description | Gene Ratio | Bg Ratio | pvalue | p.adjust | Count |
| GO:0032495 | Cervix | CC | response to muramyl dipeptide | 8/2311 | 20/18723 | 1.69e-03 | 1.29e-02 | 8 |
| GO:00027201 | Cervix | CC | positive regulation of cytokine production involved in immune response | 17/2311 | 65/18723 | 1.84e-03 | 1.37e-02 | 17 |
| GO:00431237 | Cervix | CC | positive regulation of I-kappaB kinase/NF-kappaB signaling | 37/2311 | 186/18723 | 2.15e-03 | 1.55e-02 | 37 |
| GO:00703043 | Cervix | CC | positive regulation of stress-activated protein kinase signaling cascade | 27/2311 | 128/18723 | 3.49e-03 | 2.26e-02 | 27 |
| GO:00313983 | Cervix | CC | positive regulation of protein ubiquitination | 25/2311 | 119/18723 | 5.09e-03 | 3.01e-02 | 25 |
| GO:0002699 | Cervix | CC | positive regulation of immune effector process | 43/2311 | 235/18723 | 5.13e-03 | 3.02e-02 | 43 |
| GO:19033224 | Cervix | CC | positive regulation of protein modification by small protein conjugation or removal | 28/2311 | 138/18723 | 5.26e-03 | 3.08e-02 | 28 |
| GO:00343326 | Cervix | CC | adherens junction organization | 13/2311 | 49/18723 | 5.34e-03 | 3.10e-02 | 13 |
| GO:00343316 | Cervix | CC | cell junction maintenance | 10/2311 | 35/18723 | 7.99e-03 | 4.18e-02 | 10 |
| GO:00704237 | Cervix | CC | nucleotide-binding oligomerization domain containing signaling pathway | 8/2311 | 25/18723 | 8.27e-03 | 4.28e-02 | 8 |
| GO:00704316 | Cervix | CC | nucleotide-binding oligomerization domain containing 2 signaling pathway | 6/2311 | 16/18723 | 9.35e-03 | 4.66e-02 | 6 |
| GO:19034095 | Cervix | CC | reactive oxygen species biosynthetic process | 15/2311 | 64/18723 | 9.89e-03 | 4.85e-02 | 15 |
| GO:0045216 | Colorectum | AD | cell-cell junction organization | 80/3918 | 200/18723 | 5.57e-10 | 4.58e-08 | 80 |
| GO:1903320 | Colorectum | AD | regulation of protein modification by small protein conjugation or removal | 86/3918 | 242/18723 | 9.43e-08 | 4.65e-06 | 86 |
| GO:0030522 | Colorectum | AD | intracellular receptor signaling pathway | 87/3918 | 265/18723 | 3.69e-06 | 1.03e-04 | 87 |
| GO:0031396 | Colorectum | AD | regulation of protein ubiquitination | 72/3918 | 210/18723 | 4.50e-06 | 1.21e-04 | 72 |
| GO:0060249 | Colorectum | AD | anatomical structure homeostasis | 94/3918 | 314/18723 | 9.37e-05 | 1.42e-03 | 94 |
| GO:0043954 | Colorectum | AD | cellular component maintenance | 26/3918 | 61/18723 | 1.04e-04 | 1.56e-03 | 26 |
| GO:0043123 | Colorectum | AD | positive regulation of I-kappaB kinase/NF-kappaB signaling | 60/3918 | 186/18723 | 1.91e-04 | 2.56e-03 | 60 |
| GO:0001894 | Colorectum | AD | tissue homeostasis | 81/3918 | 268/18723 | 1.96e-04 | 2.62e-03 | 81 |
| Page: 1 2 3 4 5 6 7 8 9 10 11 |
| Pathway ID | Tissue | Disease Stage | Description | Gene Ratio | Bg Ratio | pvalue | p.adjust | qvalue | Count |
| Page: 1 |
Top |
Cell-cell communication analysis |
| Identification of potential cell-cell interactions between two cell types and their ligand-receptor pairs for different disease states |
| Ligand | Receptor | LRpair | Pathway | Tissue | Disease Stage |
| Page: 1 |
Top |
Single-cell gene regulatory network inference analysis |
| Find out the significant the regulons (TFs) and the target genes of each regulon across cell types for different disease states |
| TF | Cell Type | Tissue | Disease Stage | Target Gene | RSS | Regulon Activity |
| ∗The dot plots of a searched regulon are shown for all cell subpopulations in each disease state of each tissue based on the regulon specific score inferred using pySCENIC and by calculating the average expression. |
| Page: 1 |
Top |
Somatic mutation of malignant transformation related genes |
| Annotation of somatic variants for genes involved in malignant transformation |
| Hugo Symbol | Variant Class | Variant Classification | dbSNP RS | HGVSc | HGVSp | HGVSp Short | SWISSPROT | BIOTYPE | SIFT | PolyPhen | Tumor Sample Barcode | Tissue | Histology | Sex | Age | Stage | Therapy Types | Drugs | Outcome |
| Page: 1 |
Top |
Related drugs of malignant transformation related genes |
| Identification of chemicals and drugs interact with genes involved in malignant transfromation |
| (DGIdb 4.0) |
| Entrez ID | Symbol | Category | Interaction Types | Drug Claim Name | Drug Name | PMIDs |
| Page: 1 |

Copyright 2023-Present -The University of Texas Health Science Center at Houston |