
|
|||||
|
 | |
| |
| |
| |
| |
| |
|
Gene: IL4I1 |
Gene summary for IL4I1 |
| Gene information | Species | Human | Gene symbol | IL4I1 | Gene ID | 259307 |
| Gene name | interleukin 4 induced 1 | |
| Gene Alias | FIG1 | |
| Cytomap | 19q13.33 | |
| Gene Type | protein-coding | GO ID | GO:0001775 | UniProtAcc | Q96RQ9 |
Top |
Malignant transformation analysis |
| Identification of the aberrant gene expression in precancerous and cancerous lesions by comparing the gene expression of stem-like cells in diseased tissues with normal stem cells |
| Entrez ID | Symbol | Replicates | Species | Organ | Tissue | Adj P-value | Log2FC | Malignancy |
| 259307 | IL4I1 | PTCwithHT_6 | Human | Thyroid | HT | 4.82e-02 | 1.66e-01 | 0.02 |
| 259307 | IL4I1 | ATC09 | Human | Thyroid | ATC | 6.36e-27 | 7.54e-01 | 0.2871 |
| 259307 | IL4I1 | ATC12 | Human | Thyroid | ATC | 5.14e-03 | 1.16e-01 | 0.34 |
| 259307 | IL4I1 | ATC1 | Human | Thyroid | ATC | 1.78e-27 | 8.14e-01 | 0.2878 |
| 259307 | IL4I1 | ATC4 | Human | Thyroid | ATC | 1.97e-05 | 1.87e-01 | 0.34 |
| Page: 1 |
| Tissue | Expression Dynamics | Abbreviation |
| Thyroid | 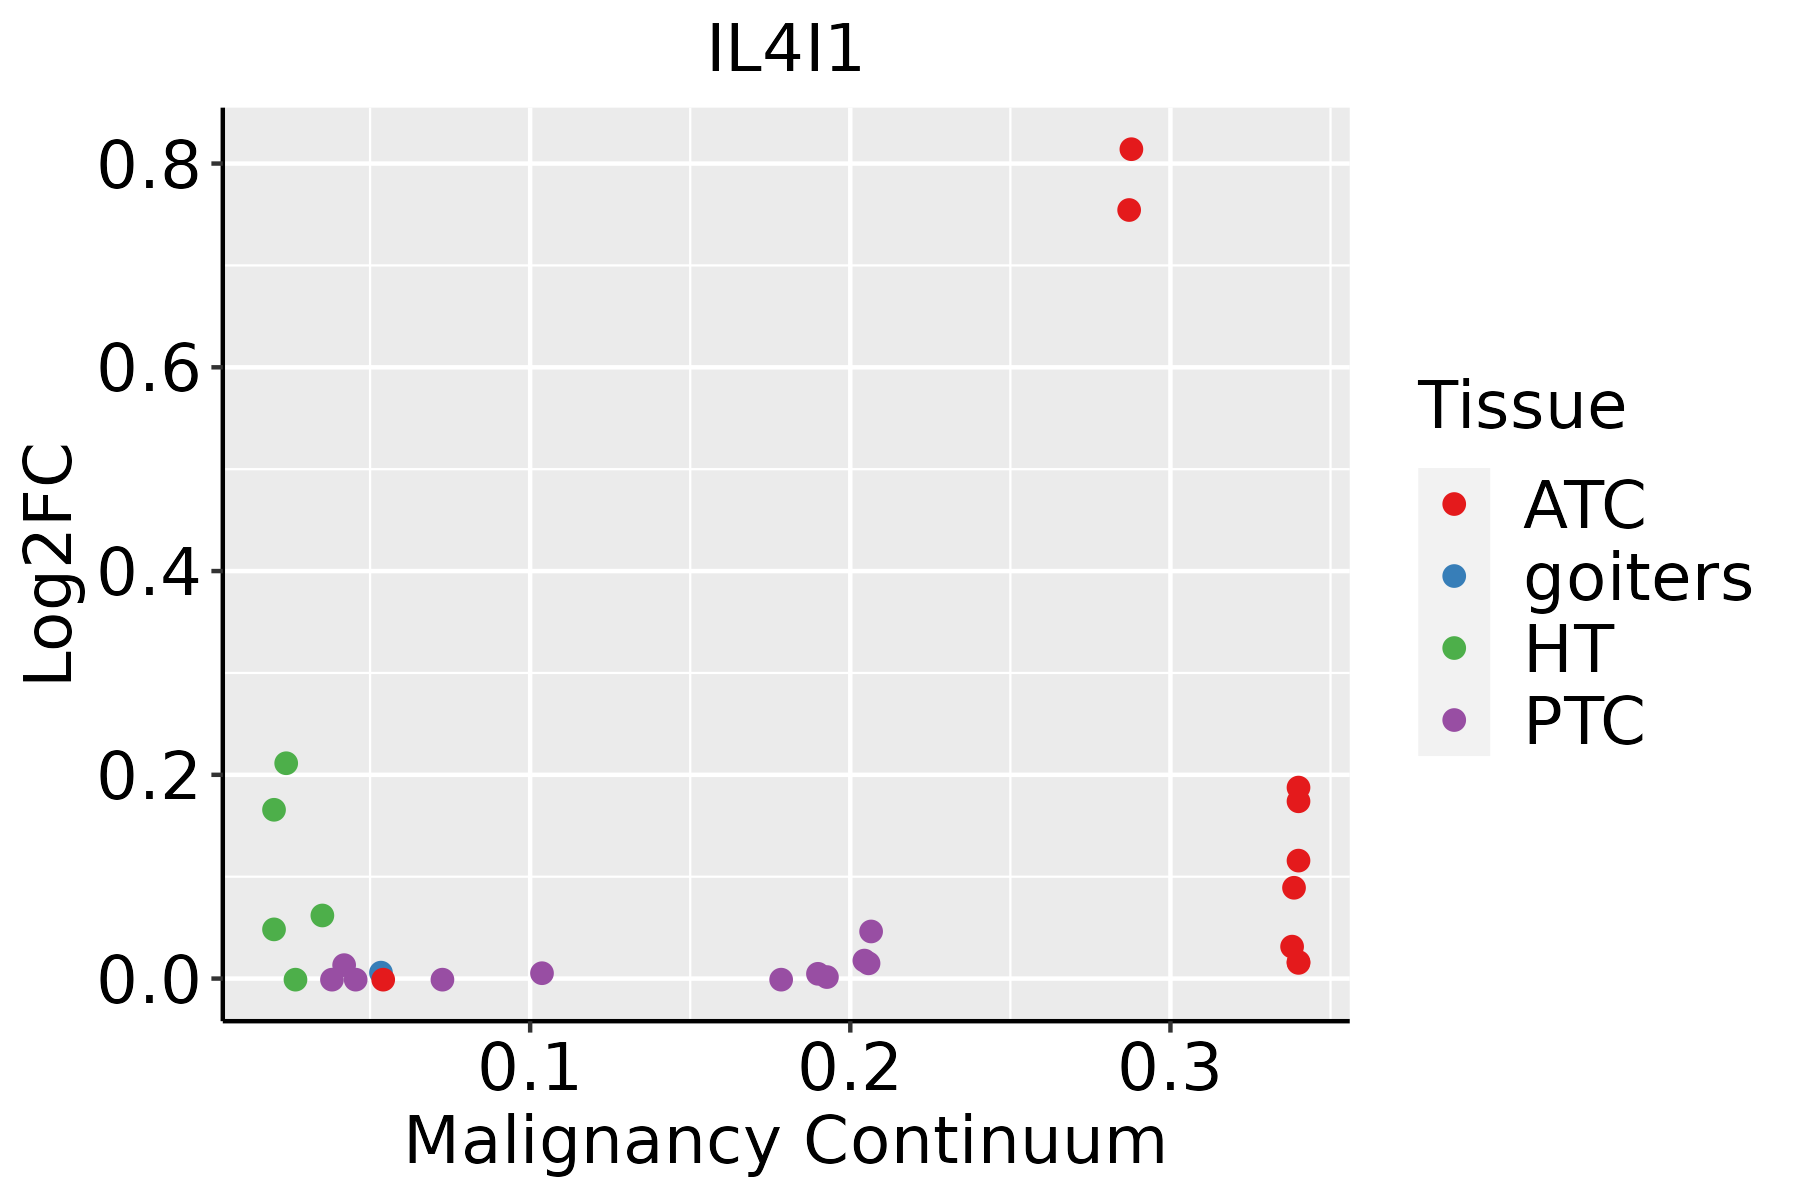 | ATC: Anaplastic thyroid cancer |
| HT: Hashimoto's thyroiditis | ||
| PTC: Papillary thyroid cancer |
| ∗log2FC in expression of this searched gene in stem-like cells from each diseased tissue sample relative to stem-like cells in normal samples in each tissue plotted against the malignancy continuum. Samples are colored based on if they are from different disease stage. |
Top |
Malignant transformation related pathway analysis |
| Find out the enriched GO biological processes and KEGG pathways involved in transition from healthy to precancer to cancer |
| Tissue | Disease Stage | Enriched GO biological Processes |
| Colorectum | AD |  |
| Colorectum | SER |  |
| Colorectum | MSS |  |
| Colorectum | MSI-H |  |
| Colorectum | FAP |  |
| ∗Top 15 enriched GO BP terms are showed in the bar plot of each disease state in each tissue. Each row represents a significant GO biological process which is colored according to the -log10(p.adjust). |
| Page: 1 2 3 4 5 6 7 8 9 |
| GO ID | Tissue | Disease Stage | Description | Gene Ratio | Bg Ratio | pvalue | p.adjust | Count |
| GO:00506708 | Thyroid | HT | regulation of lymphocyte proliferation | 33/1272 | 225/18723 | 2.35e-05 | 5.25e-04 | 33 |
| GO:00024494 | Thyroid | HT | lymphocyte mediated immunity | 45/1272 | 350/18723 | 2.76e-05 | 6.05e-04 | 45 |
| GO:00329447 | Thyroid | HT | regulation of mononuclear cell proliferation | 33/1272 | 227/18723 | 2.82e-05 | 6.13e-04 | 33 |
| GO:00300986 | Thyroid | HT | lymphocyte differentiation | 47/1272 | 374/18723 | 3.32e-05 | 7.02e-04 | 47 |
| GO:000268319 | Thyroid | HT | negative regulation of immune system process | 52/1272 | 434/18723 | 4.74e-05 | 9.49e-04 | 52 |
| GO:00024434 | Thyroid | HT | leukocyte mediated immunity | 51/1272 | 440/18723 | 1.30e-04 | 2.07e-03 | 51 |
| GO:00024605 | Thyroid | HT | adaptive immune response based on somatic recombination of immune receptors built from immunoglobulin superfamily domains | 43/1272 | 356/18723 | 1.74e-04 | 2.59e-03 | 43 |
| GO:190210517 | Thyroid | HT | regulation of leukocyte differentiation | 35/1272 | 279/18723 | 3.32e-04 | 4.28e-03 | 35 |
| GO:00224088 | Thyroid | HT | negative regulation of cell-cell adhesion | 27/1272 | 196/18723 | 3.55e-04 | 4.54e-03 | 27 |
| GO:00421133 | Thyroid | HT | B cell activation | 39/1272 | 334/18723 | 6.66e-04 | 7.61e-03 | 39 |
| GO:000242410 | Thyroid | HT | T cell mediated immune response to tumor cell | 5/1272 | 12/18723 | 7.59e-04 | 8.37e-03 | 5 |
| GO:19021078 | Thyroid | HT | positive regulation of leukocyte differentiation | 22/1272 | 157/18723 | 9.54e-04 | 9.83e-03 | 22 |
| GO:19037088 | Thyroid | HT | positive regulation of hemopoiesis | 22/1272 | 157/18723 | 9.54e-04 | 9.83e-03 | 22 |
| GO:00023473 | Thyroid | HT | response to tumor cell | 9/1272 | 39/18723 | 9.90e-04 | 1.01e-02 | 9 |
| GO:00302178 | Thyroid | HT | T cell differentiation | 31/1272 | 257/18723 | 1.35e-03 | 1.29e-02 | 31 |
| GO:004670020 | Thyroid | HT | heterocycle catabolic process | 47/1272 | 445/18723 | 1.76e-03 | 1.58e-02 | 47 |
| GO:001943920 | Thyroid | HT | aromatic compound catabolic process | 48/1272 | 467/18723 | 2.74e-03 | 2.25e-02 | 48 |
| GO:000716218 | Thyroid | HT | negative regulation of cell adhesion | 34/1272 | 303/18723 | 2.76e-03 | 2.27e-02 | 34 |
| GO:000283110 | Thyroid | HT | regulation of response to biotic stimulus | 36/1272 | 327/18723 | 2.91e-03 | 2.36e-02 | 36 |
| GO:190136120 | Thyroid | HT | organic cyclic compound catabolic process | 50/1272 | 495/18723 | 3.22e-03 | 2.55e-02 | 50 |
| Page: 1 2 3 4 |
| Pathway ID | Tissue | Disease Stage | Description | Gene Ratio | Bg Ratio | pvalue | p.adjust | qvalue | Count |
| Page: 1 |
Top |
Cell-cell communication analysis |
| Identification of potential cell-cell interactions between two cell types and their ligand-receptor pairs for different disease states |
| Ligand | Receptor | LRpair | Pathway | Tissue | Disease Stage |
| Page: 1 |
Top |
Single-cell gene regulatory network inference analysis |
| Find out the significant the regulons (TFs) and the target genes of each regulon across cell types for different disease states |
| TF | Cell Type | Tissue | Disease Stage | Target Gene | RSS | Regulon Activity |
| ∗The dot plots of a searched regulon are shown for all cell subpopulations in each disease state of each tissue based on the regulon specific score inferred using pySCENIC and by calculating the average expression. |
| Page: 1 |
Top |
Somatic mutation of malignant transformation related genes |
| Annotation of somatic variants for genes involved in malignant transformation |
| Hugo Symbol | Variant Class | Variant Classification | dbSNP RS | HGVSc | HGVSp | HGVSp Short | SWISSPROT | BIOTYPE | SIFT | PolyPhen | Tumor Sample Barcode | Tissue | Histology | Sex | Age | Stage | Therapy Types | Drugs | Outcome |
| IL4I1 | SNV | Missense_Mutation | novel | c.1664N>G | p.Val555Gly | p.V555G | Q96RQ9 | protein_coding | tolerated_low_confidence(0.07) | benign(0.017) | TCGA-A2-A0T5-01 | Breast | breast invasive carcinoma | Female | <65 | I/II | Unspecific | Taxotere | SD |
| IL4I1 | SNV | Missense_Mutation | novel | c.1502N>A | p.Ala501Asp | p.A501D | Q96RQ9 | protein_coding | deleterious(0) | probably_damaging(0.999) | TCGA-A2-A0YK-01 | Breast | breast invasive carcinoma | Female | <65 | I/II | Chemotherapy | cytoxan | SD |
| IL4I1 | SNV | Missense_Mutation | novel | c.1664N>G | p.Val555Gly | p.V555G | Q96RQ9 | protein_coding | tolerated_low_confidence(0.07) | benign(0.017) | TCGA-E9-A1RE-01 | Breast | breast invasive carcinoma | Female | >=65 | III/IV | Hormone Therapy | tamoxiphen | SD |
| IL4I1 | SNV | Missense_Mutation | rs141664132 | c.149N>A | p.Arg50His | p.R50H | Q96RQ9 | protein_coding | tolerated(0.68) | benign(0) | TCGA-JX-A3Q0-01 | Cervix | cervical & endocervical cancer | Female | <65 | III/IV | Unknown | Unknown | SD |
| IL4I1 | insertion | Frame_Shift_Ins | novel | c.397dupG | p.Glu133GlyfsTer97 | p.E133Gfs*97 | Q96RQ9 | protein_coding | TCGA-EA-A410-01 | Cervix | cervical & endocervical cancer | Female | <65 | I/II | Unknown | Unknown | SD | ||
| IL4I1 | SNV | Missense_Mutation | c.1207N>T | p.Arg403Cys | p.R403C | Q96RQ9 | protein_coding | deleterious(0.02) | probably_damaging(1) | TCGA-A6-2686-01 | Colorectum | colon adenocarcinoma | Female | >=65 | I/II | Unknown | Unknown | SD | |
| IL4I1 | SNV | Missense_Mutation | c.1442N>A | p.Pro481Gln | p.P481Q | Q96RQ9 | protein_coding | deleterious(0) | probably_damaging(0.994) | TCGA-A6-6780-01 | Colorectum | colon adenocarcinoma | Male | >=65 | I/II | Unknown | Unknown | SD | |
| IL4I1 | SNV | Missense_Mutation | rs369942631 | c.517G>A | p.Glu173Lys | p.E173K | Q96RQ9 | protein_coding | tolerated(0.05) | benign(0.143) | TCGA-AD-6895-01 | Colorectum | colon adenocarcinoma | Male | >=65 | III/IV | Unknown | Unknown | SD |
| IL4I1 | SNV | Missense_Mutation | novel | c.515N>C | p.His172Pro | p.H172P | Q96RQ9 | protein_coding | deleterious(0) | benign(0.284) | TCGA-AM-5821-01 | Colorectum | colon adenocarcinoma | Female | >=65 | I/II | Unknown | Unknown | SD |
| IL4I1 | SNV | Missense_Mutation | c.614N>G | p.Tyr205Cys | p.Y205C | Q96RQ9 | protein_coding | deleterious(0.01) | possibly_damaging(0.87) | TCGA-CA-6718-01 | Colorectum | colon adenocarcinoma | Male | <65 | I/II | Unknown | Unknown | PD |
| Page: 1 2 3 4 5 |
Top |
Related drugs of malignant transformation related genes |
| Identification of chemicals and drugs interact with genes involved in malignant transfromation |
| (DGIdb 4.0) |
| Entrez ID | Symbol | Category | Interaction Types | Drug Claim Name | Drug Name | PMIDs |
| Page: 1 |

Copyright 2023-Present -The University of Texas Health Science Center at Houston |