
|
|||||
|
 | |
| |
| |
| |
| |
| |
|
Gene: IL23A |
Gene summary for IL23A |
| Gene information | Species | Human | Gene symbol | IL23A | Gene ID | 51561 |
| Gene name | interleukin 23 subunit alpha | |
| Gene Alias | IL-23 | |
| Cytomap | 12q13.3 | |
| Gene Type | protein-coding | GO ID | GO:0001775 | UniProtAcc | Q9NPF7 |
Top |
Malignant transformation analysis |
| Identification of the aberrant gene expression in precancerous and cancerous lesions by comparing the gene expression of stem-like cells in diseased tissues with normal stem cells |
| Entrez ID | Symbol | Replicates | Species | Organ | Tissue | Adj P-value | Log2FC | Malignancy |
| 51561 | IL23A | LZE7T | Human | Esophagus | ESCC | 3.98e-06 | 2.91e-01 | 0.0667 |
| 51561 | IL23A | P1T-E | Human | Esophagus | ESCC | 7.43e-09 | 1.20e+00 | 0.0875 |
| 51561 | IL23A | P2T-E | Human | Esophagus | ESCC | 2.98e-03 | 1.90e-01 | 0.1177 |
| 51561 | IL23A | P4T-E | Human | Esophagus | ESCC | 8.33e-13 | 3.12e-01 | 0.1323 |
| 51561 | IL23A | P8T-E | Human | Esophagus | ESCC | 3.75e-02 | 9.40e-02 | 0.0889 |
| 51561 | IL23A | P11T-E | Human | Esophagus | ESCC | 1.72e-04 | 5.52e-01 | 0.1426 |
| 51561 | IL23A | P23T-E | Human | Esophagus | ESCC | 4.42e-05 | 1.46e-01 | 0.108 |
| 51561 | IL23A | P26T-E | Human | Esophagus | ESCC | 3.11e-06 | 1.75e-01 | 0.1276 |
| 51561 | IL23A | P37T-E | Human | Esophagus | ESCC | 3.53e-03 | 1.04e-01 | 0.1371 |
| 51561 | IL23A | P49T-E | Human | Esophagus | ESCC | 6.53e-04 | 4.81e-01 | 0.1768 |
| 51561 | IL23A | P52T-E | Human | Esophagus | ESCC | 2.93e-08 | 2.62e-01 | 0.1555 |
| 51561 | IL23A | P54T-E | Human | Esophagus | ESCC | 2.11e-02 | 1.81e-01 | 0.0975 |
| 51561 | IL23A | P62T-E | Human | Esophagus | ESCC | 5.60e-04 | 1.37e-01 | 0.1302 |
| 51561 | IL23A | P76T-E | Human | Esophagus | ESCC | 2.52e-04 | 2.32e-01 | 0.1207 |
| 51561 | IL23A | P83T-E | Human | Esophagus | ESCC | 1.84e-08 | 4.57e-01 | 0.1738 |
| 51561 | IL23A | P89T-E | Human | Esophagus | ESCC | 3.35e-02 | 2.88e-01 | 0.1752 |
| 51561 | IL23A | P126T-E | Human | Esophagus | ESCC | 7.86e-04 | 2.97e-01 | 0.1125 |
| 51561 | IL23A | P128T-E | Human | Esophagus | ESCC | 1.91e-31 | 9.38e-01 | 0.1241 |
| 51561 | IL23A | P130T-E | Human | Esophagus | ESCC | 2.02e-17 | 5.24e-01 | 0.1676 |
| 51561 | IL23A | C21 | Human | Oral cavity | OSCC | 5.36e-04 | 2.28e-01 | 0.2678 |
| Page: 1 2 |
| Tissue | Expression Dynamics | Abbreviation |
| Esophagus | 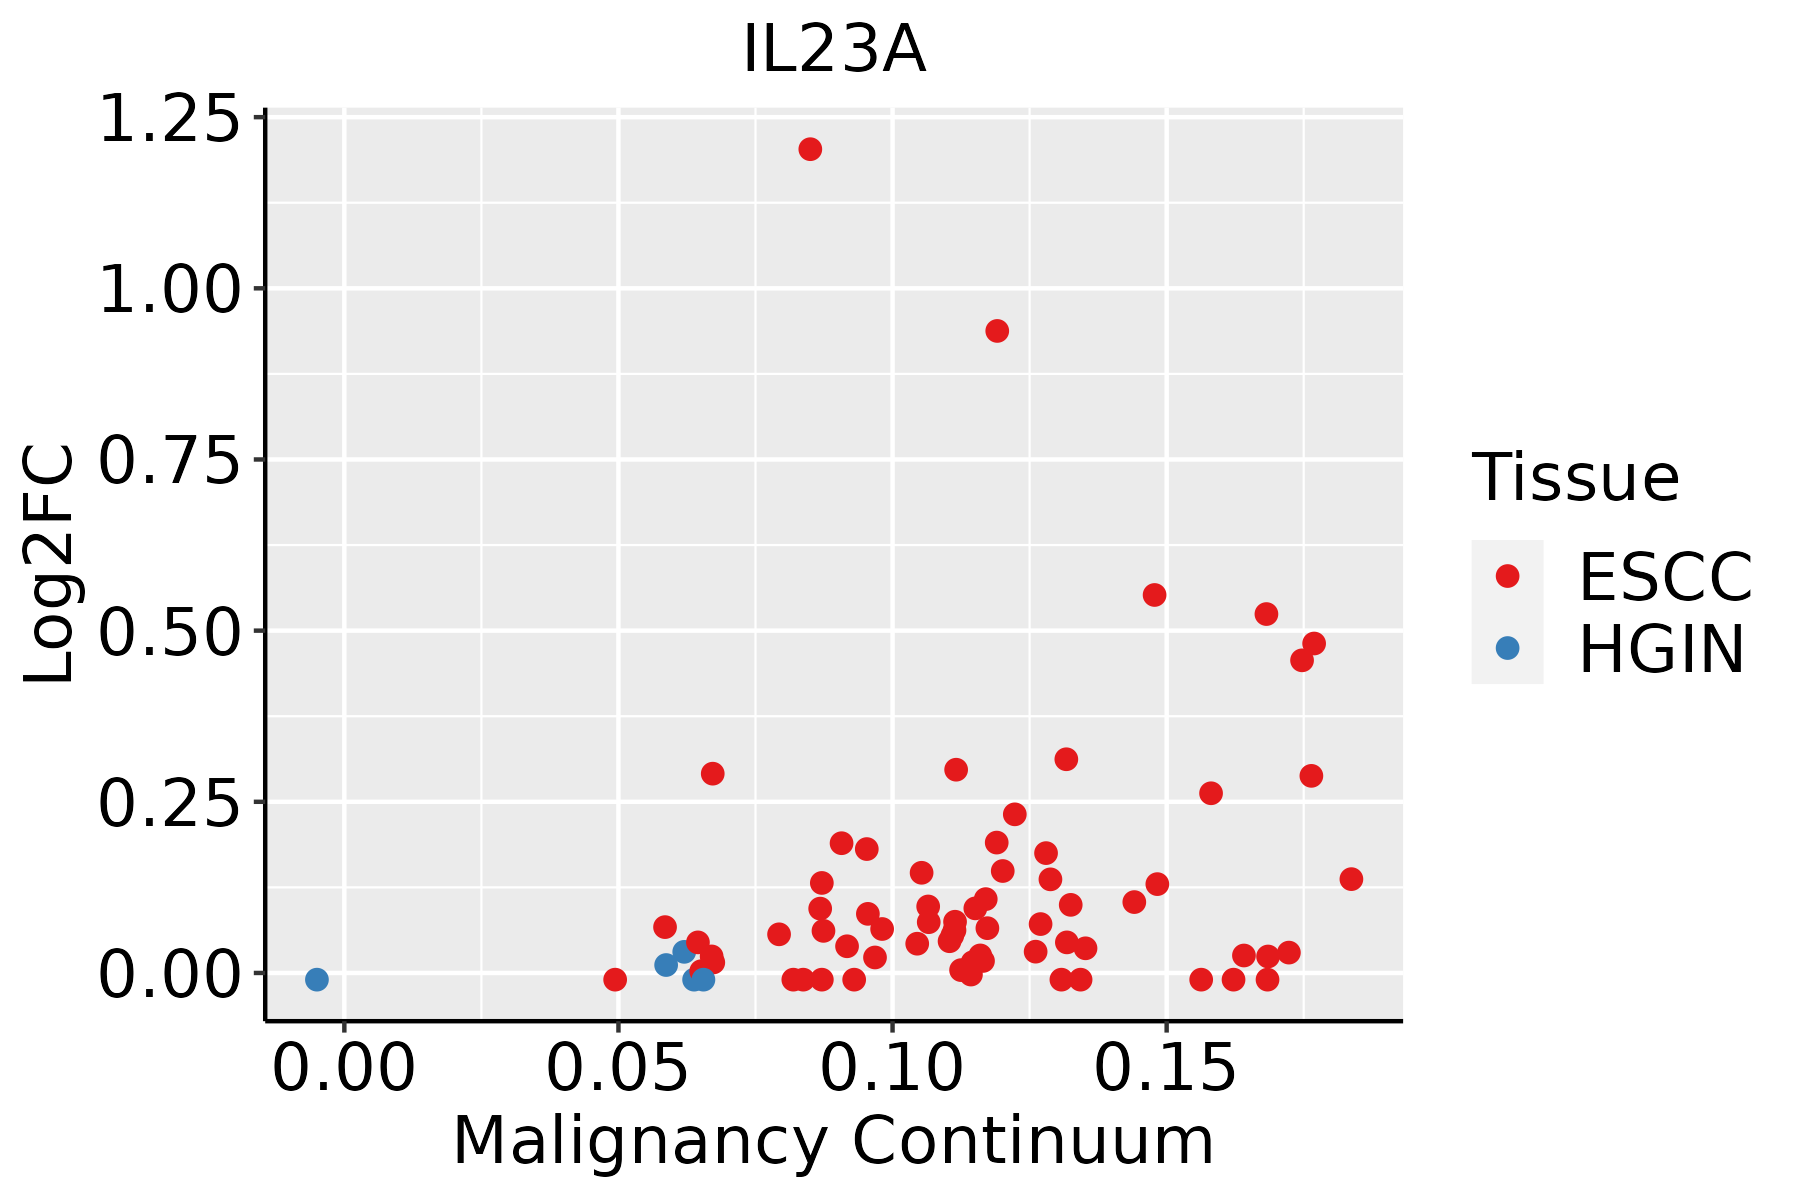 | ESCC: Esophageal squamous cell carcinoma |
| HGIN: High-grade intraepithelial neoplasias | ||
| LGIN: Low-grade intraepithelial neoplasias | ||
| Oral Cavity | 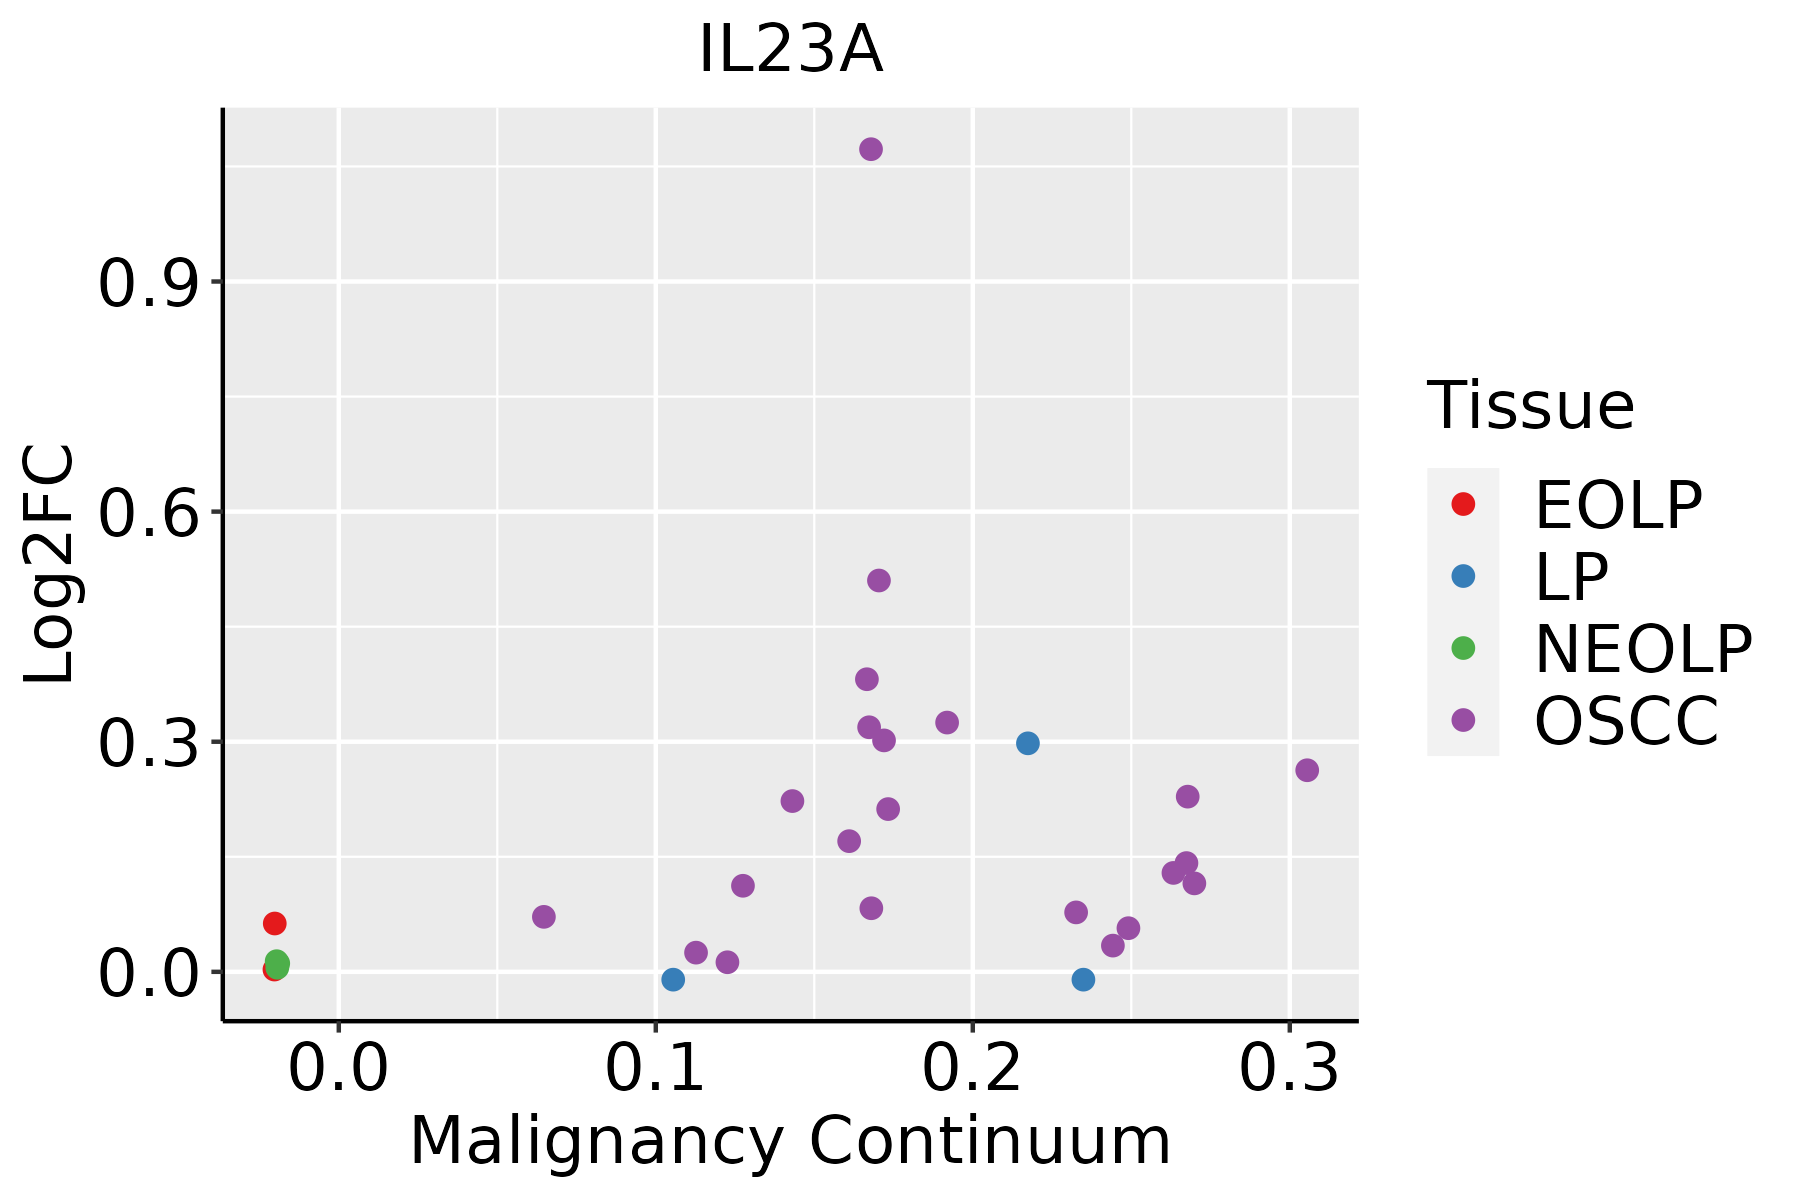 | EOLP: Erosive Oral lichen planus |
| LP: leukoplakia | ||
| NEOLP: Non-erosive oral lichen planus | ||
| OSCC: Oral squamous cell carcinoma |
| ∗log2FC in expression of this searched gene in stem-like cells from each diseased tissue sample relative to stem-like cells in normal samples in each tissue plotted against the malignancy continuum. Samples are colored based on if they are from different disease stage. |
Top |
Malignant transformation related pathway analysis |
| Find out the enriched GO biological processes and KEGG pathways involved in transition from healthy to precancer to cancer |
| Tissue | Disease Stage | Enriched GO biological Processes |
| Colorectum | AD |  |
| Colorectum | SER |  |
| Colorectum | MSS |  |
| Colorectum | MSI-H |  |
| Colorectum | FAP |  |
| ∗Top 15 enriched GO BP terms are showed in the bar plot of each disease state in each tissue. Each row represents a significant GO biological process which is colored according to the -log10(p.adjust). |
| Page: 1 2 3 4 5 6 7 8 9 |
| GO ID | Tissue | Disease Stage | Description | Gene Ratio | Bg Ratio | pvalue | p.adjust | Count |
| GO:00181084 | Esophagus | ESCC | peptidyl-tyrosine phosphorylation | 200/8552 | 375/18723 | 1.60e-03 | 7.45e-03 | 200 |
| GO:190210510 | Esophagus | ESCC | regulation of leukocyte differentiation | 152/8552 | 279/18723 | 1.82e-03 | 8.35e-03 | 152 |
| GO:190122414 | Esophagus | ESCC | positive regulation of NIK/NF-kappaB signaling | 44/8552 | 69/18723 | 1.86e-03 | 8.42e-03 | 44 |
| GO:00507303 | Esophagus | ESCC | regulation of peptidyl-tyrosine phosphorylation | 144/8552 | 264/18723 | 2.22e-03 | 9.78e-03 | 144 |
| GO:000181916 | Esophagus | ESCC | positive regulation of cytokine production | 244/8552 | 467/18723 | 2.29e-03 | 1.01e-02 | 244 |
| GO:000276311 | Esophagus | ESCC | positive regulation of myeloid leukocyte differentiation | 37/8552 | 58/18723 | 4.12e-03 | 1.64e-02 | 37 |
| GO:00456213 | Esophagus | ESCC | positive regulation of lymphocyte differentiation | 61/8552 | 104/18723 | 5.22e-03 | 1.97e-02 | 61 |
| GO:00380615 | Esophagus | ESCC | NIK/NF-kappaB signaling | 81/8552 | 143/18723 | 5.33e-03 | 2.00e-02 | 81 |
| GO:000276115 | Esophagus | ESCC | regulation of myeloid leukocyte differentiation | 69/8552 | 120/18723 | 6.00e-03 | 2.21e-02 | 69 |
| GO:005087015 | Esophagus | ESCC | positive regulation of T cell activation | 117/8552 | 216/18723 | 7.23e-03 | 2.62e-02 | 117 |
| GO:00302176 | Esophagus | ESCC | T cell differentiation | 137/8552 | 257/18723 | 8.09e-03 | 2.87e-02 | 137 |
| GO:190303916 | Esophagus | ESCC | positive regulation of leukocyte cell-cell adhesion | 128/8552 | 239/18723 | 8.40e-03 | 2.96e-02 | 128 |
| GO:000715918 | Esophagus | ESCC | leukocyte cell-cell adhesion | 192/8552 | 371/18723 | 1.03e-02 | 3.51e-02 | 192 |
| GO:190303717 | Esophagus | ESCC | regulation of leukocyte cell-cell adhesion | 174/8552 | 336/18723 | 1.36e-02 | 4.43e-02 | 174 |
| GO:00303165 | Esophagus | ESCC | osteoclast differentiation | 54/8552 | 94/18723 | 1.43e-02 | 4.65e-02 | 54 |
| GO:00300984 | Esophagus | ESCC | lymphocyte differentiation | 192/8552 | 374/18723 | 1.52e-02 | 4.93e-02 | 192 |
| GO:000961515 | Oral cavity | OSCC | response to virus | 215/7305 | 367/18723 | 1.63e-14 | 9.41e-13 | 215 |
| GO:003009920 | Oral cavity | OSCC | myeloid cell differentiation | 213/7305 | 381/18723 | 1.24e-11 | 4.42e-10 | 213 |
| GO:00516074 | Oral cavity | OSCC | defense response to virus | 154/7305 | 265/18723 | 1.96e-10 | 5.63e-09 | 154 |
| GO:01405464 | Oral cavity | OSCC | defense response to symbiont | 154/7305 | 265/18723 | 1.96e-10 | 5.63e-09 | 154 |
| Page: 1 2 3 4 5 |
| Pathway ID | Tissue | Disease Stage | Description | Gene Ratio | Bg Ratio | pvalue | p.adjust | qvalue | Count |
| hsa046259 | Esophagus | ESCC | C-type lectin receptor signaling pathway | 73/4205 | 104/8465 | 1.57e-05 | 7.98e-05 | 4.09e-05 | 73 |
| hsa051527 | Esophagus | ESCC | Tuberculosis | 111/4205 | 180/8465 | 7.14e-04 | 2.32e-03 | 1.19e-03 | 111 |
| hsa046599 | Esophagus | ESCC | Th17 cell differentiation | 68/4205 | 108/8465 | 3.53e-03 | 9.30e-03 | 4.76e-03 | 68 |
| hsa0532320 | Esophagus | ESCC | Rheumatoid arthritis | 59/4205 | 93/8465 | 4.98e-03 | 1.27e-02 | 6.52e-03 | 59 |
| hsa051339 | Esophagus | ESCC | Pertussis | 48/4205 | 76/8465 | 1.21e-02 | 2.77e-02 | 1.42e-02 | 48 |
| hsa0462513 | Esophagus | ESCC | C-type lectin receptor signaling pathway | 73/4205 | 104/8465 | 1.57e-05 | 7.98e-05 | 4.09e-05 | 73 |
| hsa0515212 | Esophagus | ESCC | Tuberculosis | 111/4205 | 180/8465 | 7.14e-04 | 2.32e-03 | 1.19e-03 | 111 |
| hsa0465914 | Esophagus | ESCC | Th17 cell differentiation | 68/4205 | 108/8465 | 3.53e-03 | 9.30e-03 | 4.76e-03 | 68 |
| hsa05323110 | Esophagus | ESCC | Rheumatoid arthritis | 59/4205 | 93/8465 | 4.98e-03 | 1.27e-02 | 6.52e-03 | 59 |
| hsa0513314 | Esophagus | ESCC | Pertussis | 48/4205 | 76/8465 | 1.21e-02 | 2.77e-02 | 1.42e-02 | 48 |
| hsa046258 | Oral cavity | OSCC | C-type lectin receptor signaling pathway | 73/3704 | 104/8465 | 3.83e-08 | 3.12e-07 | 1.59e-07 | 73 |
| hsa051526 | Oral cavity | OSCC | Tuberculosis | 105/3704 | 180/8465 | 5.00e-05 | 2.04e-04 | 1.04e-04 | 105 |
| hsa051338 | Oral cavity | OSCC | Pertussis | 50/3704 | 76/8465 | 8.34e-05 | 3.04e-04 | 1.55e-04 | 50 |
| hsa046598 | Oral cavity | OSCC | Th17 cell differentiation | 65/3704 | 108/8465 | 4.02e-04 | 1.25e-03 | 6.35e-04 | 65 |
| hsa0532318 | Oral cavity | OSCC | Rheumatoid arthritis | 56/3704 | 93/8465 | 9.72e-04 | 2.76e-03 | 1.40e-03 | 56 |
| hsa0462512 | Oral cavity | OSCC | C-type lectin receptor signaling pathway | 73/3704 | 104/8465 | 3.83e-08 | 3.12e-07 | 1.59e-07 | 73 |
| hsa0515211 | Oral cavity | OSCC | Tuberculosis | 105/3704 | 180/8465 | 5.00e-05 | 2.04e-04 | 1.04e-04 | 105 |
| hsa0513313 | Oral cavity | OSCC | Pertussis | 50/3704 | 76/8465 | 8.34e-05 | 3.04e-04 | 1.55e-04 | 50 |
| hsa0465913 | Oral cavity | OSCC | Th17 cell differentiation | 65/3704 | 108/8465 | 4.02e-04 | 1.25e-03 | 6.35e-04 | 65 |
| hsa0532319 | Oral cavity | OSCC | Rheumatoid arthritis | 56/3704 | 93/8465 | 9.72e-04 | 2.76e-03 | 1.40e-03 | 56 |
| Page: 1 |
Top |
Cell-cell communication analysis |
| Identification of potential cell-cell interactions between two cell types and their ligand-receptor pairs for different disease states |
| Ligand | Receptor | LRpair | Pathway | Tissue | Disease Stage |
| Page: 1 |
Top |
Single-cell gene regulatory network inference analysis |
| Find out the significant the regulons (TFs) and the target genes of each regulon across cell types for different disease states |
| TF | Cell Type | Tissue | Disease Stage | Target Gene | RSS | Regulon Activity |
| ∗The dot plots of a searched regulon are shown for all cell subpopulations in each disease state of each tissue based on the regulon specific score inferred using pySCENIC and by calculating the average expression. |
| Page: 1 |
Top |
Somatic mutation of malignant transformation related genes |
| Annotation of somatic variants for genes involved in malignant transformation |
| Hugo Symbol | Variant Class | Variant Classification | dbSNP RS | HGVSc | HGVSp | HGVSp Short | SWISSPROT | BIOTYPE | SIFT | PolyPhen | Tumor Sample Barcode | Tissue | Histology | Sex | Age | Stage | Therapy Types | Drugs | Outcome |
| IL23A | SNV | Missense_Mutation | c.146N>T | p.Pro49Leu | p.P49L | Q9NPF7 | protein_coding | tolerated(0.31) | benign(0.003) | TCGA-AC-A23H-01 | Breast | breast invasive carcinoma | Female | >=65 | I/II | Unknown | Unknown | PD | |
| IL23A | insertion | In_Frame_Ins | novel | c.541_542insTCTGCT | p.Ala181delinsValCysSer | p.A181delinsVCS | Q9NPF7 | protein_coding | TCGA-A2-A0EV-01 | Breast | breast invasive carcinoma | Female | >=65 | I/II | Unknown | Unknown | SD | ||
| IL23A | insertion | Frame_Shift_Ins | novel | c.543_544insCTGATAGCCCTGTGGGCCAGCTT | p.His182LeufsTer14 | p.H182Lfs*14 | Q9NPF7 | protein_coding | TCGA-A2-A0EV-01 | Breast | breast invasive carcinoma | Female | >=65 | I/II | Unknown | Unknown | SD | ||
| IL23A | SNV | Missense_Mutation | rs201997002 | c.317N>T | p.Ser106Leu | p.S106L | Q9NPF7 | protein_coding | deleterious(0) | probably_damaging(0.999) | TCGA-MY-A5BD-01 | Cervix | cervical & endocervical cancer | Female | <65 | I/II | Chemotherapy | cisplatin | CR |
| IL23A | insertion | In_Frame_Ins | novel | c.342_343insGGTTTA | p.Ser114_Leu115insGlyLeu | p.S114_L115insGL | Q9NPF7 | protein_coding | TCGA-AM-5820-01 | Colorectum | colon adenocarcinoma | Female | <65 | I/II | Unknown | Unknown | SD | ||
| IL23A | insertion | Frame_Shift_Ins | novel | c.343_344insCA | p.Leu115ProfsTer62 | p.L115Pfs*62 | Q9NPF7 | protein_coding | TCGA-AM-5820-01 | Colorectum | colon adenocarcinoma | Female | <65 | I/II | Unknown | Unknown | SD | ||
| IL23A | SNV | Missense_Mutation | c.140N>T | p.Ala47Val | p.A47V | Q9NPF7 | protein_coding | tolerated(0.2) | benign(0.048) | TCGA-AP-A051-01 | Endometrium | uterine corpus endometrioid carcinoma | Female | >=65 | I/II | Unknown | Unknown | SD | |
| IL23A | SNV | Missense_Mutation | c.492N>C | p.Lys164Asn | p.K164N | Q9NPF7 | protein_coding | tolerated(0.06) | probably_damaging(0.997) | TCGA-AP-A0LM-01 | Endometrium | uterine corpus endometrioid carcinoma | Female | <65 | III/IV | Chemotherapy | cisplatin | SD | |
| IL23A | SNV | Missense_Mutation | novel | c.280N>A | p.His94Asn | p.H94N | Q9NPF7 | protein_coding | tolerated(0.13) | benign(0.333) | TCGA-AP-A1DK-01 | Endometrium | uterine corpus endometrioid carcinoma | Female | <65 | I/II | Unknown | Unknown | SD |
| IL23A | SNV | Missense_Mutation | rs199760416 | c.533N>A | p.Arg178Gln | p.R178Q | Q9NPF7 | protein_coding | deleterious(0) | probably_damaging(1) | TCGA-B5-A11E-01 | Endometrium | uterine corpus endometrioid carcinoma | Female | <65 | I/II | Unknown | Unknown | SD |
| Page: 1 2 |
Top |
Related drugs of malignant transformation related genes |
| Identification of chemicals and drugs interact with genes involved in malignant transfromation |
| (DGIdb 4.0) |
| Entrez ID | Symbol | Category | Interaction Types | Drug Claim Name | Drug Name | PMIDs |
| 51561 | IL23A | DRUGGABLE GENOME | BRIAKINUMAB | BRIAKINUMAB | ||
| 51561 | IL23A | DRUGGABLE GENOME | Ustekinumab | USTEKINUMAB | ||
| 51561 | IL23A | DRUGGABLE GENOME | ustekinumab | USTEKINUMAB | ||
| 51561 | IL23A | DRUGGABLE GENOME | inhibitor | CHEMBL1742995 | BRIAKINUMAB | |
| 51561 | IL23A | DRUGGABLE GENOME | CNTO 1275 | |||
| 51561 | IL23A | DRUGGABLE GENOME | AMG-139 | BRAZIKUMAB | ||
| 51561 | IL23A | DRUGGABLE GENOME | USTEKINUMAB | USTEKINUMAB | ||
| 51561 | IL23A | DRUGGABLE GENOME | Ustekinumab | USTEKINUMAB | ||
| 51561 | IL23A | DRUGGABLE GENOME | USTEKINUMAB | USTEKINUMAB | ||
| 51561 | IL23A | DRUGGABLE GENOME | Tildrakizumab | TILDRAKIZUMAB |
| Page: 1 2 |

Copyright 2023-Present -The University of Texas Health Science Center at Houston |