
|
|||||
|
 | |
| |
| |
| |
| |
| |
|
Gene: IER3 |
Gene summary for IER3 |
| Gene information | Species | Human | Gene symbol | IER3 | Gene ID | 8870 |
| Gene name | immediate early response 3 | |
| Gene Alias | DIF-2 | |
| Cytomap | 6p21.33 | |
| Gene Type | protein-coding | GO ID | GO:0006915 | UniProtAcc | A0A1U9X7X2 |
Top |
Malignant transformation analysis |
| Identification of the aberrant gene expression in precancerous and cancerous lesions by comparing the gene expression of stem-like cells in diseased tissues with normal stem cells |
| Entrez ID | Symbol | Replicates | Species | Organ | Tissue | Adj P-value | Log2FC | Malignancy |
| 8870 | IER3 | GSM4909281 | Human | Breast | IDC | 2.69e-24 | -7.91e-01 | 0.21 |
| 8870 | IER3 | GSM4909285 | Human | Breast | IDC | 2.45e-10 | -3.83e-01 | 0.21 |
| 8870 | IER3 | GSM4909286 | Human | Breast | IDC | 2.16e-53 | -1.09e+00 | 0.1081 |
| 8870 | IER3 | GSM4909287 | Human | Breast | IDC | 2.09e-06 | -5.07e-01 | 0.2057 |
| 8870 | IER3 | GSM4909290 | Human | Breast | IDC | 3.28e-08 | -5.47e-01 | 0.2096 |
| 8870 | IER3 | GSM4909291 | Human | Breast | IDC | 1.70e-06 | -6.04e-01 | 0.1753 |
| 8870 | IER3 | GSM4909294 | Human | Breast | IDC | 1.01e-23 | -7.67e-01 | 0.2022 |
| 8870 | IER3 | GSM4909296 | Human | Breast | IDC | 4.80e-19 | -6.09e-01 | 0.1524 |
| 8870 | IER3 | GSM4909297 | Human | Breast | IDC | 4.59e-09 | -2.42e-01 | 0.1517 |
| 8870 | IER3 | GSM4909298 | Human | Breast | IDC | 2.17e-11 | -5.38e-01 | 0.1551 |
| 8870 | IER3 | GSM4909302 | Human | Breast | IDC | 4.50e-30 | -9.36e-01 | 0.1545 |
| 8870 | IER3 | GSM4909304 | Human | Breast | IDC | 1.08e-08 | -5.41e-01 | 0.1636 |
| 8870 | IER3 | GSM4909306 | Human | Breast | IDC | 4.24e-04 | 2.93e-01 | 0.1564 |
| 8870 | IER3 | GSM4909308 | Human | Breast | IDC | 4.14e-03 | 2.70e-01 | 0.158 |
| 8870 | IER3 | GSM4909311 | Human | Breast | IDC | 1.46e-21 | -3.13e-01 | 0.1534 |
| 8870 | IER3 | GSM4909312 | Human | Breast | IDC | 4.68e-02 | -1.80e-01 | 0.1552 |
| 8870 | IER3 | GSM4909315 | Human | Breast | IDC | 1.02e-26 | -7.96e-01 | 0.21 |
| 8870 | IER3 | GSM4909316 | Human | Breast | IDC | 1.93e-13 | -1.02e+00 | 0.21 |
| 8870 | IER3 | GSM4909319 | Human | Breast | IDC | 7.51e-39 | 2.80e-01 | 0.1563 |
| 8870 | IER3 | GSM4909320 | Human | Breast | IDC | 1.67e-05 | -6.83e-01 | 0.1575 |
| Page: 1 2 3 4 5 6 7 8 9 10 11 12 13 |
| Tissue | Expression Dynamics | Abbreviation |
| Breast | 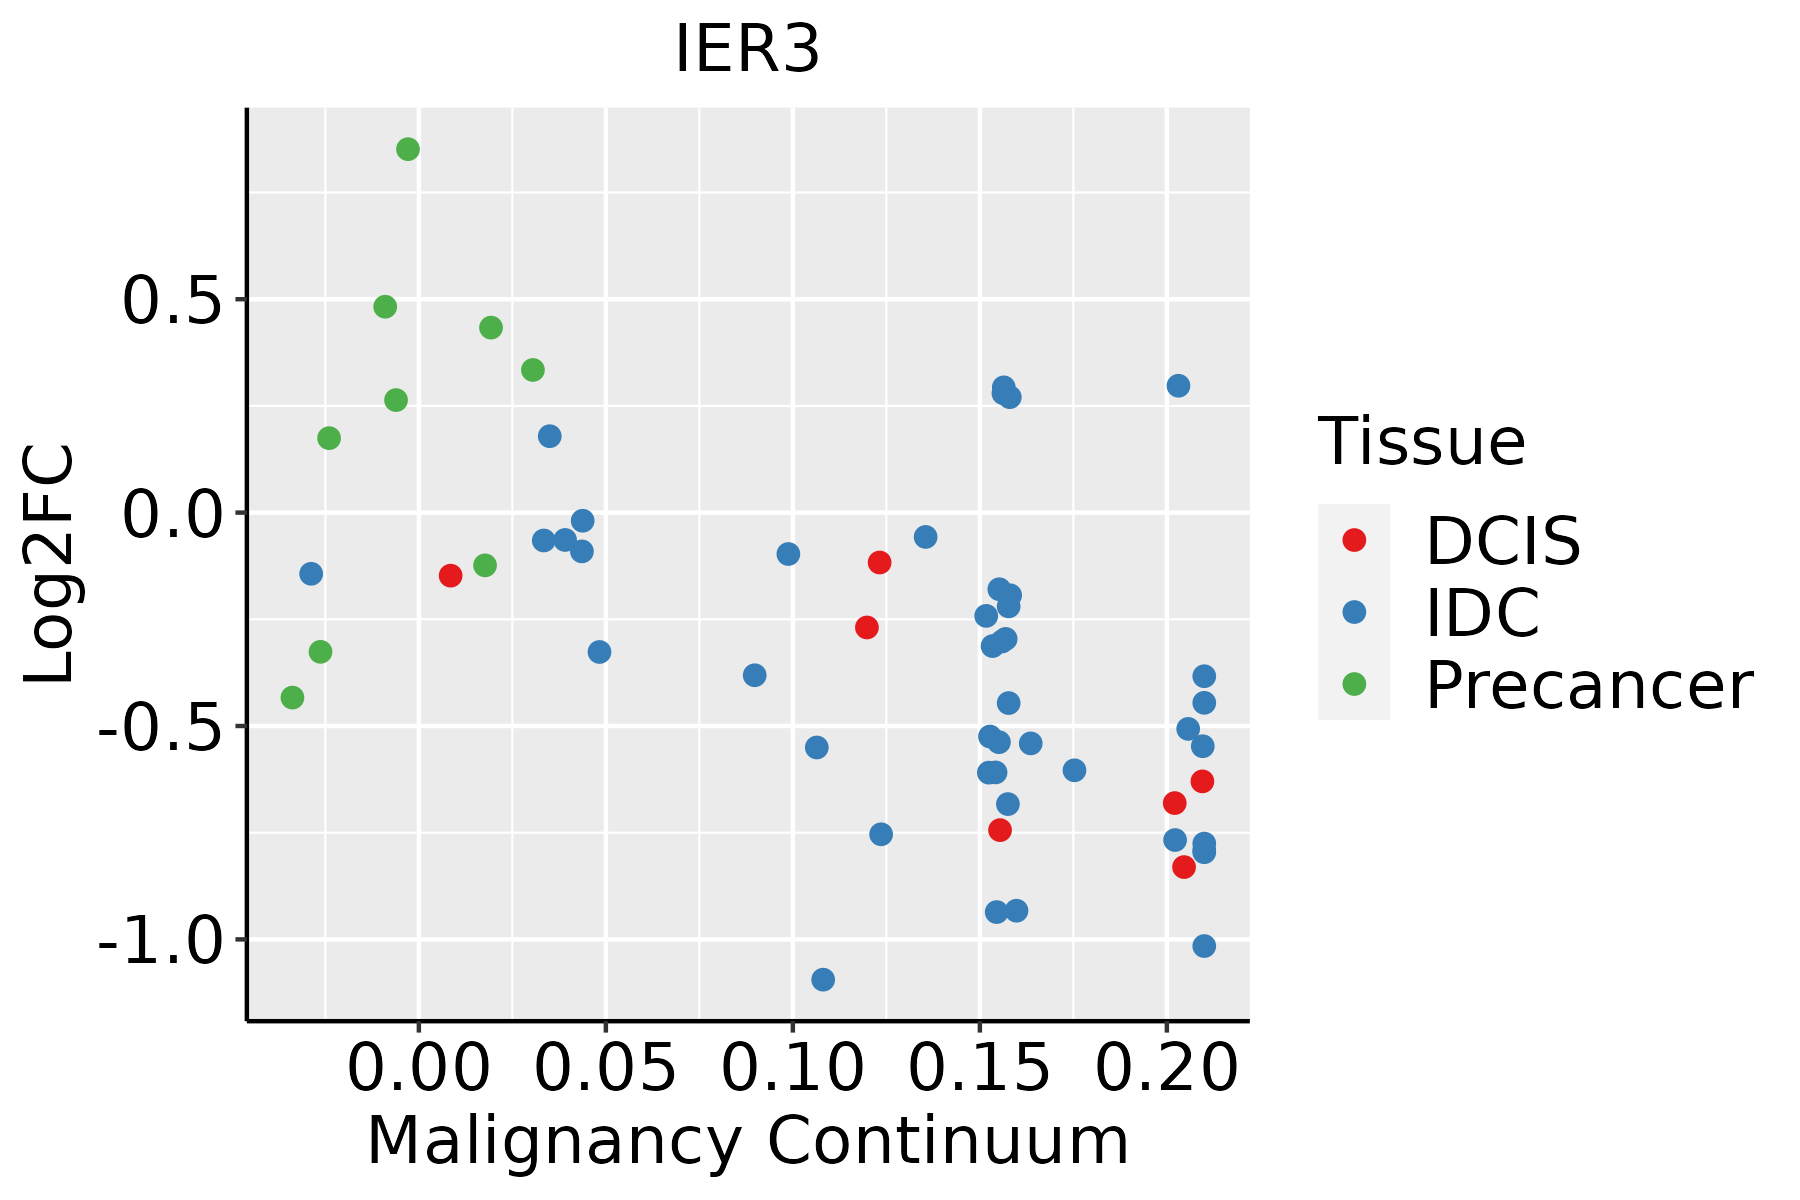 | IDC: Invasive ductal carcinoma |
| DCIS: Ductal carcinoma in situ | ||
| Precancer(BRCA1-mut): Precancerous lesion from BRCA1 mutation carriers | ||
| Cervix | 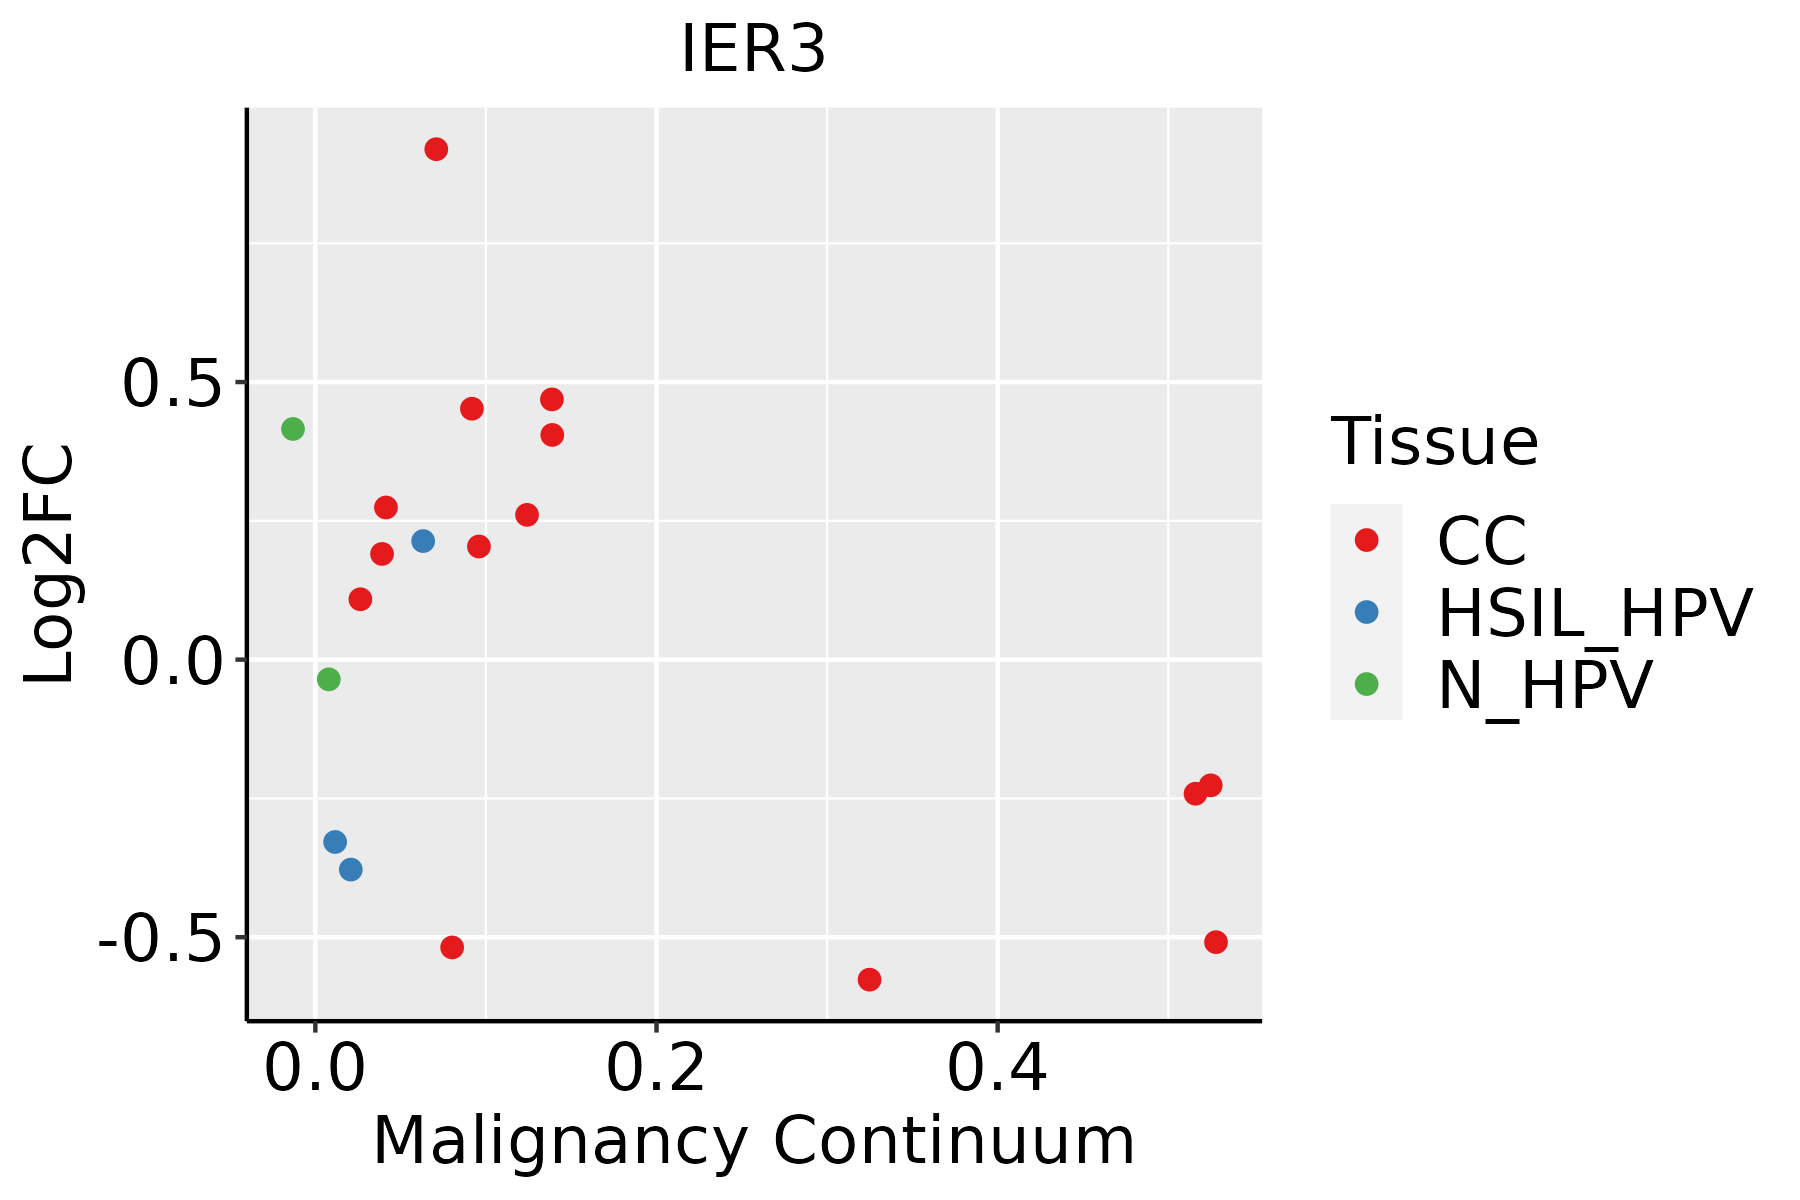 | CC: Cervix cancer |
| HSIL_HPV: HPV-infected high-grade squamous intraepithelial lesions | ||
| N_HPV: HPV-infected normal cervix | ||
| Endometrium | 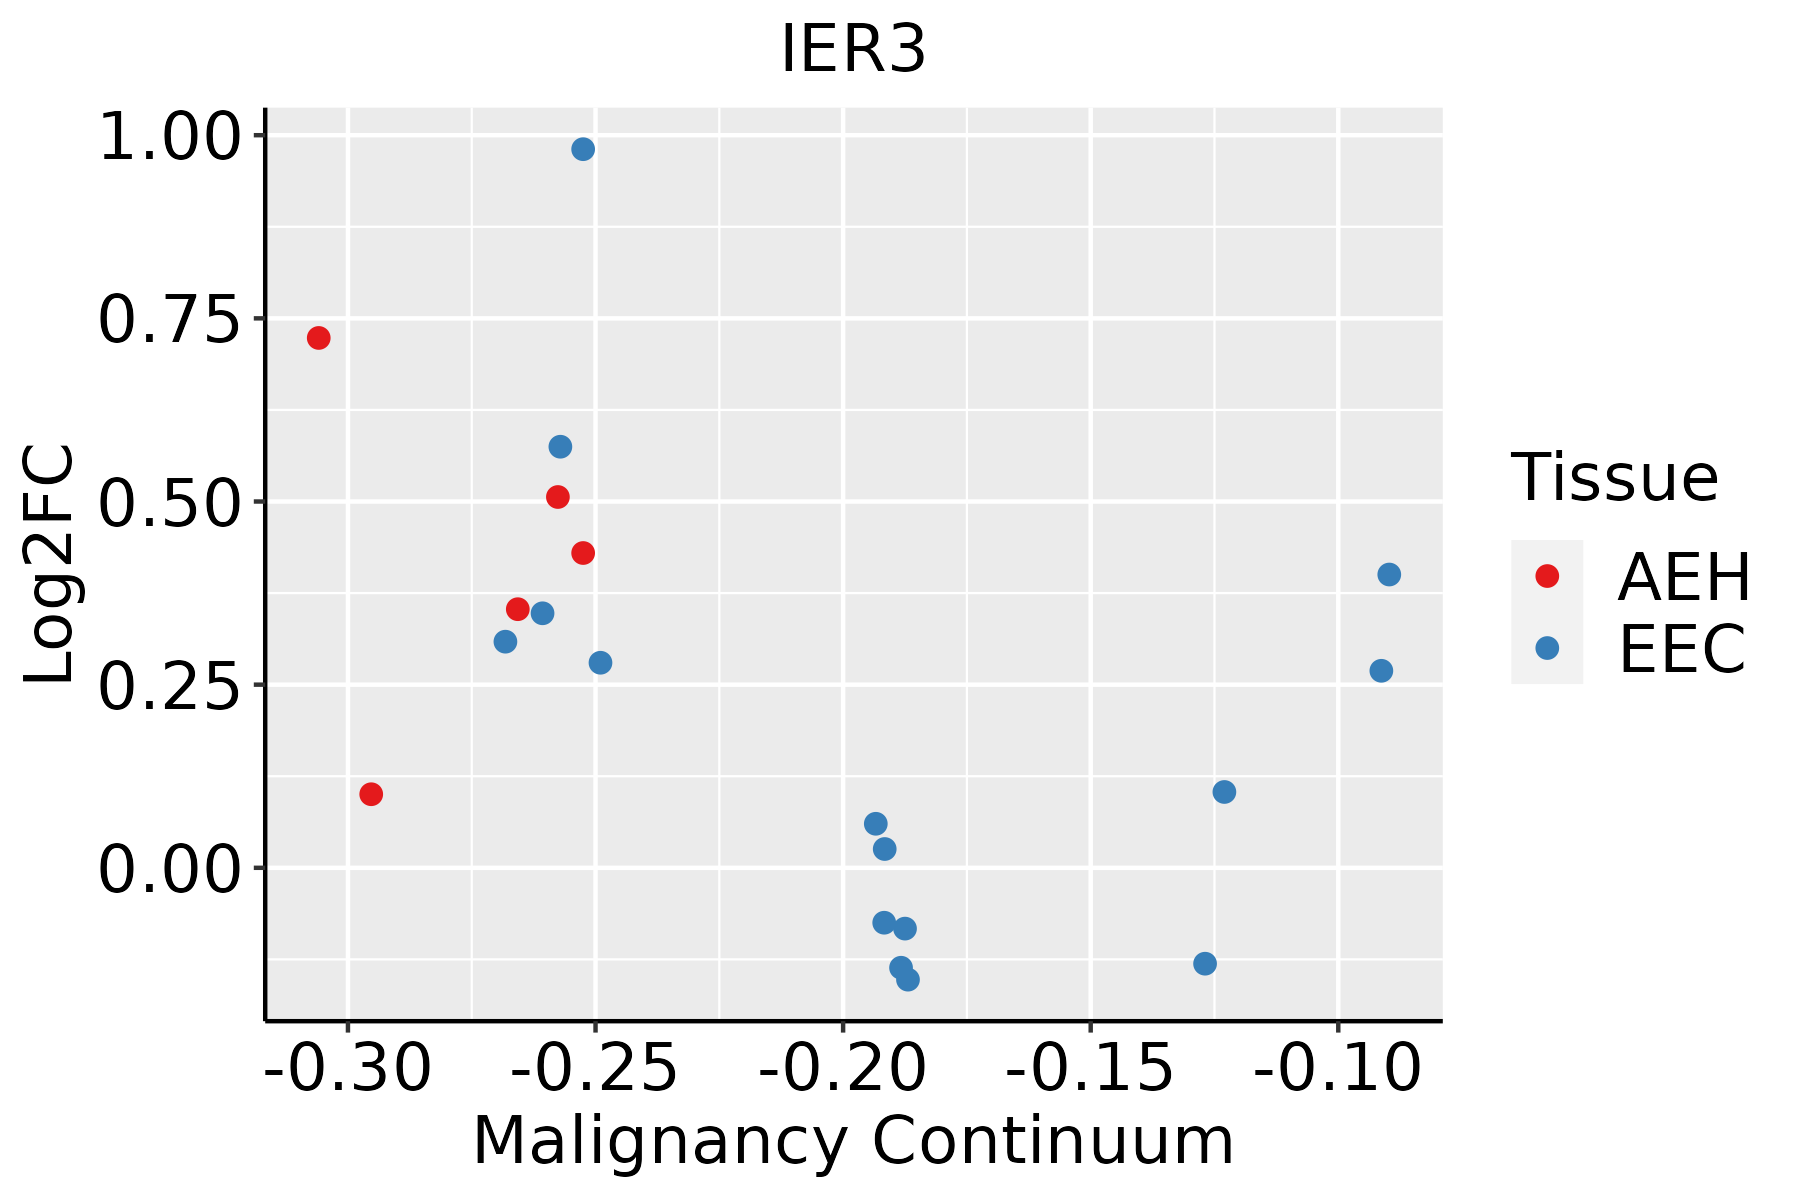 | AEH: Atypical endometrial hyperplasia |
| EEC: Endometrioid Cancer | ||
| Esophagus | 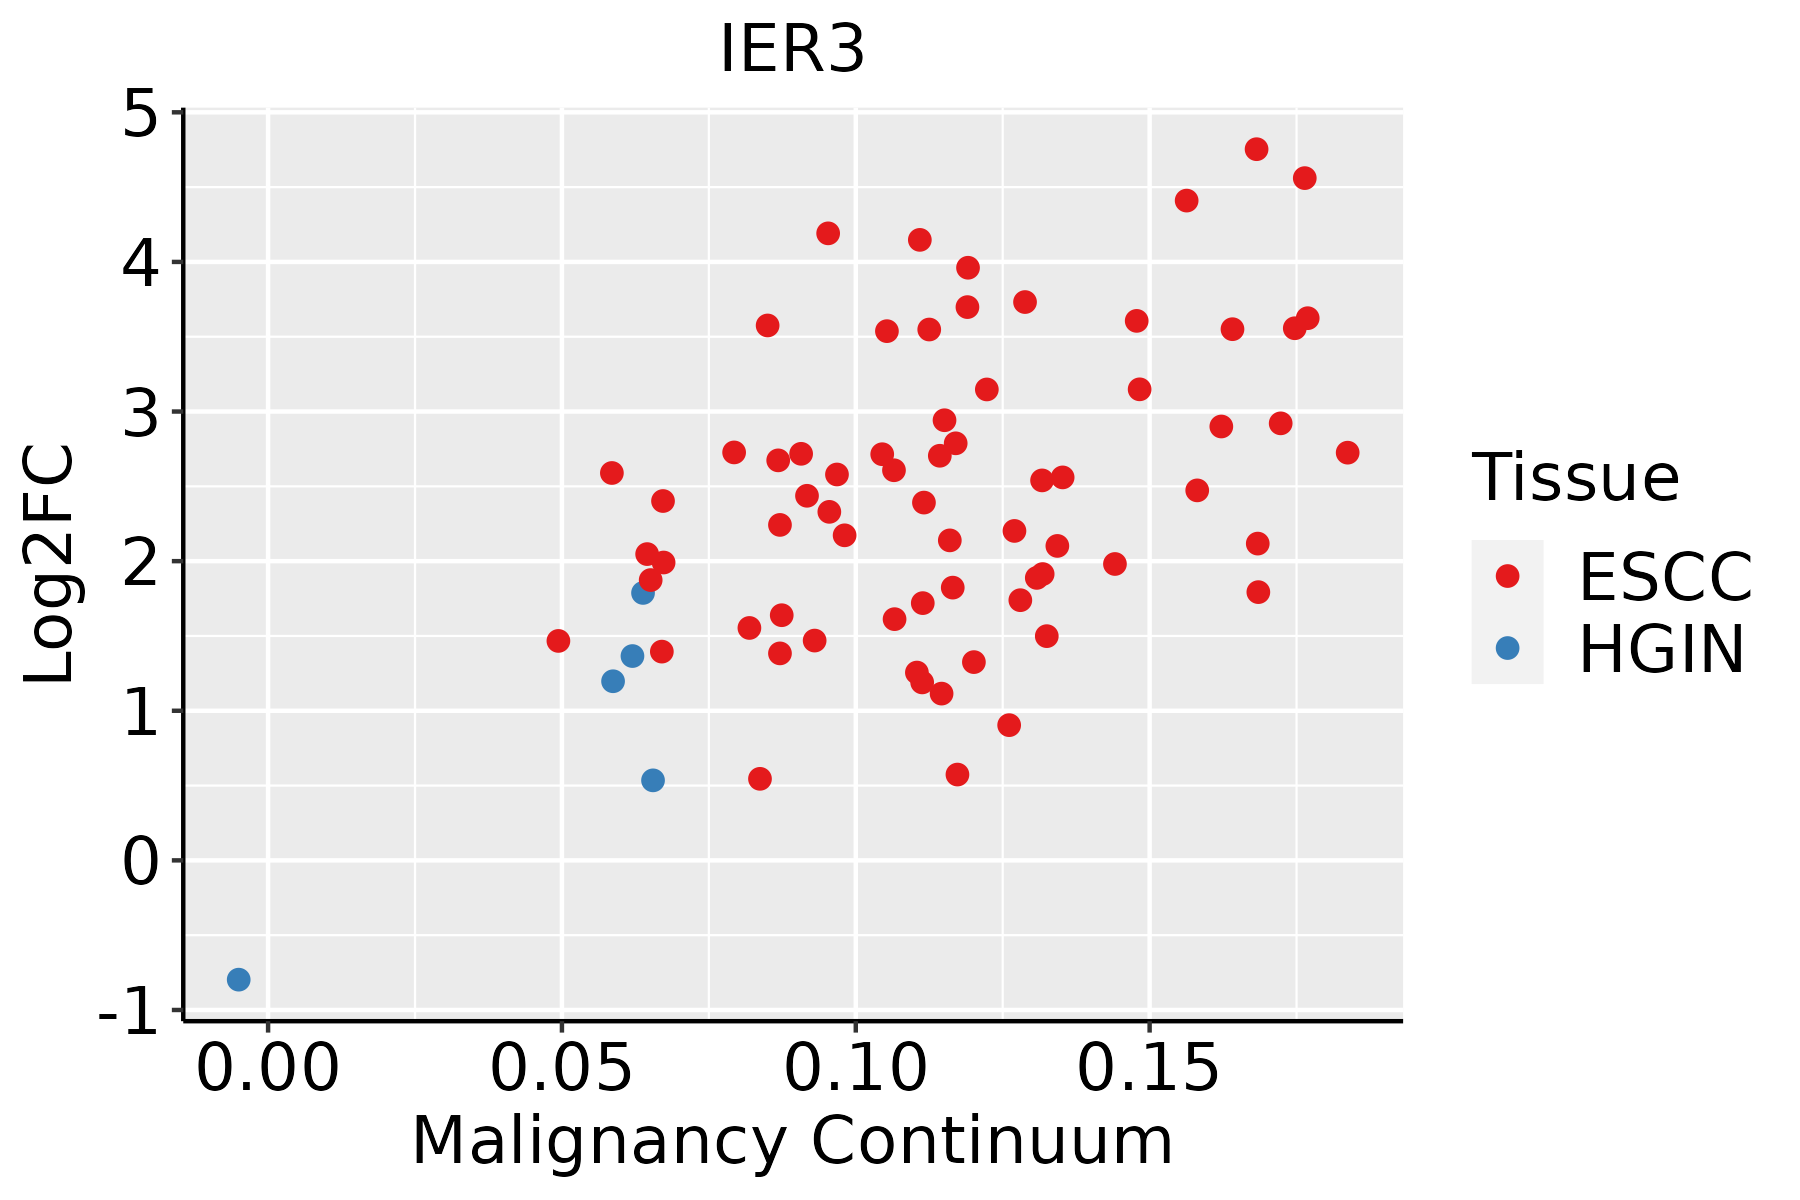 | ESCC: Esophageal squamous cell carcinoma |
| HGIN: High-grade intraepithelial neoplasias | ||
| LGIN: Low-grade intraepithelial neoplasias | ||
| GC |  | CAG: Chronic atrophic gastritis |
| CAG with IM: Chronic atrophic gastritis with intestinal metaplasia | ||
| CSG: Chronic superficial gastritis | ||
| GC: Gastric cancer | ||
| SIM: Severe intestinal metaplasia | ||
| WIM: Wild intestinal metaplasia | ||
| Liver | 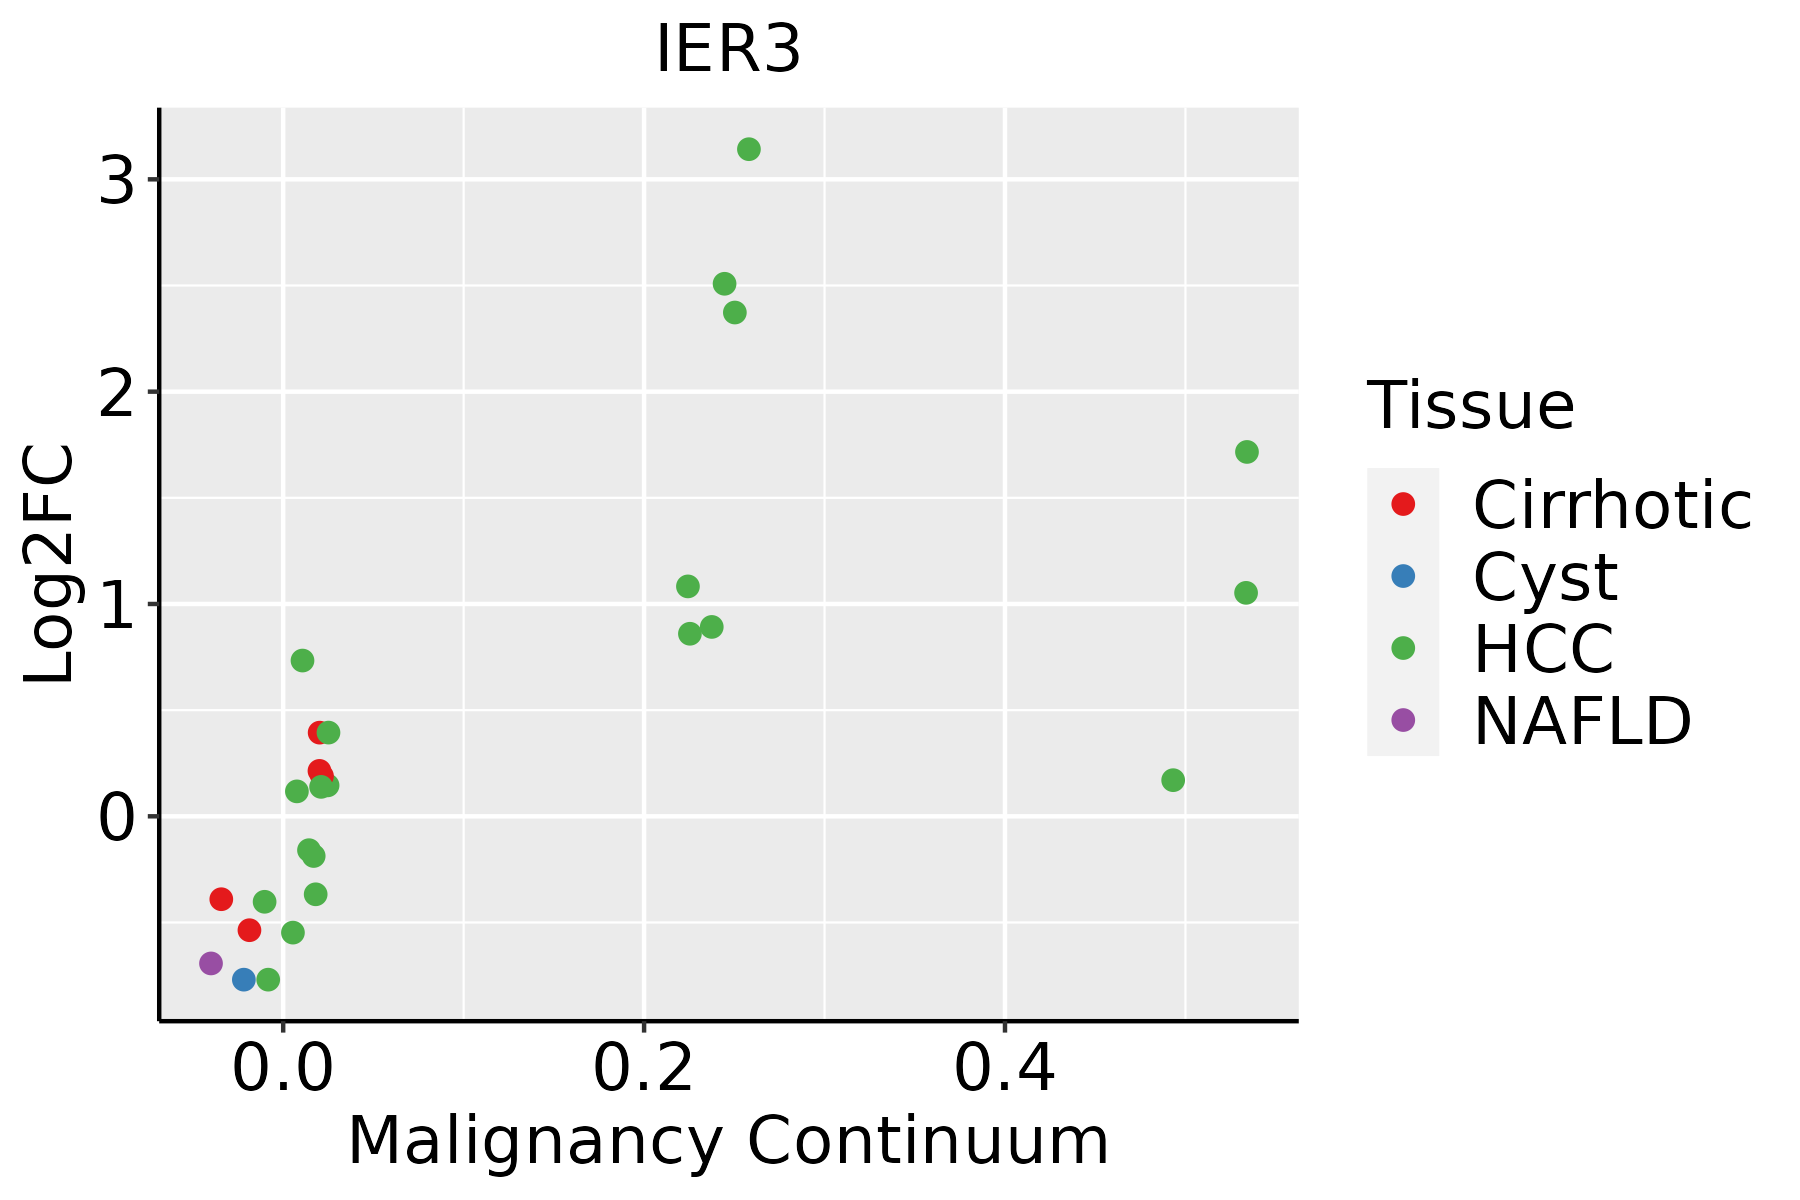 | HCC: Hepatocellular carcinoma |
| NAFLD: Non-alcoholic fatty liver disease | ||
| Lung | 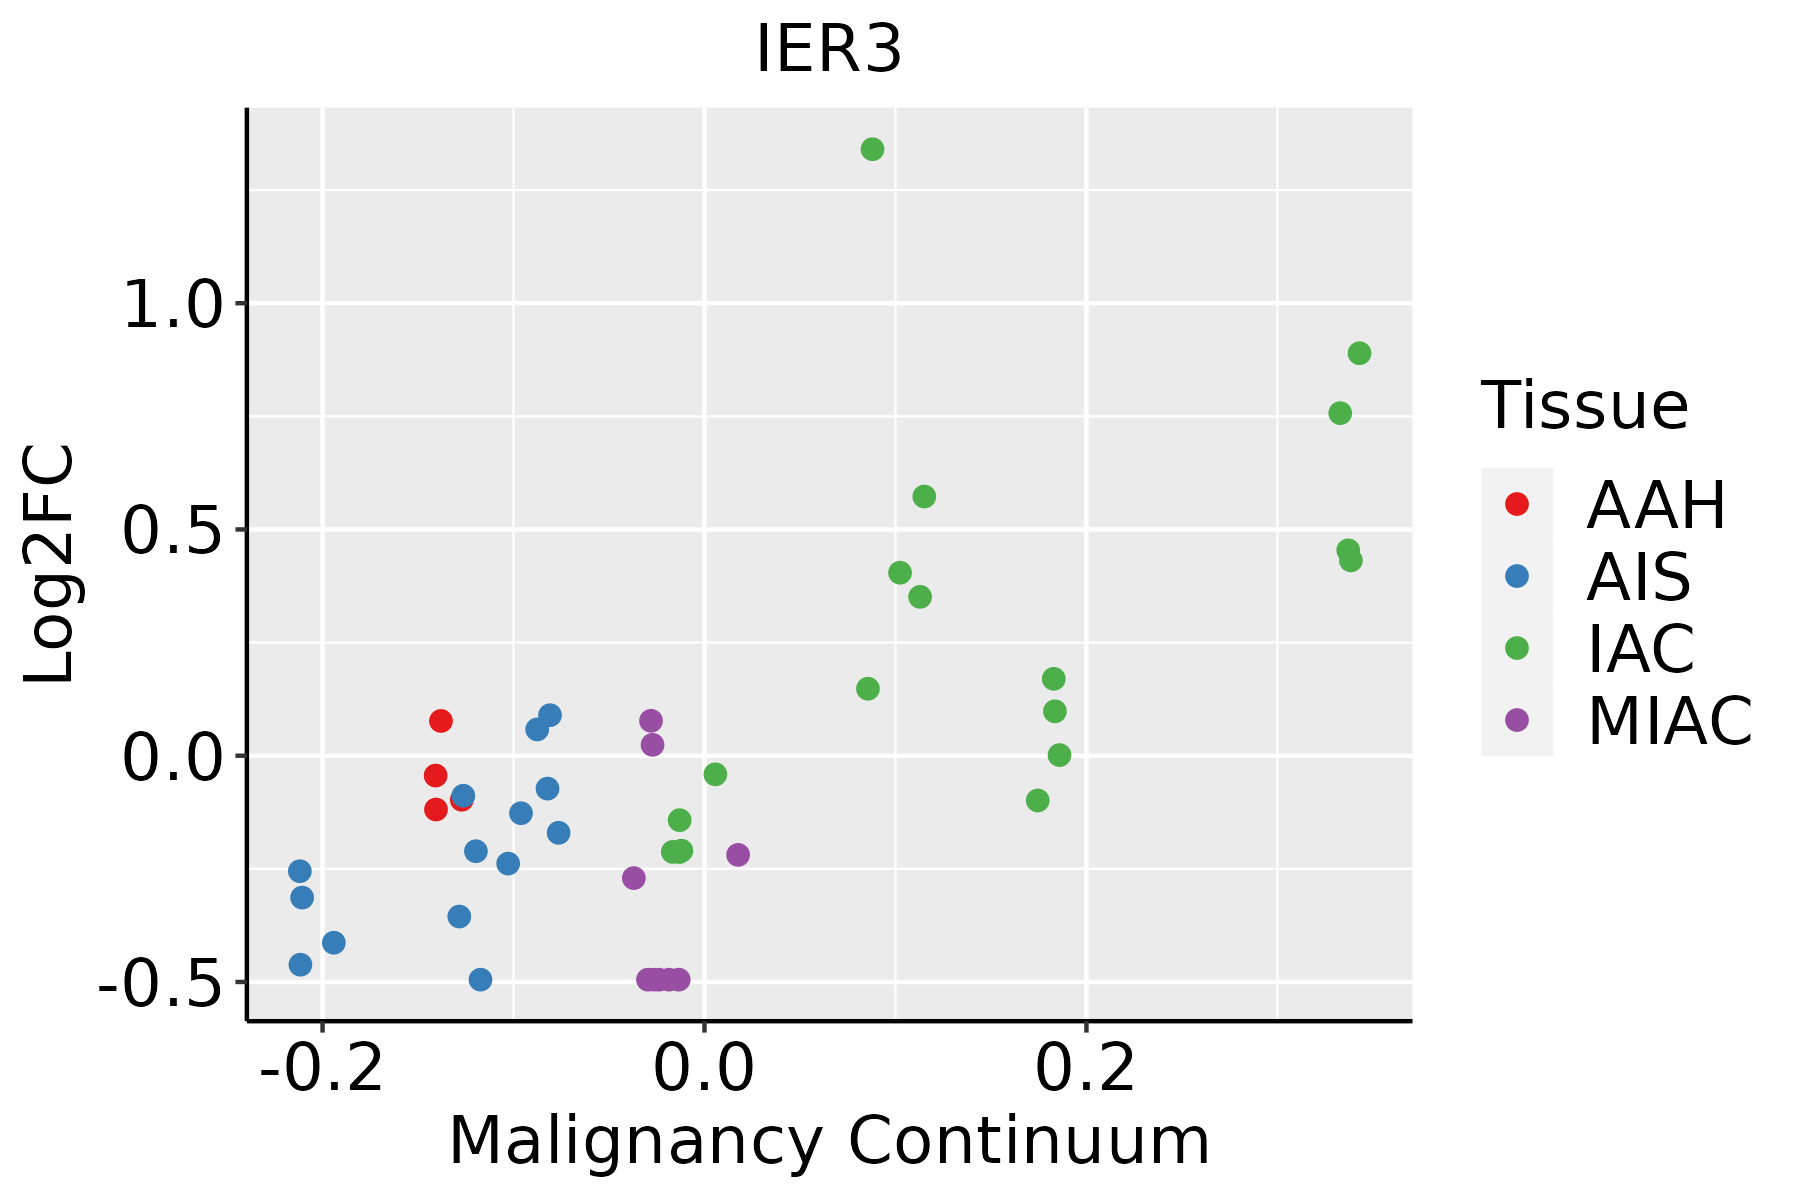 | AAH: Atypical adenomatous hyperplasia |
| AIS: Adenocarcinoma in situ | ||
| IAC: Invasive lung adenocarcinoma | ||
| MIA: Minimally invasive adenocarcinoma | ||
| Oral Cavity | 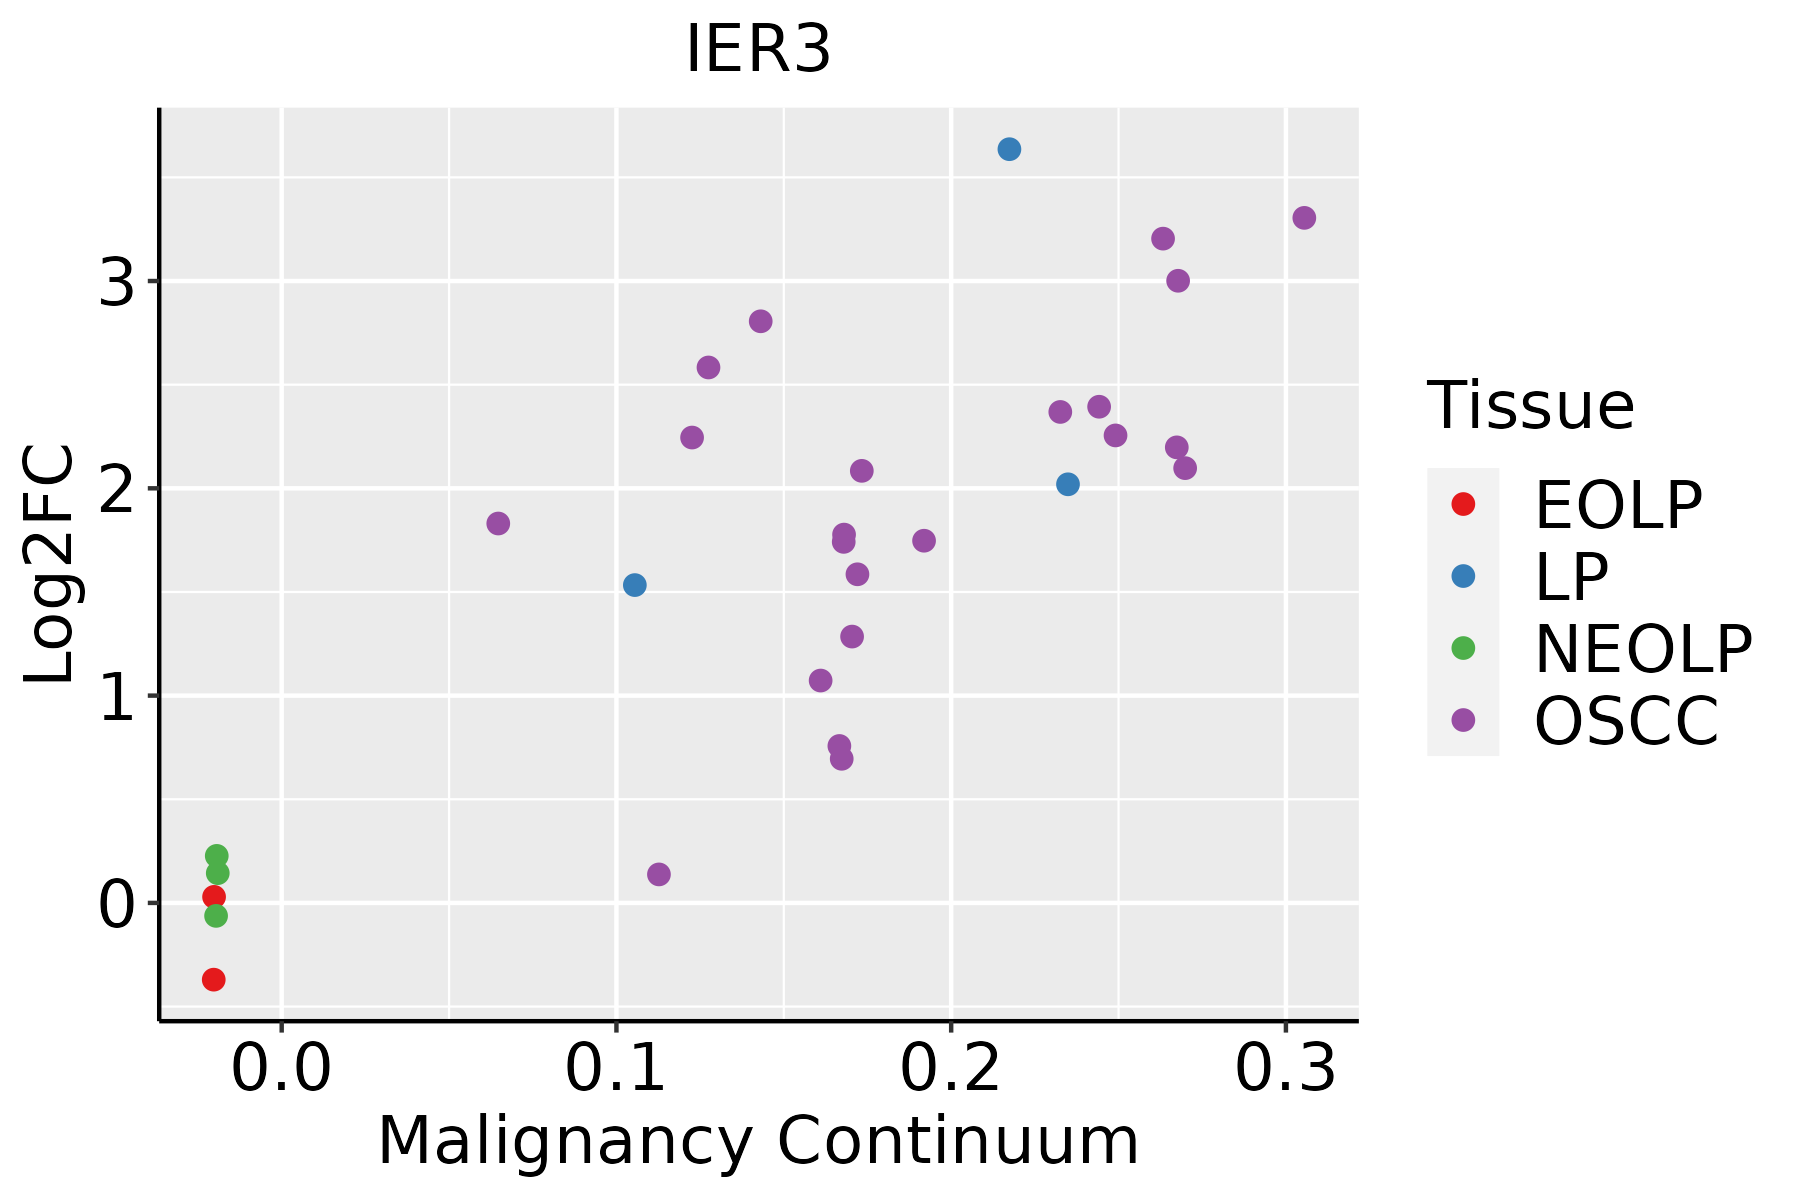 | EOLP: Erosive Oral lichen planus |
| LP: leukoplakia | ||
| NEOLP: Non-erosive oral lichen planus | ||
| OSCC: Oral squamous cell carcinoma | ||
| Prostate | 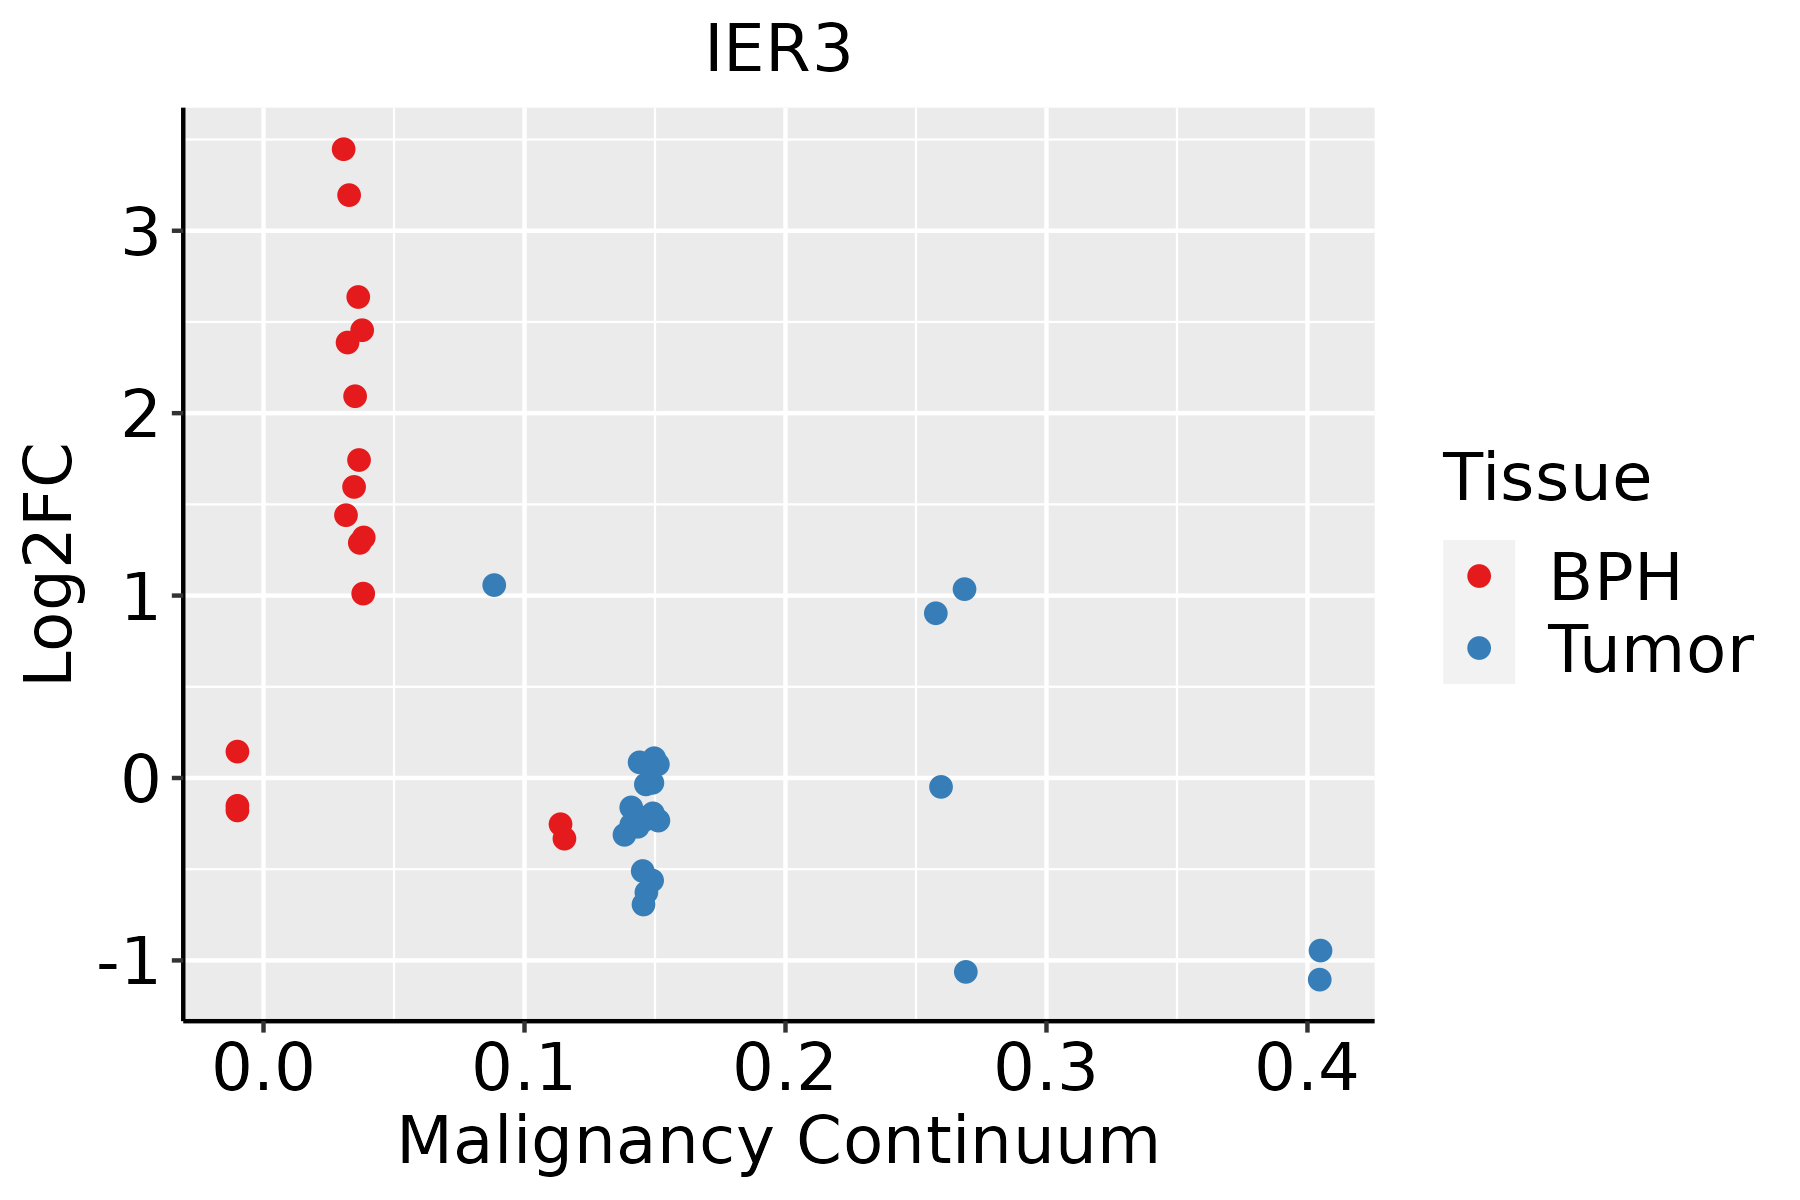 | BPH: Benign Prostatic Hyperplasia |
| Skin | 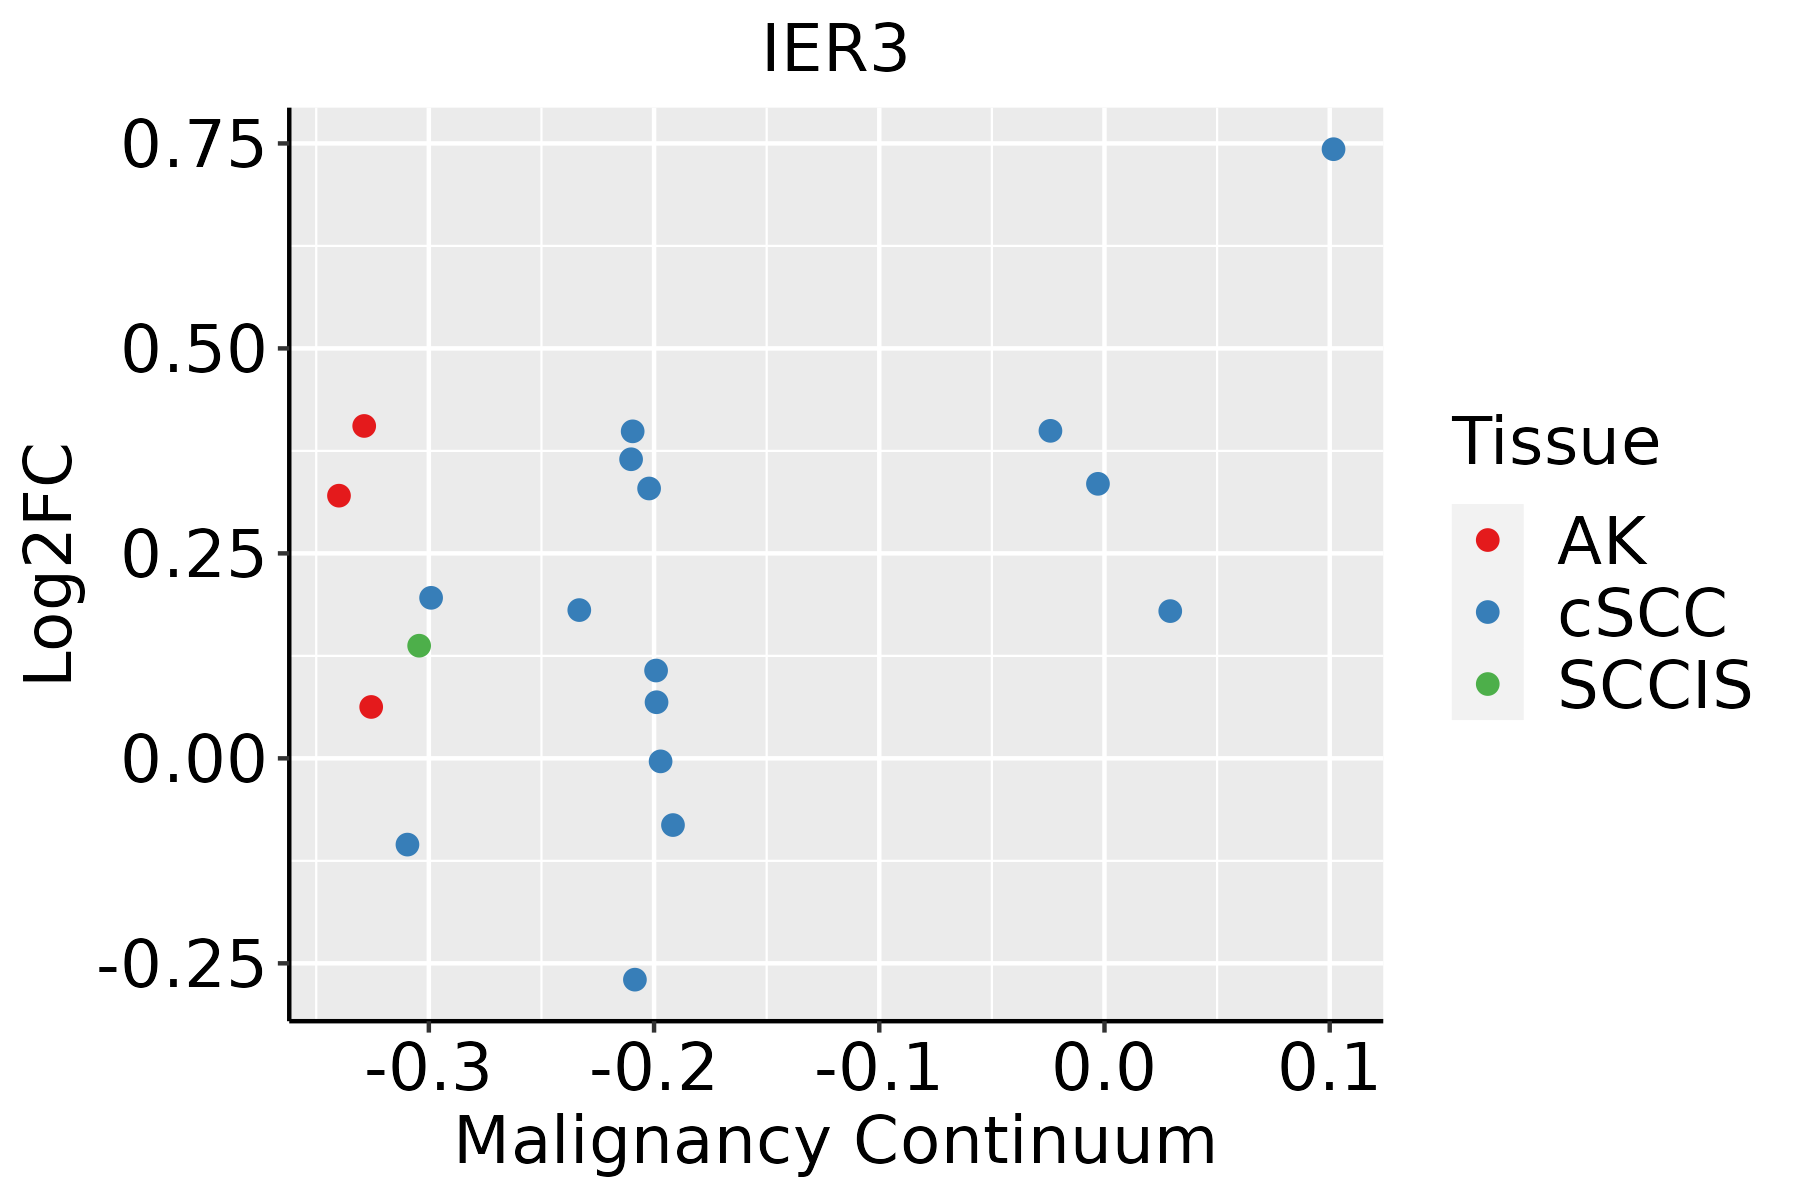 | AK: Actinic keratosis |
| cSCC: Cutaneous squamous cell carcinoma | ||
| SCCIS:squamous cell carcinoma in situ | ||
| Thyroid |  | ATC: Anaplastic thyroid cancer |
| HT: Hashimoto's thyroiditis | ||
| PTC: Papillary thyroid cancer |
| ∗log2FC in expression of this searched gene in stem-like cells from each diseased tissue sample relative to stem-like cells in normal samples in each tissue plotted against the malignancy continuum. Samples are colored based on if they are from different disease stage. |
Top |
Malignant transformation related pathway analysis |
| Find out the enriched GO biological processes and KEGG pathways involved in transition from healthy to precancer to cancer |
| Tissue | Disease Stage | Enriched GO biological Processes |
| Colorectum | AD |  |
| Colorectum | SER |  |
| Colorectum | MSS |  |
| Colorectum | MSI-H |  |
| Colorectum | FAP |  |
| ∗Top 15 enriched GO BP terms are showed in the bar plot of each disease state in each tissue. Each row represents a significant GO biological process which is colored according to the -log10(p.adjust). |
| Page: 1 2 3 4 5 6 7 8 9 |
| GO ID | Tissue | Disease Stage | Description | Gene Ratio | Bg Ratio | pvalue | p.adjust | Count |
| GO:005071412 | Endometrium | EEC | positive regulation of protein secretion | 28/2168 | 137/18723 | 1.89e-03 | 1.45e-02 | 28 |
| GO:200102014 | Endometrium | EEC | regulation of response to DNA damage stimulus | 40/2168 | 219/18723 | 2.30e-03 | 1.70e-02 | 40 |
| GO:007169213 | Endometrium | EEC | protein localization to extracellular region | 59/2168 | 368/18723 | 5.98e-03 | 3.56e-02 | 59 |
| GO:00352651 | Endometrium | EEC | organ growth | 32/2168 | 178/18723 | 7.54e-03 | 4.22e-02 | 32 |
| GO:000930614 | Endometrium | EEC | protein secretion | 57/2168 | 359/18723 | 8.30e-03 | 4.57e-02 | 57 |
| GO:003559214 | Endometrium | EEC | establishment of protein localization to extracellular region | 57/2168 | 360/18723 | 8.78e-03 | 4.74e-02 | 57 |
| GO:004819317 | Esophagus | HGIN | Golgi vesicle transport | 83/2587 | 296/18723 | 8.59e-11 | 8.89e-09 | 83 |
| GO:00068889 | Esophagus | HGIN | endoplasmic reticulum to Golgi vesicle-mediated transport | 40/2587 | 130/18723 | 4.67e-07 | 2.07e-05 | 40 |
| GO:190495120 | Esophagus | HGIN | positive regulation of establishment of protein localization | 73/2587 | 319/18723 | 6.99e-06 | 2.14e-04 | 73 |
| GO:200102019 | Esophagus | HGIN | regulation of response to DNA damage stimulus | 52/2587 | 219/18723 | 5.00e-05 | 1.19e-03 | 52 |
| GO:005122220 | Esophagus | HGIN | positive regulation of protein transport | 67/2587 | 303/18723 | 5.13e-05 | 1.22e-03 | 67 |
| GO:004819318 | Esophagus | ESCC | Golgi vesicle transport | 231/8552 | 296/18723 | 1.82e-30 | 9.63e-28 | 231 |
| GO:1904951111 | Esophagus | ESCC | positive regulation of establishment of protein localization | 216/8552 | 319/18723 | 1.01e-15 | 6.86e-14 | 216 |
| GO:0051222111 | Esophagus | ESCC | positive regulation of protein transport | 204/8552 | 303/18723 | 1.56e-14 | 8.38e-13 | 204 |
| GO:000688815 | Esophagus | ESCC | endoplasmic reticulum to Golgi vesicle-mediated transport | 102/8552 | 130/18723 | 1.73e-14 | 9.22e-13 | 102 |
| GO:2001020110 | Esophagus | ESCC | regulation of response to DNA damage stimulus | 145/8552 | 219/18723 | 5.97e-10 | 1.50e-08 | 145 |
| GO:00301984 | Esophagus | ESCC | extracellular matrix organization | 171/8552 | 301/18723 | 6.08e-05 | 4.67e-04 | 171 |
| GO:00430624 | Esophagus | ESCC | extracellular structure organization | 171/8552 | 302/18723 | 7.73e-05 | 5.76e-04 | 171 |
| GO:00452294 | Esophagus | ESCC | external encapsulating structure organization | 172/8552 | 304/18723 | 7.80e-05 | 5.80e-04 | 172 |
| GO:19030553 | Esophagus | ESCC | positive regulation of extracellular matrix organization | 20/8552 | 25/18723 | 4.81e-04 | 2.69e-03 | 20 |
| Page: 1 2 3 4 5 6 7 |
| Pathway ID | Tissue | Disease Stage | Description | Gene Ratio | Bg Ratio | pvalue | p.adjust | qvalue | Count |
| Page: 1 |
Top |
Cell-cell communication analysis |
| Identification of potential cell-cell interactions between two cell types and their ligand-receptor pairs for different disease states |
| Ligand | Receptor | LRpair | Pathway | Tissue | Disease Stage |
| Page: 1 |
Top |
Single-cell gene regulatory network inference analysis |
| Find out the significant the regulons (TFs) and the target genes of each regulon across cell types for different disease states |
| TF | Cell Type | Tissue | Disease Stage | Target Gene | RSS | Regulon Activity |
| ∗The dot plots of a searched regulon are shown for all cell subpopulations in each disease state of each tissue based on the regulon specific score inferred using pySCENIC and by calculating the average expression. |
| Page: 1 |
Top |
Somatic mutation of malignant transformation related genes |
| Annotation of somatic variants for genes involved in malignant transformation |
| Hugo Symbol | Variant Class | Variant Classification | dbSNP RS | HGVSc | HGVSp | HGVSp Short | SWISSPROT | BIOTYPE | SIFT | PolyPhen | Tumor Sample Barcode | Tissue | Histology | Sex | Age | Stage | Therapy Types | Drugs | Outcome |
| IER3 | SNV | Missense_Mutation | c.371C>T | p.Pro124Leu | p.P124L | P46695 | protein_coding | deleterious(0.05) | benign(0.056) | TCGA-MU-A51Y-01 | Cervix | cervical & endocervical cancer | Female | <65 | I/II | Unknown | Unknown | SD | |
| IER3 | SNV | Missense_Mutation | c.7C>T | p.His3Tyr | p.H3Y | P46695 | protein_coding | tolerated(0.36) | benign(0.442) | TCGA-DD-A73D-01 | Liver | liver hepatocellular carcinoma | Female | >=65 | I/II | Unknown | Unknown | PD | |
| IER3 | SNV | Missense_Mutation | c.194N>C | p.Val65Ala | p.V65A | P46695 | protein_coding | deleterious(0.01) | probably_damaging(0.994) | TCGA-CG-5721-01 | Stomach | stomach adenocarcinoma | Male | <65 | III/IV | Unknown | Unknown | SD |
| Page: 1 |
Top |
Related drugs of malignant transformation related genes |
| Identification of chemicals and drugs interact with genes involved in malignant transfromation |
| (DGIdb 4.0) |
| Entrez ID | Symbol | Category | Interaction Types | Drug Claim Name | Drug Name | PMIDs |
| Page: 1 |

Copyright 2023-Present -The University of Texas Health Science Center at Houston |