| Tissue | Expression Dynamics | Abbreviation |
| Endometrium | 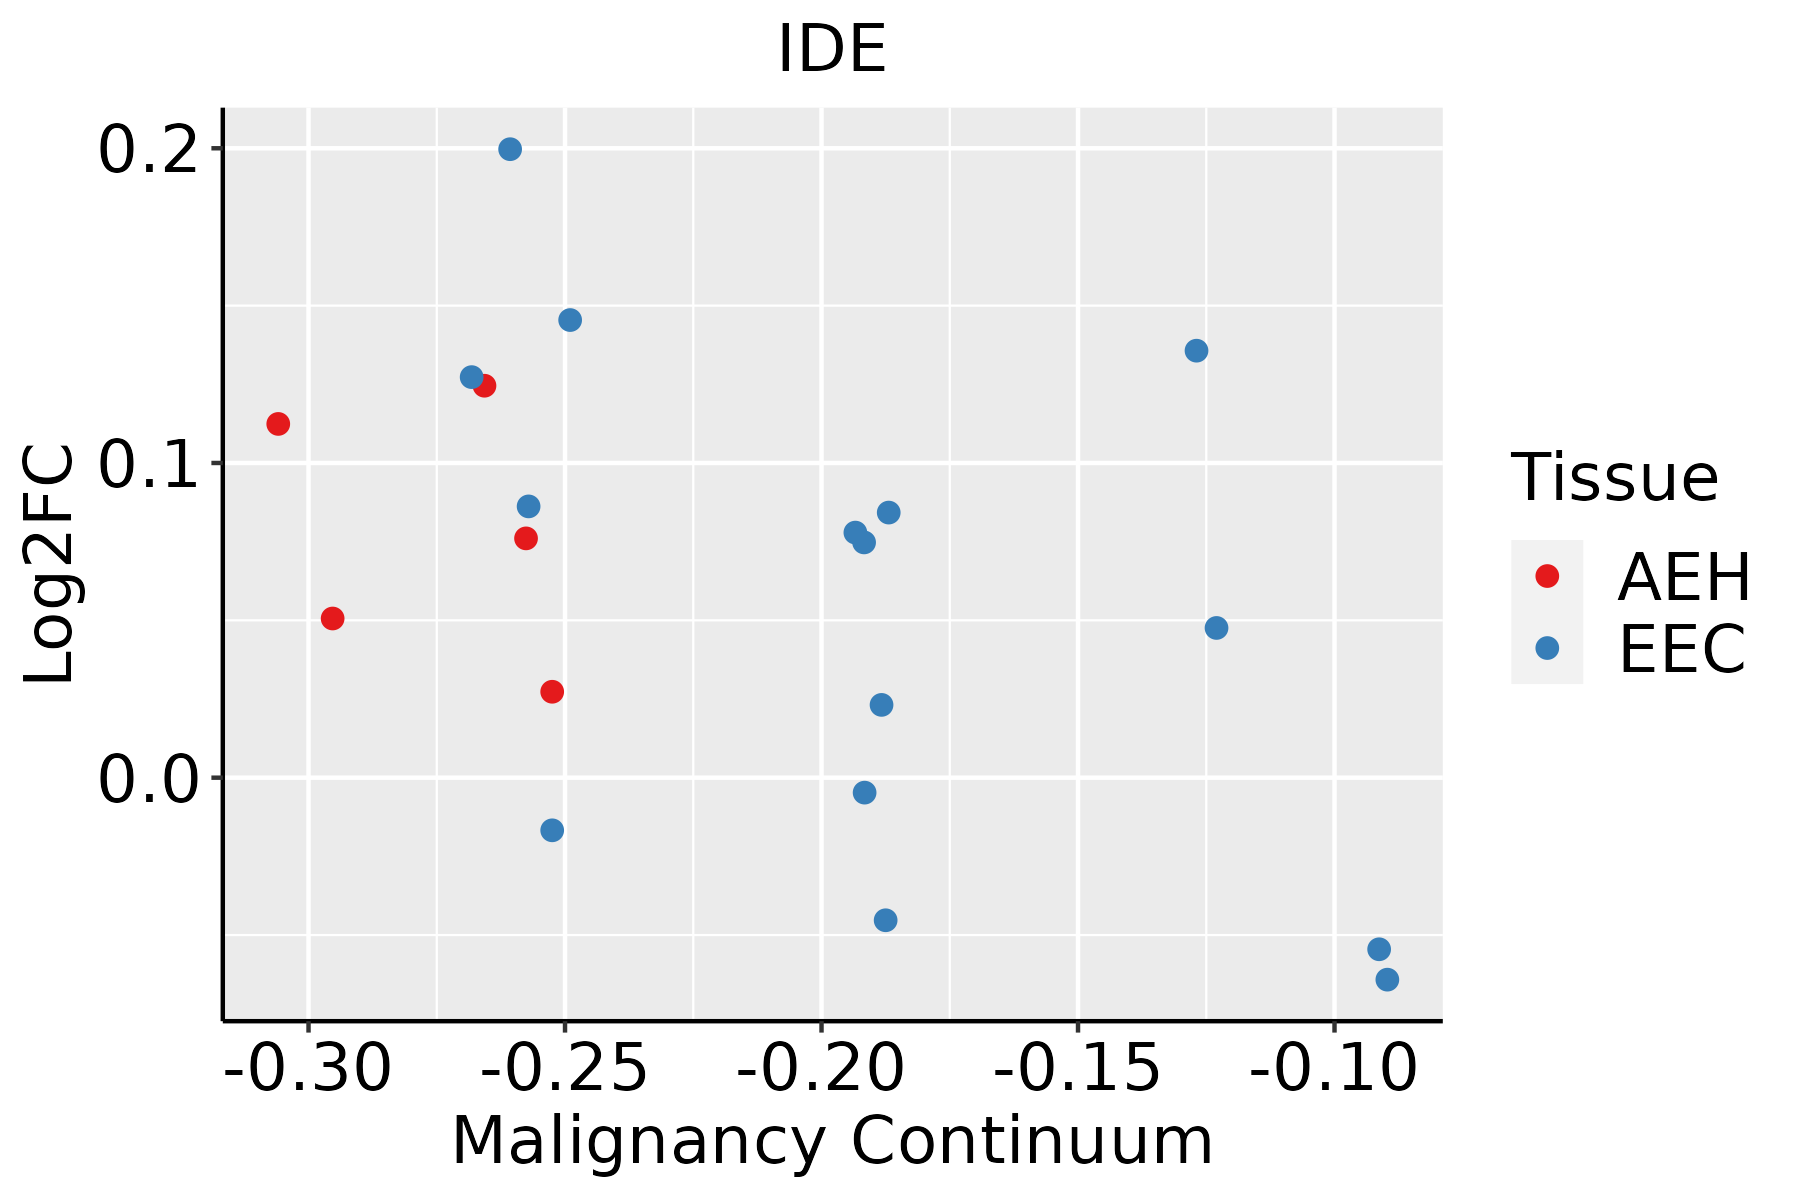 | AEH: Atypical endometrial hyperplasia |
| EEC: Endometrioid Cancer |
| Liver | 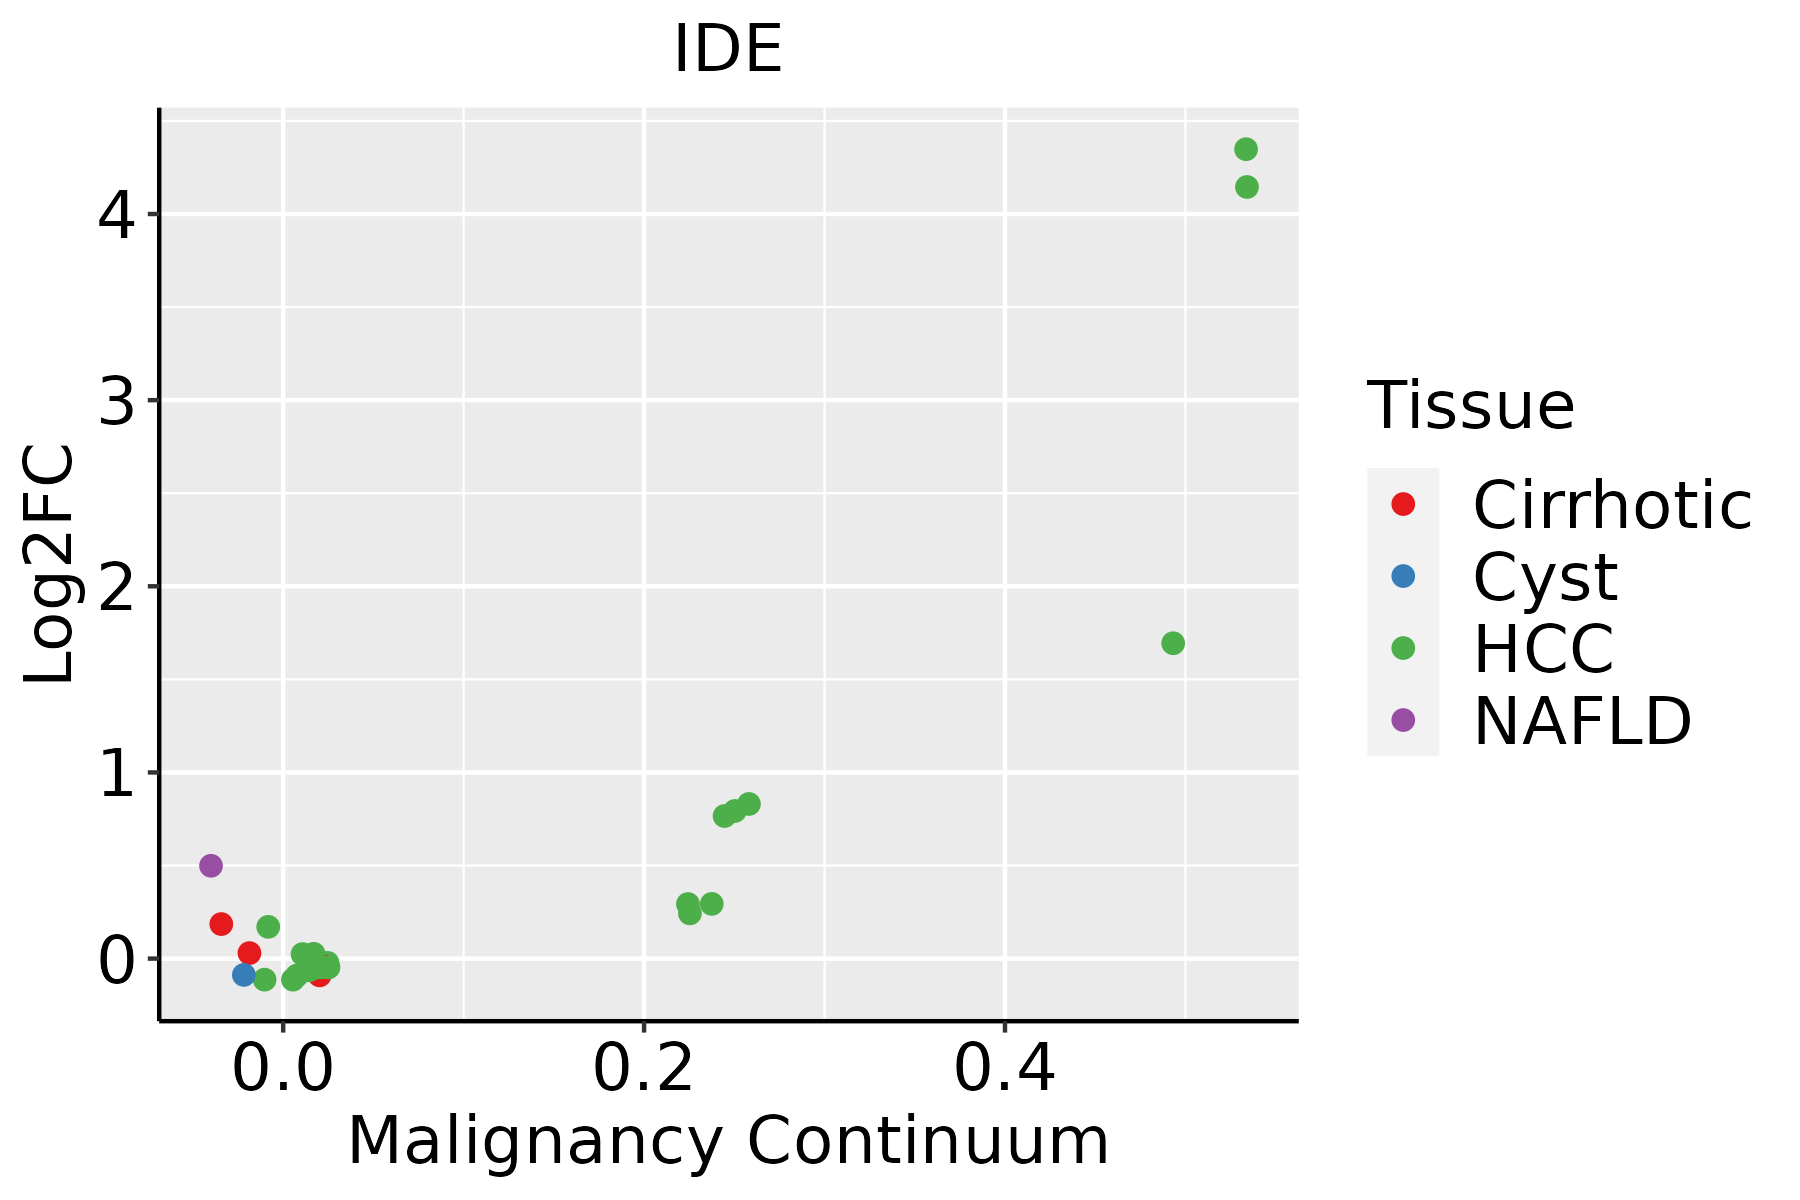 | HCC: Hepatocellular carcinoma |
| NAFLD: Non-alcoholic fatty liver disease |
| Oral Cavity | 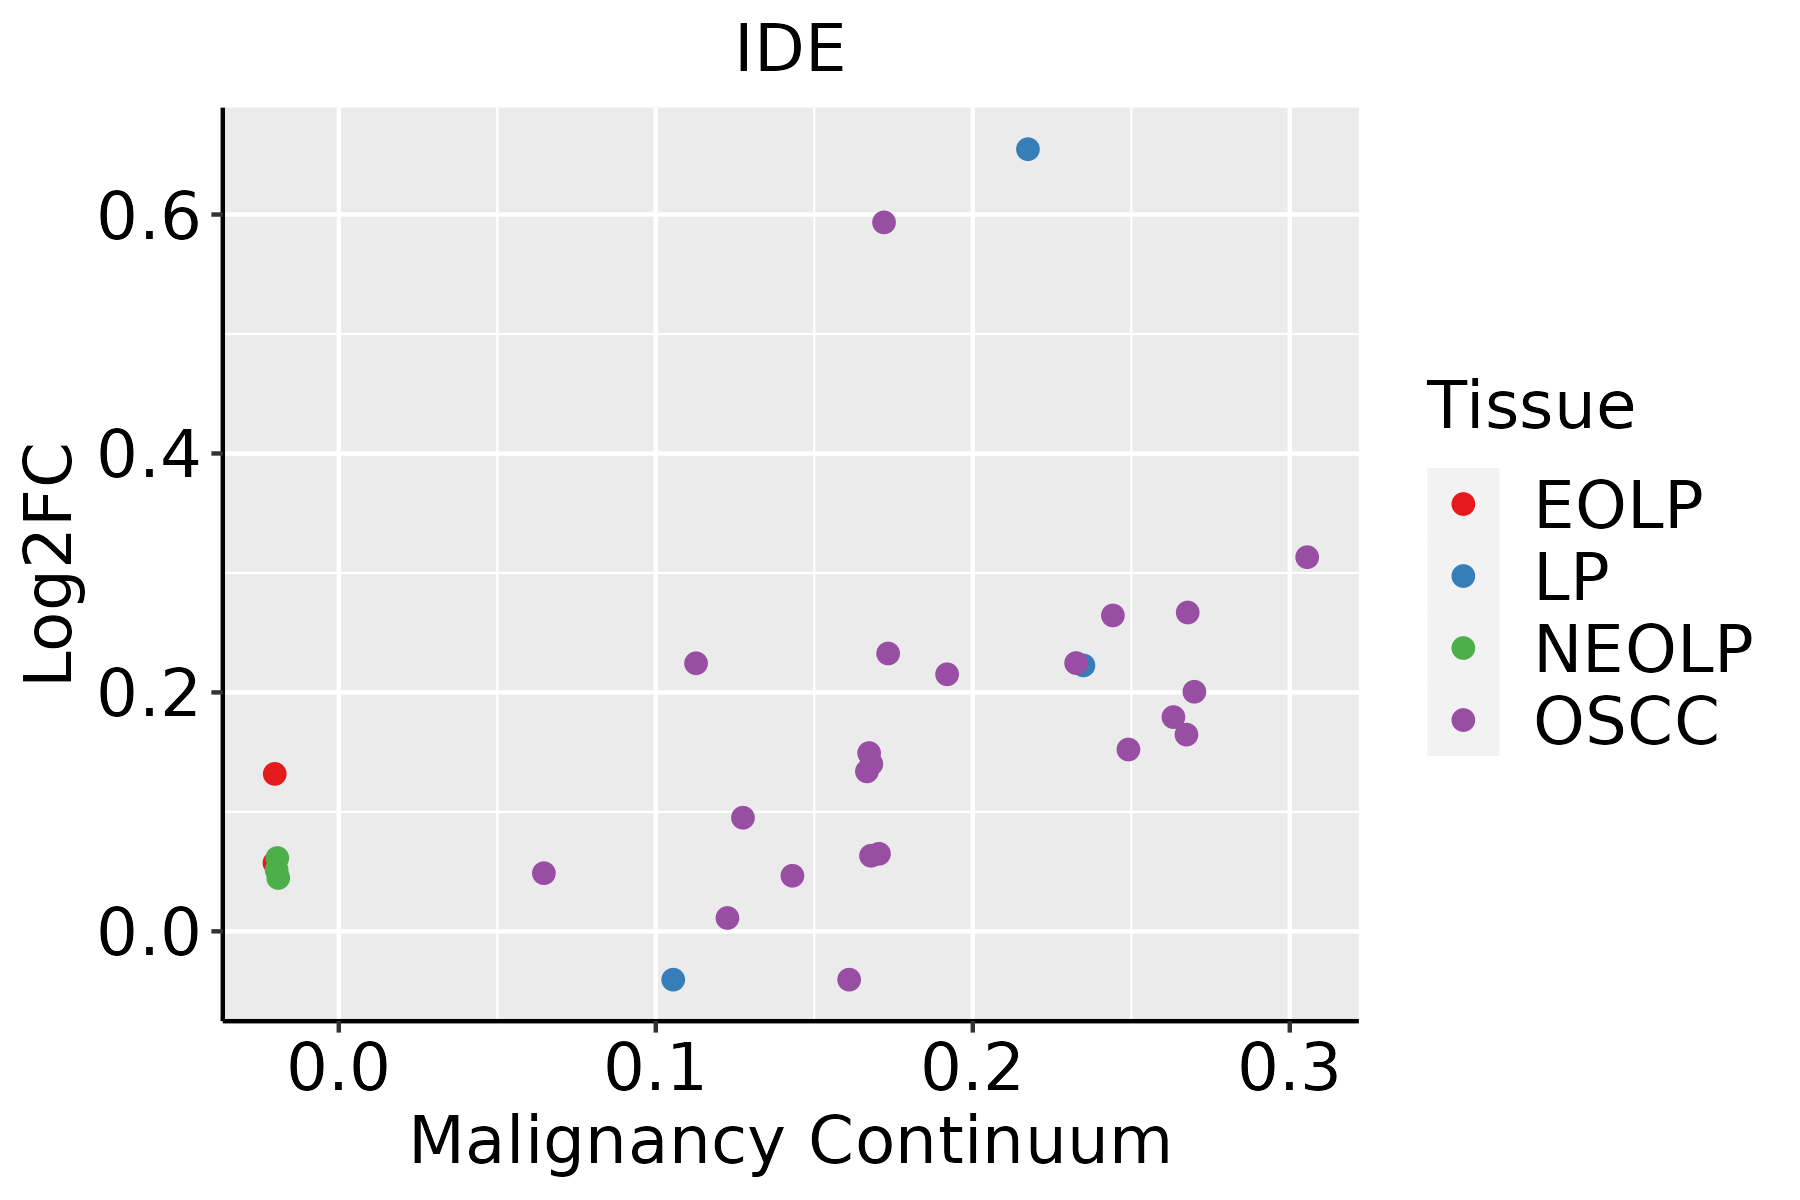 | EOLP: Erosive Oral lichen planus |
| LP: leukoplakia |
| NEOLP: Non-erosive oral lichen planus |
| OSCC: Oral squamous cell carcinoma |
| Thyroid | 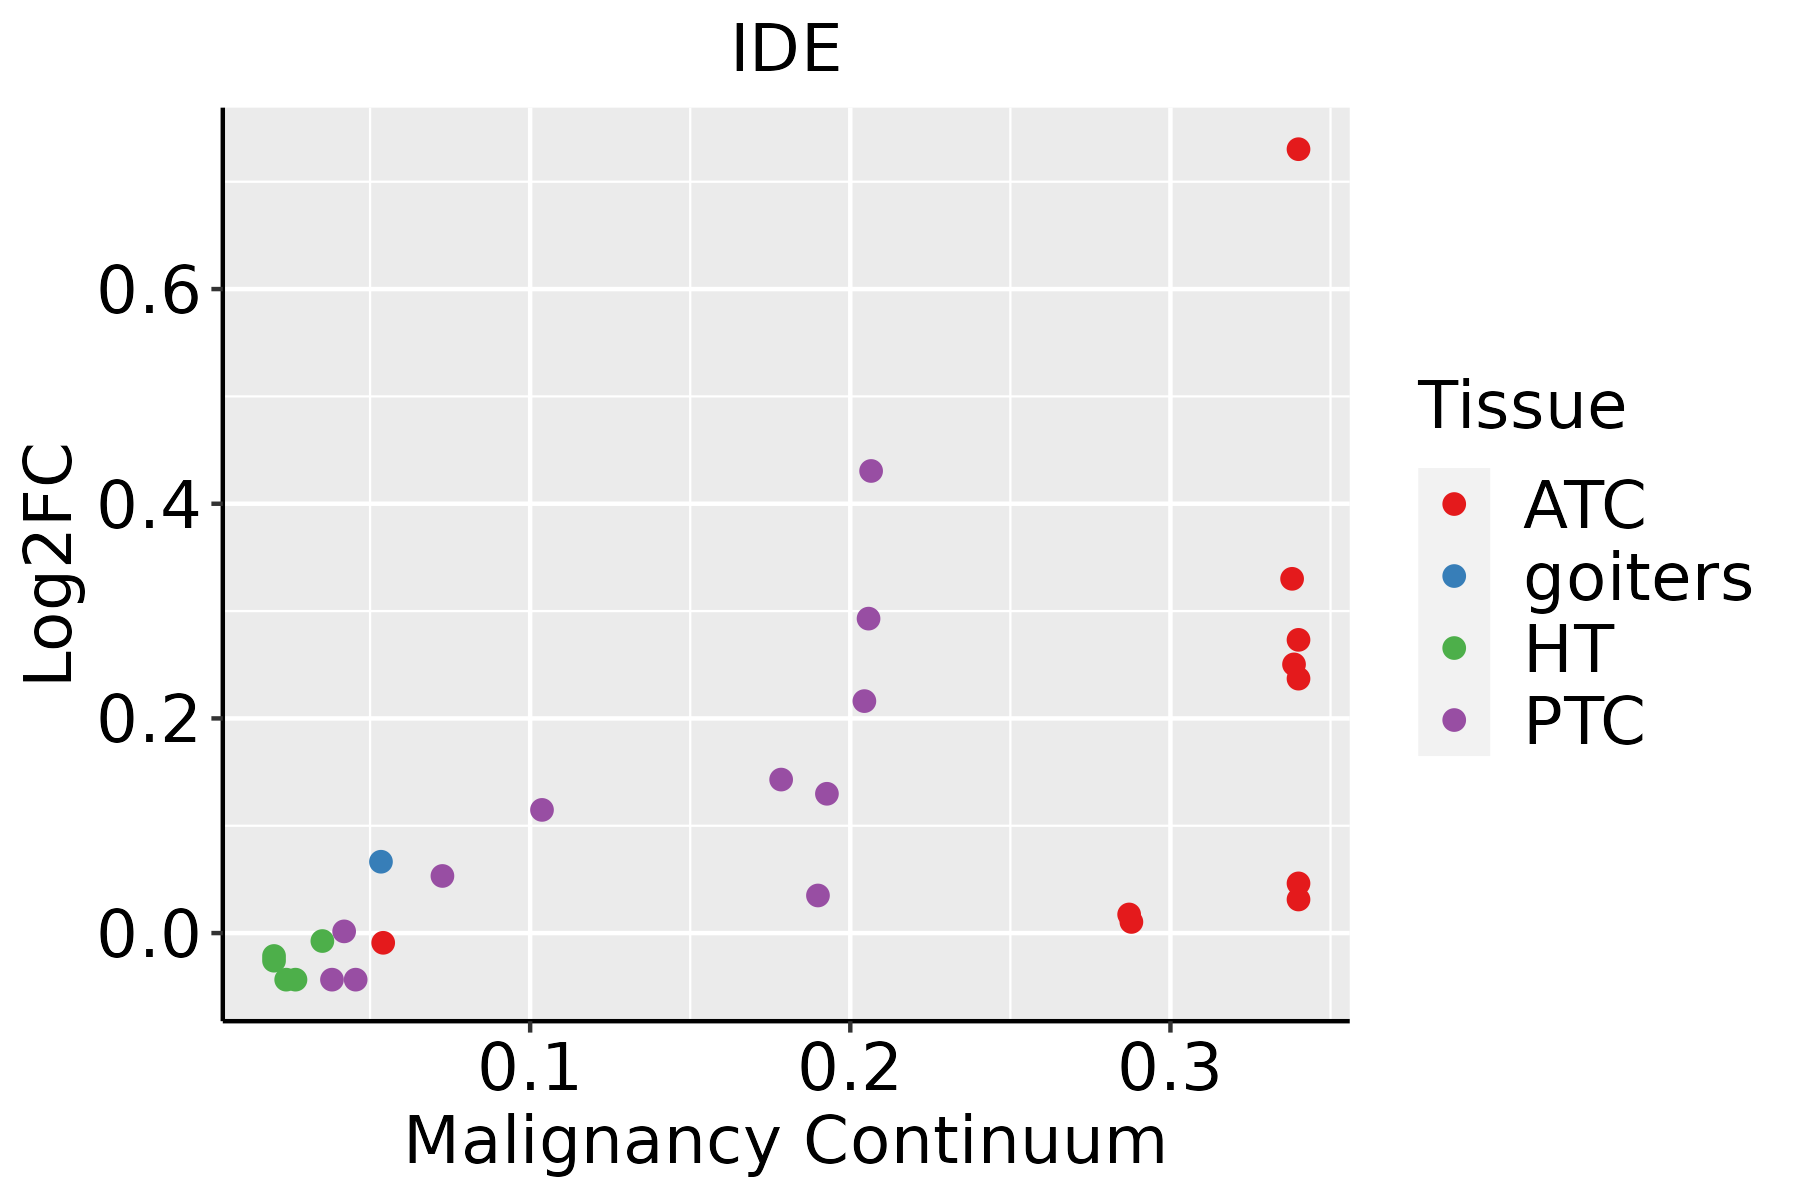 | ATC: Anaplastic thyroid cancer |
| HT: Hashimoto's thyroiditis |
| PTC: Papillary thyroid cancer |
| GO ID | Tissue | Disease Stage | Description | Gene Ratio | Bg Ratio | pvalue | p.adjust | Count |
| GO:000756815 | Endometrium | EEC | aging | 66/2168 | 339/18723 | 1.46e-05 | 2.87e-04 | 66 |
| GO:003209213 | Endometrium | EEC | positive regulation of protein binding | 24/2168 | 85/18723 | 2.29e-05 | 4.08e-04 | 24 |
| GO:190165314 | Endometrium | EEC | cellular response to peptide | 68/2168 | 359/18723 | 2.75e-05 | 4.83e-04 | 68 |
| GO:004800216 | Endometrium | EEC | antigen processing and presentation of peptide antigen | 19/2168 | 62/18723 | 4.65e-05 | 7.48e-04 | 19 |
| GO:004343416 | Endometrium | EEC | response to peptide hormone | 74/2168 | 414/18723 | 9.11e-05 | 1.28e-03 | 74 |
| GO:004345713 | Endometrium | EEC | regulation of cellular respiration | 15/2168 | 49/18723 | 2.90e-04 | 3.27e-03 | 15 |
| GO:001988217 | Endometrium | EEC | antigen processing and presentation | 25/2168 | 106/18723 | 3.71e-04 | 3.97e-03 | 25 |
| GO:000248317 | Endometrium | EEC | antigen processing and presentation of endogenous peptide antigen | 8/2168 | 19/18723 | 7.41e-04 | 7.01e-03 | 8 |
| GO:007137513 | Endometrium | EEC | cellular response to peptide hormone stimulus | 52/2168 | 290/18723 | 8.77e-04 | 8.01e-03 | 52 |
| GO:003286914 | Endometrium | EEC | cellular response to insulin stimulus | 39/2168 | 203/18723 | 9.93e-04 | 8.79e-03 | 39 |
| GO:000828613 | Endometrium | EEC | insulin receptor signaling pathway | 25/2168 | 116/18723 | 1.50e-03 | 1.21e-02 | 25 |
| GO:001988316 | Endometrium | EEC | antigen processing and presentation of endogenous antigen | 9/2168 | 26/18723 | 1.82e-03 | 1.41e-02 | 9 |
| GO:009724211 | Endometrium | EEC | amyloid-beta clearance | 11/2168 | 38/18723 | 3.00e-03 | 2.10e-02 | 11 |
| GO:003286814 | Endometrium | EEC | response to insulin | 46/2168 | 264/18723 | 3.01e-03 | 2.10e-02 | 46 |
| GO:0097193111 | Esophagus | ESCC | intrinsic apoptotic signaling pathway | 222/8552 | 288/18723 | 5.87e-28 | 2.02e-25 | 222 |
| GO:0045862111 | Esophagus | ESCC | positive regulation of proteolysis | 256/8552 | 372/18723 | 7.88e-20 | 9.43e-18 | 256 |
| GO:0010821110 | Esophagus | ESCC | regulation of mitochondrion organization | 107/8552 | 144/18723 | 2.31e-12 | 9.41e-11 | 107 |
| GO:0031667111 | Esophagus | ESCC | response to nutrient levels | 289/8552 | 474/18723 | 9.25e-12 | 3.47e-10 | 289 |
| GO:0008630110 | Esophagus | ESCC | intrinsic apoptotic signaling pathway in response to DNA damage | 78/8552 | 99/18723 | 1.43e-11 | 5.08e-10 | 78 |
| GO:0008637110 | Esophagus | ESCC | apoptotic mitochondrial changes | 83/8552 | 107/18723 | 1.43e-11 | 5.08e-10 | 83 |
| Hugo Symbol | Variant Class | Variant Classification | dbSNP RS | HGVSc | HGVSp | HGVSp Short | SWISSPROT | BIOTYPE | SIFT | PolyPhen | Tumor Sample Barcode | Tissue | Histology | Sex | Age | Stage | Therapy Types | Drugs | Outcome |
| IDE | SNV | Missense_Mutation | novel | c.2006C>T | p.Ser669Phe | p.S669F | P14735 | protein_coding | deleterious(0.01) | benign(0.339) | TCGA-5L-AAT1-01 | Breast | breast invasive carcinoma | Female | <65 | III/IV | Hormone Therapy | letrozol | SD |
| IDE | SNV | Missense_Mutation | | c.2849G>T | p.Arg950Met | p.R950M | P14735 | protein_coding | tolerated(0.19) | benign(0.003) | TCGA-AN-A0AK-01 | Breast | breast invasive carcinoma | Female | >=65 | I/II | Unknown | Unknown | SD |
| IDE | SNV | Missense_Mutation | | c.1929N>C | p.Lys643Asn | p.K643N | P14735 | protein_coding | tolerated(0.18) | benign(0.006) | TCGA-AR-A24Z-01 | Breast | breast invasive carcinoma | Female | <65 | I/II | Chemotherapy | doxorubicin | SD |
| IDE | SNV | Missense_Mutation | | c.706G>C | p.Asp236His | p.D236H | P14735 | protein_coding | deleterious(0.01) | probably_damaging(0.91) | TCGA-AR-A256-01 | Breast | breast invasive carcinoma | Female | <65 | I/II | Chemotherapy | doxorubicin | PD |
| IDE | SNV | Missense_Mutation | novel | c.2152N>G | p.Gln718Glu | p.Q718E | P14735 | protein_coding | tolerated(0.26) | benign(0.019) | TCGA-BH-A0HP-01 | Breast | breast invasive carcinoma | Female | >=65 | III/IV | Chemotherapy | doxorubicin | SD |
| IDE | insertion | Frame_Shift_Ins | novel | c.2580_2581insTTTTTTTTTTT | p.Ser861PhefsTer11 | p.S861Ffs*11 | P14735 | protein_coding | | | TCGA-BH-A0EB-01 | Breast | breast invasive carcinoma | Female | >=65 | I/II | Hormone Therapy | arimidex | SD |
| IDE | SNV | Missense_Mutation | | c.2062N>G | p.Leu688Val | p.L688V | P14735 | protein_coding | tolerated(0.5) | benign(0.035) | TCGA-FU-A3HZ-01 | Cervix | cervical & endocervical cancer | Female | <65 | I/II | Chemotherapy | cisplatin | CR |
| IDE | SNV | Missense_Mutation | | c.1402N>A | p.Leu468Ile | p.L468I | P14735 | protein_coding | tolerated(0.08) | possibly_damaging(0.486) | TCGA-FU-A3HZ-01 | Cervix | cervical & endocervical cancer | Female | <65 | I/II | Chemotherapy | cisplatin | CR |
| IDE | SNV | Missense_Mutation | | c.1384N>C | p.Asp462His | p.D462H | P14735 | protein_coding | deleterious(0.01) | probably_damaging(0.967) | TCGA-IR-A3LH-01 | Cervix | cervical & endocervical cancer | Female | <65 | I/II | Chemotherapy | cisplatin | CR |
| IDE | SNV | Missense_Mutation | rs766038121 | c.2569C>A | p.His857Asn | p.H857N | P14735 | protein_coding | tolerated(0.59) | benign(0.085) | TCGA-VS-A8Q8-01 | Cervix | cervical & endocervical cancer | Female | <65 | I/II | Unknown | Unknown | PD |
| Entrez ID | Symbol | Category | Interaction Types | Drug Claim Name | Drug Name | PMIDs |
| 3416 | IDE | DRUGGABLE GENOME, NEUTRAL ZINC METALLOPEPTIDASE, EXTERNAL SIDE OF PLASMA MEMBRANE, CELL SURFACE, ENZYME, PROTEASE | | CALMIDAZOLIUM CHLORIDE | CALMIDAZOLIUM CHLORIDE | |
| 3416 | IDE | DRUGGABLE GENOME, NEUTRAL ZINC METALLOPEPTIDASE, EXTERNAL SIDE OF PLASMA MEMBRANE, CELL SURFACE, ENZYME, PROTEASE | inhibitor | 252166800 | | |
| 3416 | IDE | DRUGGABLE GENOME, NEUTRAL ZINC METALLOPEPTIDASE, EXTERNAL SIDE OF PLASMA MEMBRANE, CELL SURFACE, ENZYME, PROTEASE | | Bacitracin | BACITRACIN | |
| 3416 | IDE | DRUGGABLE GENOME, NEUTRAL ZINC METALLOPEPTIDASE, EXTERNAL SIDE OF PLASMA MEMBRANE, CELL SURFACE, ENZYME, PROTEASE | | OLEOYL DOPAMINE | OLEOYL DOPAMINE | |
| 3416 | IDE | DRUGGABLE GENOME, NEUTRAL ZINC METALLOPEPTIDASE, EXTERNAL SIDE OF PLASMA MEMBRANE, CELL SURFACE, ENZYME, PROTEASE | | N-(4-NITROPHENYL)ANTHRANILIC ACID | CHEMBL1574420 | |
| 3416 | IDE | DRUGGABLE GENOME, NEUTRAL ZINC METALLOPEPTIDASE, EXTERNAL SIDE OF PLASMA MEMBRANE, CELL SURFACE, ENZYME, PROTEASE | inhibitor | 252166798 | | |
| 3416 | IDE | DRUGGABLE GENOME, NEUTRAL ZINC METALLOPEPTIDASE, EXTERNAL SIDE OF PLASMA MEMBRANE, CELL SURFACE, ENZYME, PROTEASE | | BIOTIN | BIOTIN | |
| 3416 | IDE | DRUGGABLE GENOME, NEUTRAL ZINC METALLOPEPTIDASE, EXTERNAL SIDE OF PLASMA MEMBRANE, CELL SURFACE, ENZYME, PROTEASE | inhibitor | 252166797 | | |
| 3416 | IDE | DRUGGABLE GENOME, NEUTRAL ZINC METALLOPEPTIDASE, EXTERNAL SIDE OF PLASMA MEMBRANE, CELL SURFACE, ENZYME, PROTEASE | | PRO-001 | | |


