
|
|||||
|
 | |
| |
| |
| |
| |
| |
|
Gene: ICMT |
Gene summary for ICMT |
| Gene information | Species | Human | Gene symbol | ICMT | Gene ID | 23463 |
| Gene name | isoprenylcysteine carboxyl methyltransferase | |
| Gene Alias | HSTE14 | |
| Cytomap | 1p36.31 | |
| Gene Type | protein-coding | GO ID | GO:0006464 | UniProtAcc | A0A024R4F6 |
Top |
Malignant transformation analysis |
| Identification of the aberrant gene expression in precancerous and cancerous lesions by comparing the gene expression of stem-like cells in diseased tissues with normal stem cells |
| Entrez ID | Symbol | Replicates | Species | Organ | Tissue | Adj P-value | Log2FC | Malignancy |
| 23463 | ICMT | LZE22T | Human | Esophagus | ESCC | 5.95e-06 | 4.96e-01 | 0.068 |
| 23463 | ICMT | LZE24T | Human | Esophagus | ESCC | 4.42e-18 | 5.11e-01 | 0.0596 |
| 23463 | ICMT | P1T-E | Human | Esophagus | ESCC | 3.96e-03 | 2.65e-01 | 0.0875 |
| 23463 | ICMT | P2T-E | Human | Esophagus | ESCC | 2.52e-19 | 5.02e-01 | 0.1177 |
| 23463 | ICMT | P4T-E | Human | Esophagus | ESCC | 3.96e-33 | 8.25e-01 | 0.1323 |
| 23463 | ICMT | P5T-E | Human | Esophagus | ESCC | 1.34e-23 | 5.27e-01 | 0.1327 |
| 23463 | ICMT | P8T-E | Human | Esophagus | ESCC | 5.04e-14 | 3.52e-01 | 0.0889 |
| 23463 | ICMT | P9T-E | Human | Esophagus | ESCC | 2.36e-09 | 2.78e-01 | 0.1131 |
| 23463 | ICMT | P10T-E | Human | Esophagus | ESCC | 2.35e-34 | 7.24e-01 | 0.116 |
| 23463 | ICMT | P11T-E | Human | Esophagus | ESCC | 3.58e-08 | 5.53e-01 | 0.1426 |
| 23463 | ICMT | P12T-E | Human | Esophagus | ESCC | 1.58e-15 | 3.48e-01 | 0.1122 |
| 23463 | ICMT | P15T-E | Human | Esophagus | ESCC | 1.22e-25 | 6.00e-01 | 0.1149 |
| 23463 | ICMT | P16T-E | Human | Esophagus | ESCC | 2.88e-18 | 3.16e-01 | 0.1153 |
| 23463 | ICMT | P17T-E | Human | Esophagus | ESCC | 2.02e-10 | 5.19e-01 | 0.1278 |
| 23463 | ICMT | P19T-E | Human | Esophagus | ESCC | 1.11e-10 | 9.14e-01 | 0.1662 |
| 23463 | ICMT | P20T-E | Human | Esophagus | ESCC | 2.18e-19 | 4.22e-01 | 0.1124 |
| 23463 | ICMT | P21T-E | Human | Esophagus | ESCC | 1.08e-48 | 1.08e+00 | 0.1617 |
| 23463 | ICMT | P22T-E | Human | Esophagus | ESCC | 2.70e-15 | 2.25e-01 | 0.1236 |
| 23463 | ICMT | P23T-E | Human | Esophagus | ESCC | 8.60e-28 | 6.38e-01 | 0.108 |
| 23463 | ICMT | P24T-E | Human | Esophagus | ESCC | 1.16e-22 | 5.21e-01 | 0.1287 |
| Page: 1 2 3 4 5 6 |
| Tissue | Expression Dynamics | Abbreviation |
| Esophagus | 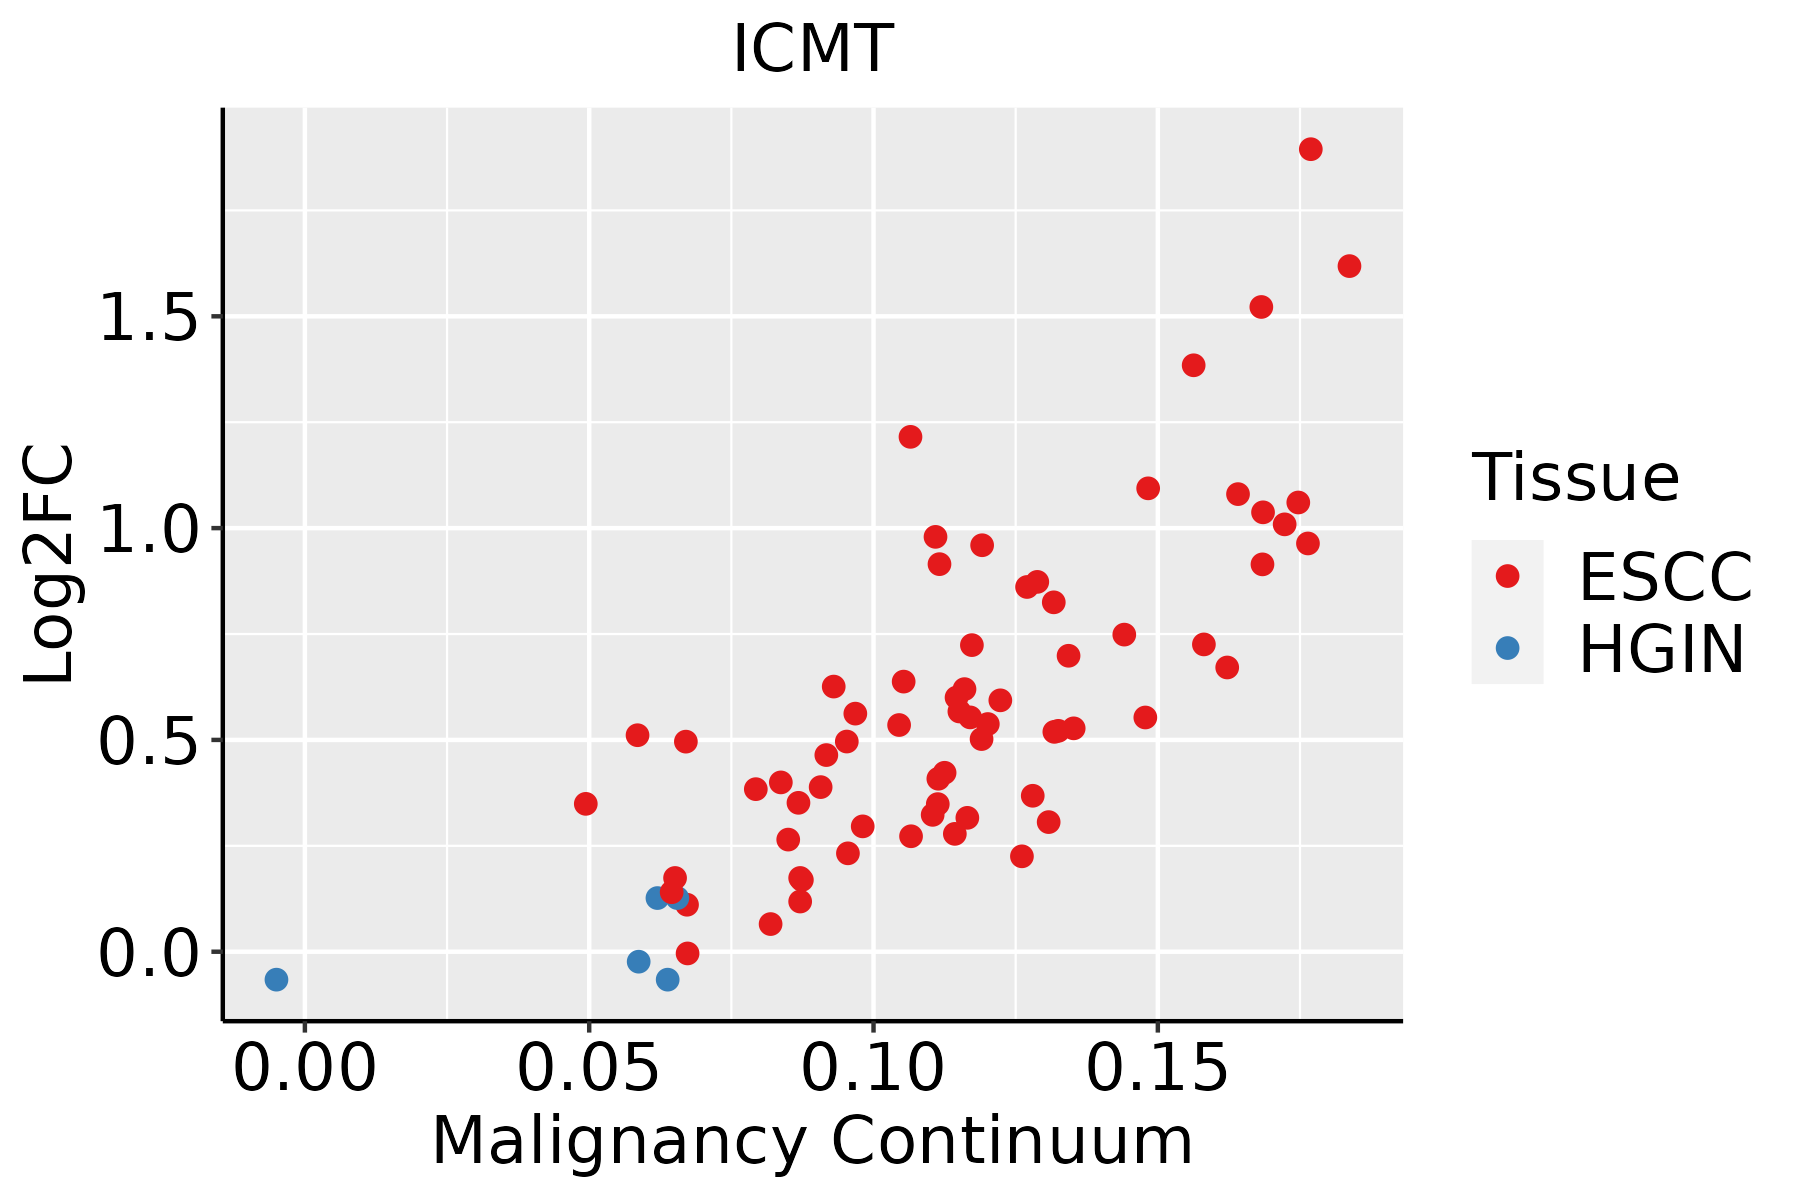 | ESCC: Esophageal squamous cell carcinoma |
| HGIN: High-grade intraepithelial neoplasias | ||
| LGIN: Low-grade intraepithelial neoplasias | ||
| Liver |  | HCC: Hepatocellular carcinoma |
| NAFLD: Non-alcoholic fatty liver disease | ||
| Oral Cavity |  | EOLP: Erosive Oral lichen planus |
| LP: leukoplakia | ||
| NEOLP: Non-erosive oral lichen planus | ||
| OSCC: Oral squamous cell carcinoma | ||
| Skin | 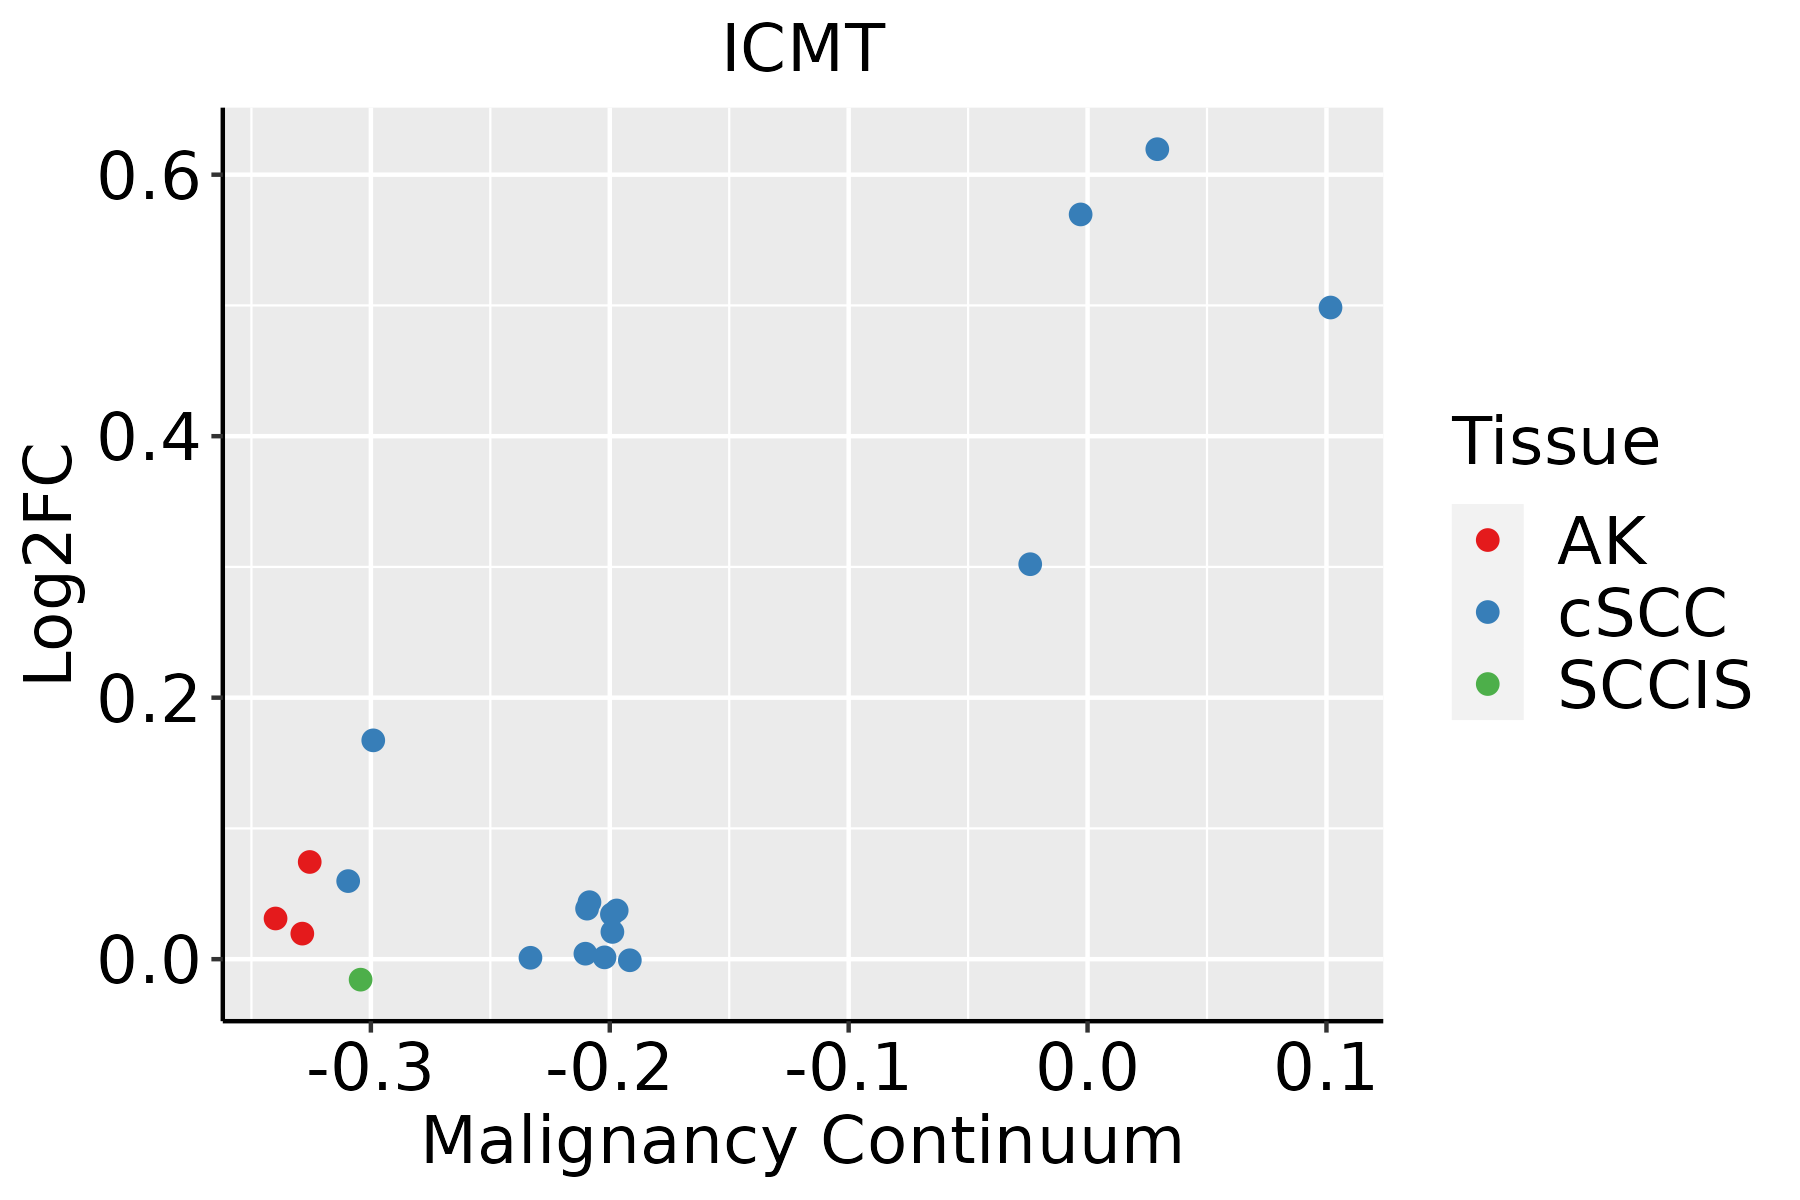 | AK: Actinic keratosis |
| cSCC: Cutaneous squamous cell carcinoma | ||
| SCCIS:squamous cell carcinoma in situ | ||
| Thyroid | 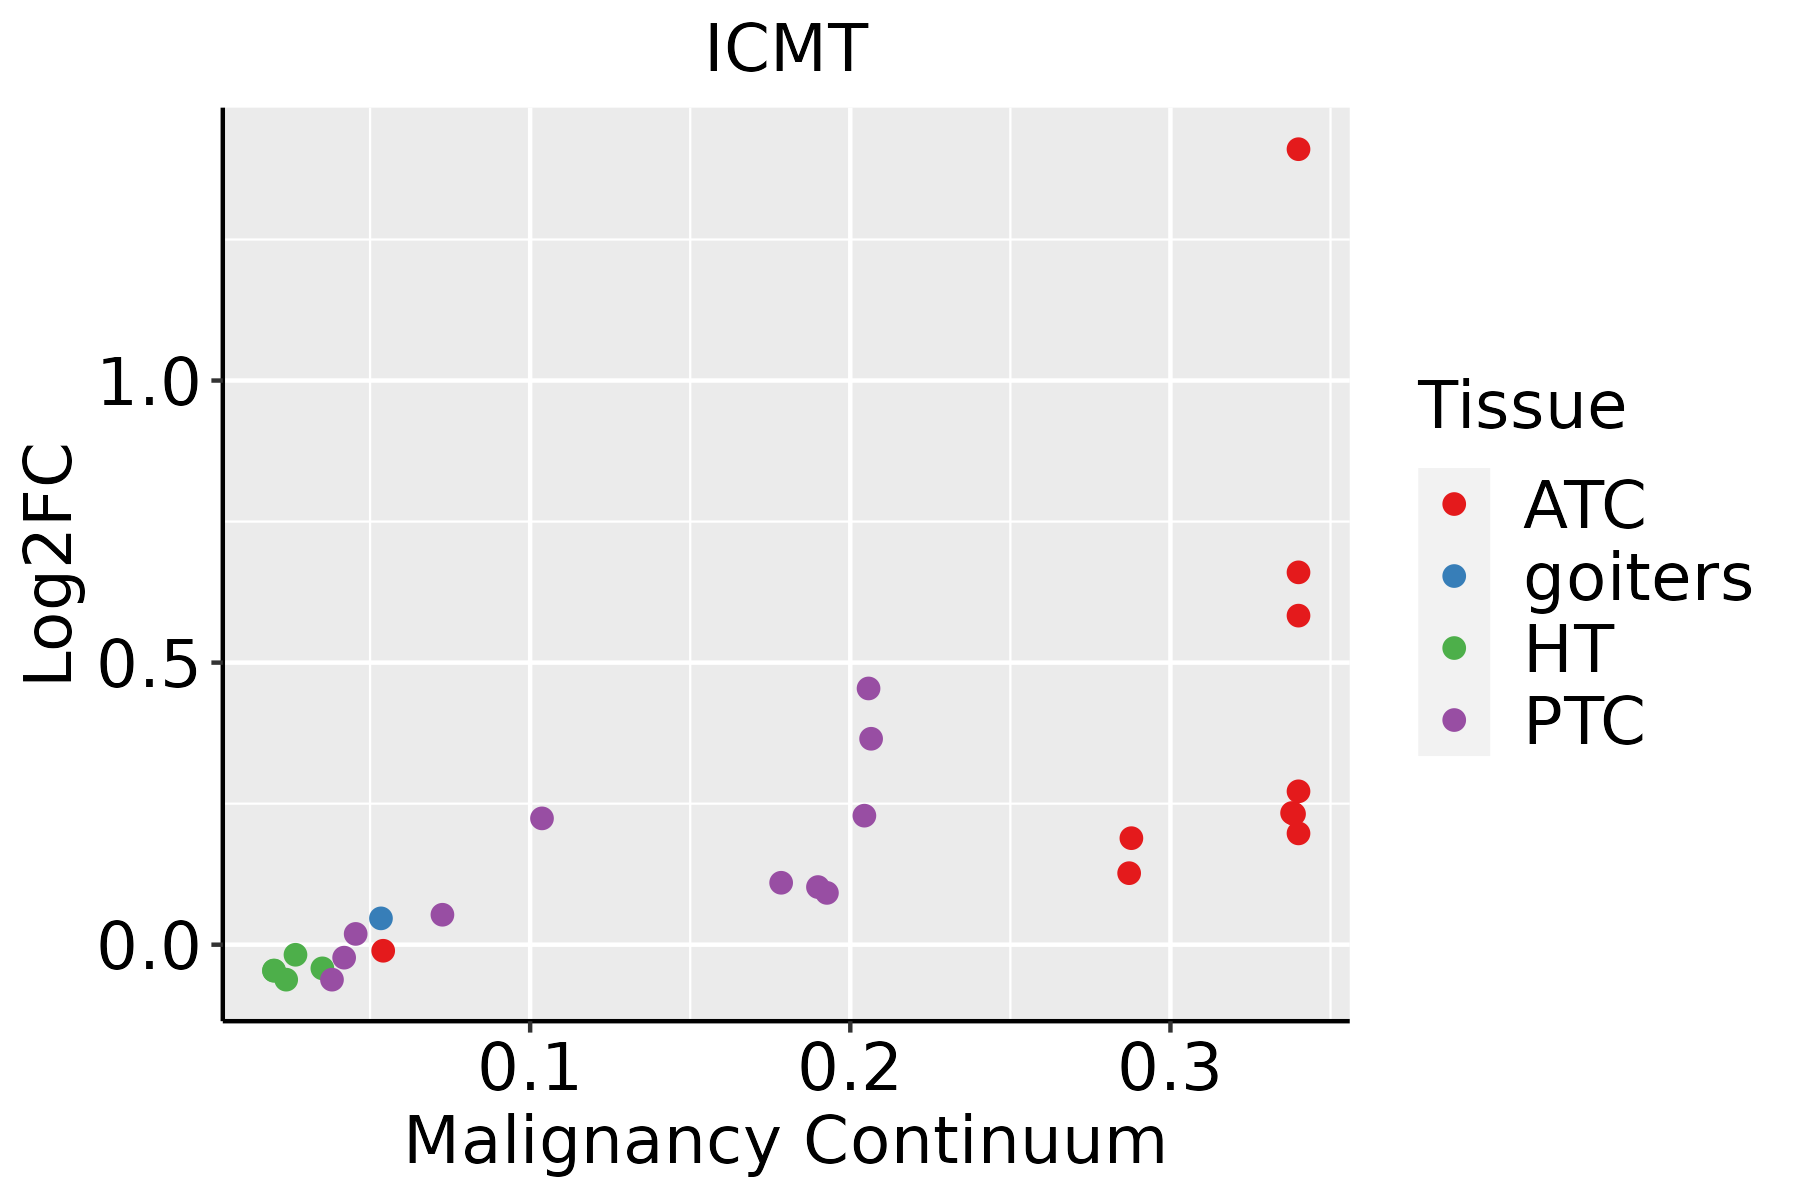 | ATC: Anaplastic thyroid cancer |
| HT: Hashimoto's thyroiditis | ||
| PTC: Papillary thyroid cancer |
| ∗log2FC in expression of this searched gene in stem-like cells from each diseased tissue sample relative to stem-like cells in normal samples in each tissue plotted against the malignancy continuum. Samples are colored based on if they are from different disease stage. |
Top |
Malignant transformation related pathway analysis |
| Find out the enriched GO biological processes and KEGG pathways involved in transition from healthy to precancer to cancer |
| Tissue | Disease Stage | Enriched GO biological Processes |
| Colorectum | AD |  |
| Colorectum | SER |  |
| Colorectum | MSS |  |
| Colorectum | MSI-H |  |
| Colorectum | FAP |  |
| ∗Top 15 enriched GO BP terms are showed in the bar plot of each disease state in each tissue. Each row represents a significant GO biological process which is colored according to the -log10(p.adjust). |
| Page: 1 2 3 4 5 6 7 8 9 |
| GO ID | Tissue | Disease Stage | Description | Gene Ratio | Bg Ratio | pvalue | p.adjust | Count |
| GO:00434142 | Oral cavity | OSCC | macromolecule methylation | 149/7305 | 316/18723 | 1.82e-03 | 8.60e-03 | 149 |
| GO:00322591 | Oral cavity | OSCC | methylation | 168/7305 | 364/18723 | 3.03e-03 | 1.31e-02 | 168 |
| GO:0006605110 | Oral cavity | LP | protein targeting | 156/4623 | 314/18723 | 5.43e-22 | 1.62e-19 | 156 |
| GO:009015019 | Oral cavity | LP | establishment of protein localization to membrane | 128/4623 | 260/18723 | 7.19e-18 | 1.19e-15 | 128 |
| GO:000661211 | Oral cavity | LP | protein targeting to membrane | 60/4623 | 131/18723 | 1.10e-07 | 3.59e-06 | 60 |
| GO:000660527 | Skin | cSCC | protein targeting | 153/4864 | 314/18723 | 2.62e-18 | 3.36e-16 | 153 |
| GO:009015024 | Skin | cSCC | establishment of protein localization to membrane | 123/4864 | 260/18723 | 8.34e-14 | 5.18e-12 | 123 |
| GO:00066125 | Skin | cSCC | protein targeting to membrane | 54/4864 | 131/18723 | 9.79e-05 | 9.11e-04 | 54 |
| GO:000647915 | Skin | cSCC | protein methylation | 67/4864 | 181/18723 | 6.65e-04 | 4.75e-03 | 67 |
| GO:000821315 | Skin | cSCC | protein alkylation | 67/4864 | 181/18723 | 6.65e-04 | 4.75e-03 | 67 |
| GO:004341411 | Skin | cSCC | macromolecule methylation | 107/4864 | 316/18723 | 1.03e-03 | 6.94e-03 | 107 |
| GO:00322593 | Skin | cSCC | methylation | 120/4864 | 364/18723 | 1.61e-03 | 9.93e-03 | 120 |
| GO:0006605113 | Thyroid | PTC | protein targeting | 180/5968 | 314/18723 | 6.81e-21 | 1.19e-18 | 180 |
| GO:0090150112 | Thyroid | PTC | establishment of protein localization to membrane | 149/5968 | 260/18723 | 1.64e-17 | 1.59e-15 | 149 |
| GO:00066126 | Thyroid | PTC | protein targeting to membrane | 64/5968 | 131/18723 | 3.67e-05 | 3.41e-04 | 64 |
| GO:000647910 | Thyroid | PTC | protein methylation | 82/5968 | 181/18723 | 1.01e-04 | 8.21e-04 | 82 |
| GO:000821310 | Thyroid | PTC | protein alkylation | 82/5968 | 181/18723 | 1.01e-04 | 8.21e-04 | 82 |
| GO:00322594 | Thyroid | PTC | methylation | 146/5968 | 364/18723 | 4.99e-04 | 3.26e-03 | 146 |
| GO:00434145 | Thyroid | PTC | macromolecule methylation | 127/5968 | 316/18723 | 1.02e-03 | 6.07e-03 | 127 |
| GO:000660533 | Thyroid | ATC | protein targeting | 180/6293 | 314/18723 | 3.54e-18 | 4.39e-16 | 180 |
| Page: 1 2 3 |
| Pathway ID | Tissue | Disease Stage | Description | Gene Ratio | Bg Ratio | pvalue | p.adjust | qvalue | Count |
| hsa009005 | Esophagus | ESCC | Terpenoid backbone biosynthesis | 20/4205 | 23/8465 | 2.14e-04 | 7.87e-04 | 4.03e-04 | 20 |
| hsa0090012 | Esophagus | ESCC | Terpenoid backbone biosynthesis | 20/4205 | 23/8465 | 2.14e-04 | 7.87e-04 | 4.03e-04 | 20 |
| hsa00900 | Liver | HCC | Terpenoid backbone biosynthesis | 17/4020 | 23/8465 | 9.26e-03 | 2.46e-02 | 1.37e-02 | 17 |
| hsa009001 | Liver | HCC | Terpenoid backbone biosynthesis | 17/4020 | 23/8465 | 9.26e-03 | 2.46e-02 | 1.37e-02 | 17 |
| hsa009004 | Oral cavity | OSCC | Terpenoid backbone biosynthesis | 19/3704 | 23/8465 | 1.55e-04 | 5.34e-04 | 2.72e-04 | 19 |
| hsa0090011 | Oral cavity | OSCC | Terpenoid backbone biosynthesis | 19/3704 | 23/8465 | 1.55e-04 | 5.34e-04 | 2.72e-04 | 19 |
| hsa009002 | Oral cavity | LP | Terpenoid backbone biosynthesis | 12/2418 | 23/8465 | 1.43e-02 | 4.59e-02 | 2.96e-02 | 12 |
| hsa009003 | Oral cavity | LP | Terpenoid backbone biosynthesis | 12/2418 | 23/8465 | 1.43e-02 | 4.59e-02 | 2.96e-02 | 12 |
| Page: 1 |
Top |
Cell-cell communication analysis |
| Identification of potential cell-cell interactions between two cell types and their ligand-receptor pairs for different disease states |
| Ligand | Receptor | LRpair | Pathway | Tissue | Disease Stage |
| Page: 1 |
Top |
Single-cell gene regulatory network inference analysis |
| Find out the significant the regulons (TFs) and the target genes of each regulon across cell types for different disease states |
| TF | Cell Type | Tissue | Disease Stage | Target Gene | RSS | Regulon Activity |
| ∗The dot plots of a searched regulon are shown for all cell subpopulations in each disease state of each tissue based on the regulon specific score inferred using pySCENIC and by calculating the average expression. |
| Page: 1 |
Top |
Somatic mutation of malignant transformation related genes |
| Annotation of somatic variants for genes involved in malignant transformation |
| Hugo Symbol | Variant Class | Variant Classification | dbSNP RS | HGVSc | HGVSp | HGVSp Short | SWISSPROT | BIOTYPE | SIFT | PolyPhen | Tumor Sample Barcode | Tissue | Histology | Sex | Age | Stage | Therapy Types | Drugs | Outcome |
| ICMT | SNV | Missense_Mutation | c.595N>G | p.Leu199Val | p.L199V | O60725 | protein_coding | deleterious(0) | probably_damaging(1) | TCGA-BH-A0W7-01 | Breast | breast invasive carcinoma | Female | <65 | I/II | Chemotherapy | taxotere | CR | |
| ICMT | insertion | Frame_Shift_Ins | novel | c.200_201insACCCCCAAAGGTGCTGT | p.Ile68ProfsTer22 | p.I68Pfs*22 | O60725 | protein_coding | TCGA-A7-A0CE-01 | Breast | breast invasive carcinoma | Female | <65 | I/II | Chemotherapy | adriamycin | SD | ||
| ICMT | insertion | Frame_Shift_Ins | novel | c.248_249insTCCCC | p.Ser84ProfsTer29 | p.S84Pfs*29 | O60725 | protein_coding | TCGA-AN-A0FJ-01 | Breast | breast invasive carcinoma | Female | <65 | III/IV | Unknown | Unknown | SD | ||
| ICMT | SNV | Missense_Mutation | novel | c.562G>A | p.Val188Met | p.V188M | O60725 | protein_coding | deleterious(0.03) | possibly_damaging(0.71) | TCGA-2W-A8YY-01 | Cervix | cervical & endocervical cancer | Female | <65 | I/II | Chemotherapy | cisplatin | CR |
| ICMT | SNV | Missense_Mutation | c.815C>T | p.Thr272Met | p.T272M | O60725 | protein_coding | deleterious(0) | probably_damaging(0.912) | TCGA-CM-4743-01 | Colorectum | colon adenocarcinoma | Male | >=65 | I/II | Chemotherapy | capecitabine | SD | |
| ICMT | SNV | Missense_Mutation | rs777089946 | c.625N>T | p.Arg209Trp | p.R209W | O60725 | protein_coding | deleterious(0) | probably_damaging(1) | TCGA-EI-6917-01 | Colorectum | rectum adenocarcinoma | Male | <65 | III/IV | Chemotherapy | 5fluorouracil+oxaciplatina+l-folinian | SD |
| ICMT | SNV | Missense_Mutation | c.733N>T | p.Arg245Cys | p.R245C | O60725 | protein_coding | deleterious(0) | probably_damaging(0.917) | TCGA-AX-A1C9-01 | Endometrium | uterine corpus endometrioid carcinoma | Female | >=65 | I/II | Unknown | Unknown | SD | |
| ICMT | SNV | Missense_Mutation | novel | c.403G>T | p.Ala135Ser | p.A135S | O60725 | protein_coding | deleterious(0) | probably_damaging(0.966) | TCGA-AX-A2HD-01 | Endometrium | uterine corpus endometrioid carcinoma | Female | >=65 | III/IV | Unknown | Unknown | SD |
| ICMT | SNV | Missense_Mutation | c.334G>A | p.Ala112Thr | p.A112T | O60725 | protein_coding | deleterious(0.01) | benign(0.139) | TCGA-B5-A0JY-01 | Endometrium | uterine corpus endometrioid carcinoma | Female | <65 | III/IV | Chemotherapy | doxorubicin | SD | |
| ICMT | SNV | Missense_Mutation | c.767N>A | p.Ile256Asn | p.I256N | O60725 | protein_coding | deleterious(0) | probably_damaging(0.972) | TCGA-BG-A0LX-01 | Endometrium | uterine corpus endometrioid carcinoma | Female | <65 | I/II | Unknown | Unknown | SD |
| Page: 1 2 |
Top |
Related drugs of malignant transformation related genes |
| Identification of chemicals and drugs interact with genes involved in malignant transfromation |
| (DGIdb 4.0) |
| Entrez ID | Symbol | Category | Interaction Types | Drug Claim Name | Drug Name | PMIDs |
| 23463 | ICMT | DRUGGABLE GENOME, ENZYME | SIMVASTATIN | SIMVASTATIN |
| Page: 1 |

Copyright 2023-Present -The University of Texas Health Science Center at Houston |