Schematic overview of the cellular and molecular mechanisms involved in the cancer progression, including the proposed cellular and molecular mechanisms in cancer cells trajectory. AT1: alveolar type 1 cells; AT2: alveolar type 2 cells; AAH: atypical adenomatous hyperplasia; AIS: adenocarcinoma in situ; MIA: minimally invasive adenocarcinoma; IA: invasive adenocarcinoma; EMT: epithelial-mesenchymal transition

Home

Download

Statistics

Help

Contact

Center for Computational Systems Medicine
leaf

Gene summary

leaf

Malignant transformation analysis

leaf

Malignant transformation related pathway analysis

leaf

Cell-cell communication analysis

leaf

Single-cell gene regulatory network inference analysis

leaf

Somatic mutation of malignant transformation related genes

leaf

Related drugs of malignant transformation related genes

Gene: ICE1

Gene summary for ICE1

check button Gene summary.

Gene informationSpeciesHuman
Gene symbol

ICE1

Gene ID

23379

Gene nameinteractor of little elongation complex ELL subunit 1
Gene AliasKIAA0947
Cytomap5p15.32
Gene Typeprotein-coding
GO ID

GO:0006139

UniProtAcc

Q9Y2F5


Top

Malignant transformation analysis

check button Identification of the aberrant gene expression in precancerous and cancerous lesions by comparing the gene expression of stem-like cells in diseased tissues with normal stem cells
check button Malignant transformation involving gene list.
Entrez IDSymbolReplicatesSpeciesOrganTissueAdj P-valueLog2FCMalignancy
23379ICE1LZE2THumanEsophagusESCC4.42e-067.63e-010.082
23379ICE1LZE4THumanEsophagusESCC2.48e-098.95e-020.0811
23379ICE1LZE7THumanEsophagusESCC4.44e-036.52e-020.0667
23379ICE1LZE24THumanEsophagusESCC2.39e-082.05e-010.0596
23379ICE1P1T-EHumanEsophagusESCC3.06e-155.90e-010.0875
23379ICE1P2T-EHumanEsophagusESCC7.66e-366.50e-010.1177
23379ICE1P4T-EHumanEsophagusESCC2.19e-307.40e-010.1323
23379ICE1P5T-EHumanEsophagusESCC2.87e-275.24e-010.1327
23379ICE1P8T-EHumanEsophagusESCC3.28e-254.42e-010.0889
23379ICE1P9T-EHumanEsophagusESCC9.70e-213.20e-010.1131
23379ICE1P10T-EHumanEsophagusESCC2.20e-316.47e-010.116
23379ICE1P11T-EHumanEsophagusESCC5.52e-143.73e-010.1426
23379ICE1P12T-EHumanEsophagusESCC3.43e-347.05e-010.1122
23379ICE1P15T-EHumanEsophagusESCC1.21e-163.22e-010.1149
23379ICE1P16T-EHumanEsophagusESCC7.31e-212.07e-010.1153
23379ICE1P17T-EHumanEsophagusESCC9.88e-227.71e-010.1278
23379ICE1P19T-EHumanEsophagusESCC1.24e-062.82e-010.1662
23379ICE1P20T-EHumanEsophagusESCC8.38e-294.05e-010.1124
23379ICE1P21T-EHumanEsophagusESCC2.75e-244.74e-010.1617
23379ICE1P22T-EHumanEsophagusESCC2.53e-203.38e-010.1236
Page: 1 2 3 4 5 

check button Transcriptomic changes along malignancy continuum.
TissueExpression DynamicsAbbreviation
EsophagusThe image shows the transcriptomic changes along malignancy continuum.log2FC in expression of this searched gene in stem-like cells from each diseased tissue sample relative to stem-like cells in normal samples in each tissue plotted against the malignancy continuum. Samples are colored based on if they are from different disease stage.
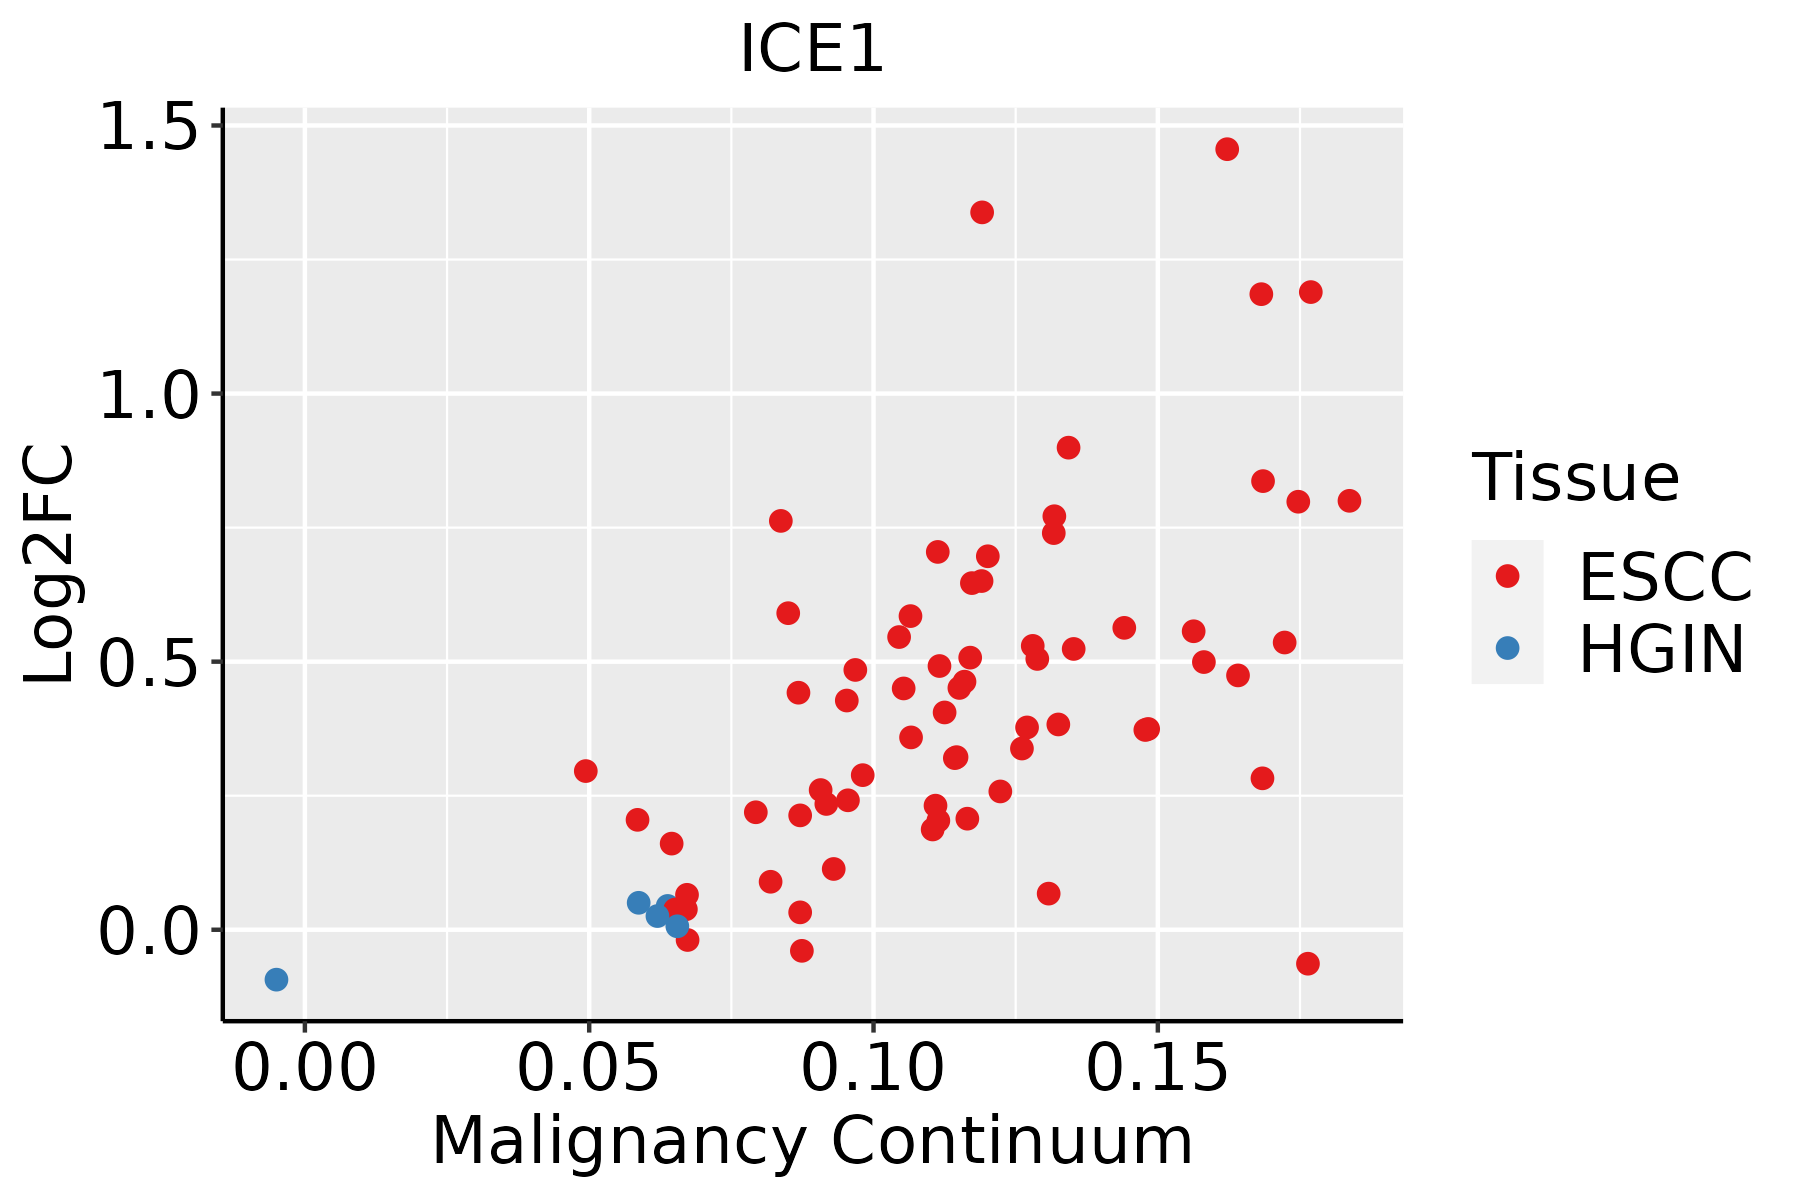
ESCC: Esophageal squamous cell carcinoma
HGIN: High-grade intraepithelial neoplasias
LGIN: Low-grade intraepithelial neoplasias
LiverThe image shows the transcriptomic changes along malignancy continuum.log2FC in expression of this searched gene in stem-like cells from each diseased tissue sample relative to stem-like cells in normal samples in each tissue plotted against the malignancy continuum. Samples are colored based on if they are from different disease stage.
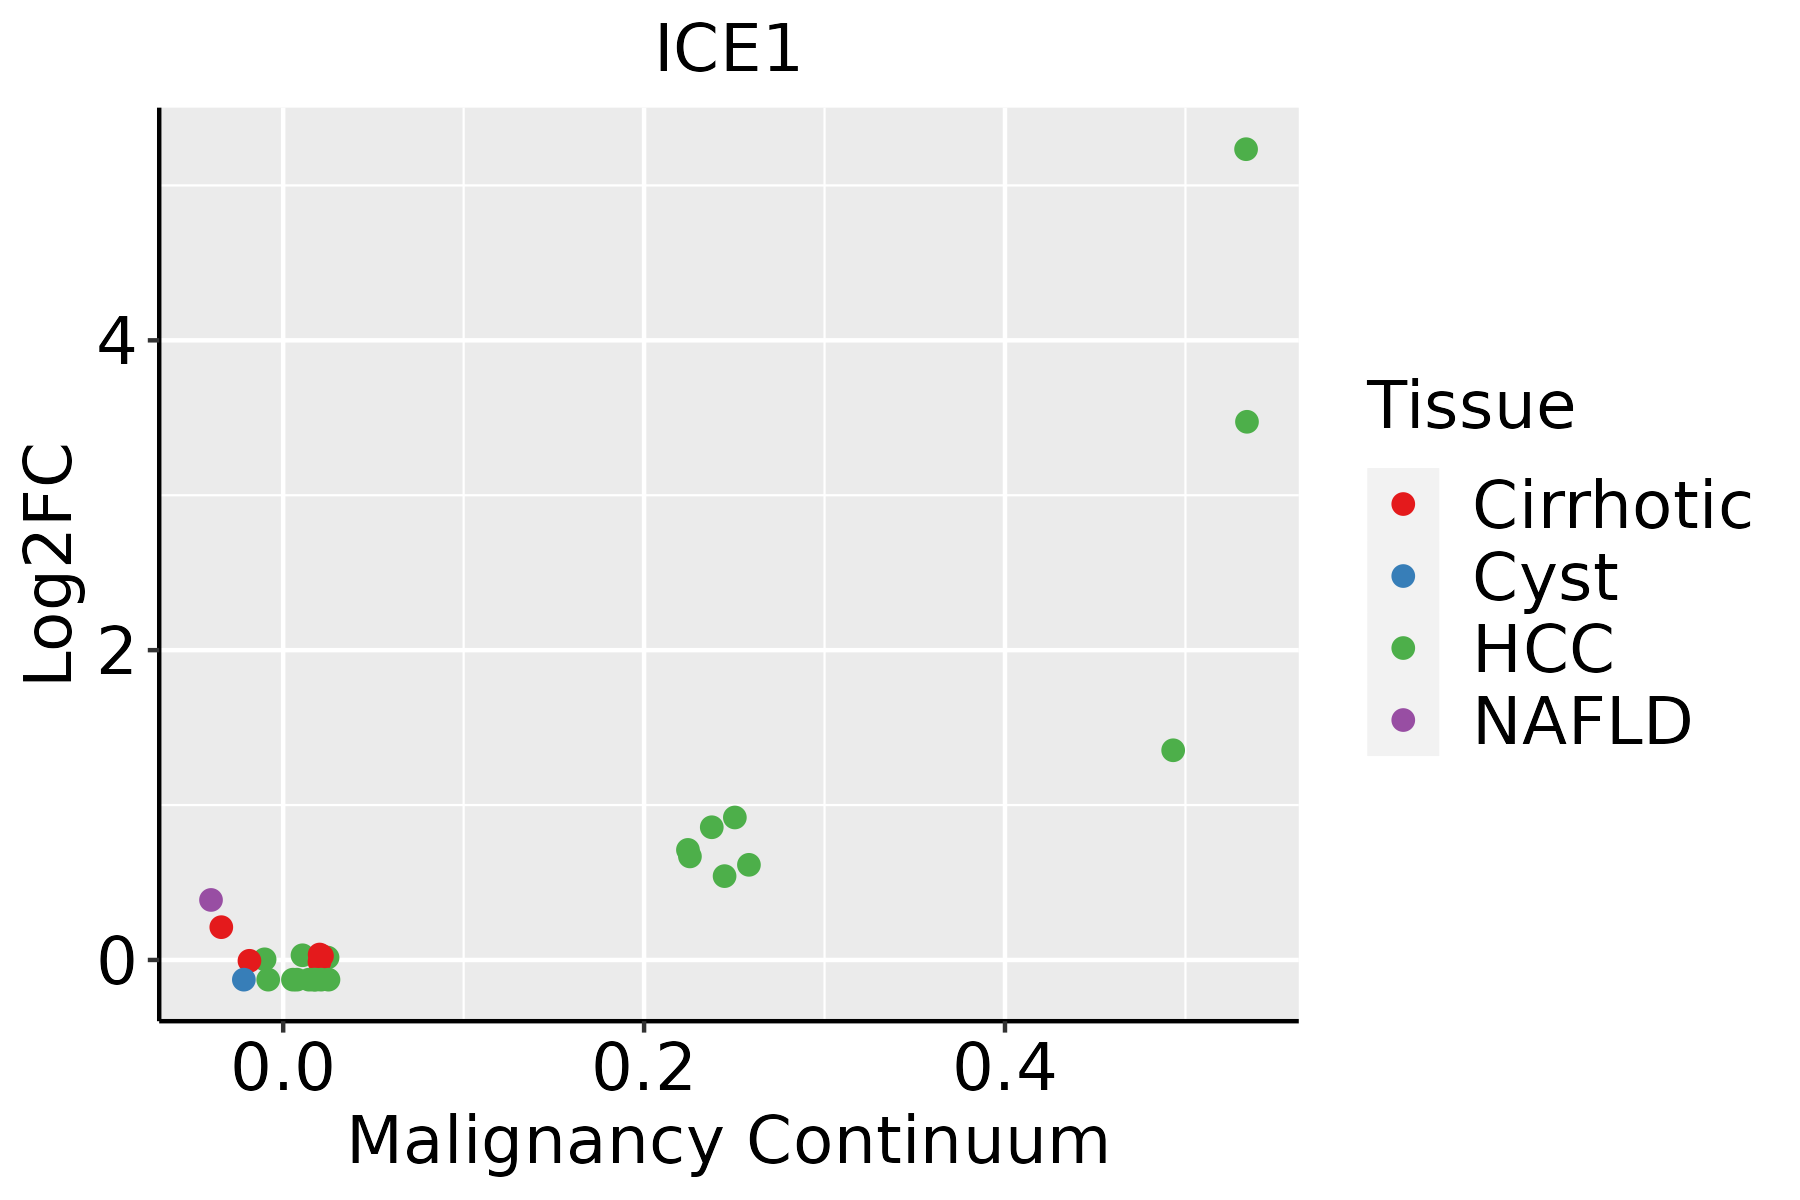
HCC: Hepatocellular carcinoma
NAFLD: Non-alcoholic fatty liver disease
Oral CavityThe image shows the transcriptomic changes along malignancy continuum.log2FC in expression of this searched gene in stem-like cells from each diseased tissue sample relative to stem-like cells in normal samples in each tissue plotted against the malignancy continuum. Samples are colored based on if they are from different disease stage.EOLP: Erosive Oral lichen planus
LP: leukoplakia
NEOLP: Non-erosive oral lichen planus
OSCC: Oral squamous cell carcinoma
ThyroidThe image shows the transcriptomic changes along malignancy continuum.log2FC in expression of this searched gene in stem-like cells from each diseased tissue sample relative to stem-like cells in normal samples in each tissue plotted against the malignancy continuum. Samples are colored based on if they are from different disease stage.ATC: Anaplastic thyroid cancer
HT: Hashimoto's thyroiditis
PTC: Papillary thyroid cancer
∗log2FC in expression of this searched gene in stem-like cells from each diseased tissue sample relative to stem-like cells in normal samples in each tissue plotted against the malignancy continuum. Samples are colored based on if they are from different disease stage.

Top

Malignant transformation related pathway analysis

check buttonFind out the enriched GO biological processes and KEGG pathways involved in transition from healthy to precancer to cancer
check button Figure of enriched GO biological processes.
TissueDisease StageEnriched GO biological Processes
ColorectumADGO analysis - Figure of enriched GO biological processes: Top 15 enriched GO BP terms are showed in the bar plot of each disease state in each tissue. Each row represents a significant GO biological process which is colored according to the -log10(p.adjust).
ColorectumSERGO analysis - Figure of enriched GO biological processes: Top 15 enriched GO BP terms are showed in the bar plot of each disease state in each tissue. Each row represents a significant GO biological process which is colored according to the -log10(p.adjust).
ColorectumMSSGO analysis - Figure of enriched GO biological processes: Top 15 enriched GO BP terms are showed in the bar plot of each disease state in each tissue. Each row represents a significant GO biological process which is colored according to the -log10(p.adjust).
ColorectumMSI-HGO analysis - Figure of enriched GO biological processes: Top 15 enriched GO BP terms are showed in the bar plot of each disease state in each tissue. Each row represents a significant GO biological process which is colored according to the -log10(p.adjust).
ColorectumFAPGO analysis - Figure of enriched GO biological processes: Top 15 enriched GO BP terms are showed in the bar plot of each disease state in each tissue. Each row represents a significant GO biological process which is colored according to the -log10(p.adjust).
∗Top 15 enriched GO BP terms are showed in the bar plot of each disease state in each tissue. Each row represents a significant GO biological process which is colored according to the -log10(p.adjust).
Page: 1 2 3 4 5 6 7 8 9 

check button Enriched GO biological processes.
GO IDTissueDisease StageDescriptionGene RatioBg Ratiopvaluep.adjustCount
GO:014001414EsophagusESCCmitotic nuclear division218/8552287/187236.17e-261.78e-23218
GO:003238618EsophagusESCCregulation of intracellular transport243/8552337/187233.20e-237.25e-21243
GO:005165617EsophagusESCCestablishment of organelle localization273/8552390/187239.13e-231.81e-20273
GO:000705911EsophagusESCCchromosome segregation238/8552346/187231.72e-181.82e-16238
GO:0033157110EsophagusESCCregulation of intracellular protein transport169/8552229/187233.31e-183.23e-16169
GO:0032388110EsophagusESCCpositive regulation of intracellular transport152/8552202/187237.89e-187.36e-16152
GO:190285015EsophagusESCCmicrotubule cytoskeleton organization involved in mitosis116/8552147/187231.25e-169.91e-15116
GO:0043254111EsophagusESCCregulation of protein-containing complex assembly278/8552428/187233.81e-162.77e-14278
GO:1904951111EsophagusESCCpositive regulation of establishment of protein localization216/8552319/187231.01e-156.86e-14216
GO:000705214EsophagusESCCmitotic spindle organization97/8552120/187232.17e-151.33e-1397
GO:009031617EsophagusESCCpositive regulation of intracellular protein transport122/8552160/187232.45e-151.49e-13122
GO:0051222111EsophagusESCCpositive regulation of protein transport204/8552303/187231.56e-148.38e-13204
GO:0031334111EsophagusESCCpositive regulation of protein-containing complex assembly166/8552237/187232.06e-141.07e-12166
GO:000705114EsophagusESCCspindle organization134/8552184/187235.70e-142.87e-12134
GO:005131011EsophagusESCCmetaphase plate congression58/855265/187231.81e-138.63e-1258
GO:00482853EsophagusESCCorganelle fission301/8552488/187234.64e-132.12e-11301
GO:00988133EsophagusESCCnuclear chromosome segregation187/8552281/187231.00e-124.36e-11187
GO:005130311EsophagusESCCestablishment of chromosome localization67/855280/187231.92e-128.09e-1167
GO:005000011EsophagusESCCchromosome localization68/855282/187233.37e-121.32e-1068
GO:00002802EsophagusESCCnuclear division270/8552439/187231.17e-114.24e-10270
Page: 1 2 3 4 5 

check button Enriched KEGG pathways.
Pathway IDTissueDisease StageDescriptionGene RatioBg Ratiopvaluep.adjustqvalueCount
Page: 1 

Top

Cell-cell communication analysis

check buttonIdentification of potential cell-cell interactions between two cell types and their ligand-receptor pairs for different disease states
LigandReceptorLRpairPathwayTissueDisease Stage
Page: 1 

Top

Single-cell gene regulatory network inference analysis

check buttonFind out the significant the regulons (TFs) and the target genes of each regulon across cell types for different disease states
TFCell TypeTissueDisease StageTarget GeneRSSRegulon Activity
∗The dot plots of a searched regulon are shown for all cell subpopulations in each disease state of each tissue based on the regulon specific score inferred using pySCENIC and by calculating the average expression.
Page: 1 

Top

Somatic mutation of malignant transformation related genes

check buttonAnnotation of somatic variants for genes involved in malignant transformation
Hugo SymbolVariant ClassVariant ClassificationdbSNP RSHGVScHGVSpHGVSp ShortSWISSPROTBIOTYPESIFTPolyPhenTumor Sample BarcodeTissueHistologySexAgeStageTherapy TypesDrugsOutcome
ICE1SNVMissense_Mutationnovelc.3328N>Cp.Glu1110Glnp.E1110QQ9Y2F5protein_codingdeleterious(0.01)benign(0.289)TCGA-5L-AAT1-01Breastbreast invasive carcinomaFemale<65III/IVHormone TherapyletrozolSD
ICE1SNVMissense_Mutationnovelc.1897T>Cp.Ser633Prop.S633PQ9Y2F5protein_codingtolerated(0.14)benign(0.043)TCGA-A2-A0EQ-01Breastbreast invasive carcinomaFemale<65I/IIChemotherapyadriamycinSD
ICE1SNVMissense_Mutationnovelc.4735N>Tp.His1579Tyrp.H1579YQ9Y2F5protein_codingtolerated(0.12)benign(0.132)TCGA-A7-A56D-01Breastbreast invasive carcinomaFemale>=65I/IIHormone TherapyarimidexSD
ICE1SNVMissense_Mutationc.147N>Ap.Asn49Lysp.N49KQ9Y2F5protein_codingdeleterious(0.01)probably_damaging(0.998)TCGA-A8-A076-01Breastbreast invasive carcinomaFemale>=65I/IIHormone TherapyanastrozoleSD
ICE1SNVMissense_Mutationnovelc.5107N>Ap.Ala1703Thrp.A1703TQ9Y2F5protein_codingtolerated(0.09)benign(0.338)TCGA-A8-A07G-01Breastbreast invasive carcinomaFemale>=65I/IIChemotherapy5-fluorouracilCR
ICE1SNVMissense_Mutationrs749575254c.4526G>Ap.Arg1509Hisp.R1509HQ9Y2F5protein_codingdeleterious(0.03)probably_damaging(0.973)TCGA-A8-A09A-01Breastbreast invasive carcinomaFemale<65I/IIHormone TherapytamoxiphenSD
ICE1SNVMissense_Mutationc.3484N>Cp.Ser1162Argp.S1162RQ9Y2F5protein_codingdeleterious(0)possibly_damaging(0.714)TCGA-A8-A09Q-01Breastbreast invasive carcinomaFemale>=65III/IVHormone TherapyanastrozoleSD
ICE1SNVMissense_Mutationc.1560N>Cp.Glu520Aspp.E520DQ9Y2F5protein_codingtolerated(0.4)benign(0.001)TCGA-AC-A23H-01Breastbreast invasive carcinomaFemale>=65I/IIUnknownUnknownPD
ICE1SNVMissense_Mutationc.2434N>Ap.Glu812Lysp.E812KQ9Y2F5protein_codingdeleterious(0.04)benign(0.342)TCGA-AC-A5XS-01Breastbreast invasive carcinomaFemale>=65I/IIHormone TherapyfemaraSD
ICE1SNVMissense_Mutationrs773709911c.4036C>Tp.Pro1346Serp.P1346SQ9Y2F5protein_codingtolerated(0.23)benign(0.125)TCGA-AN-A0AK-01Breastbreast invasive carcinomaFemale>=65I/IIUnknownUnknownSD
Page: 1 2 3 4 5 6 7 8 9 10 11 12 13 14 15 16 17 18 19 20 21 22 23 24 25 26 27 28 29 30 31 

Top

Related drugs of malignant transformation related genes

check buttonIdentification of chemicals and drugs interact with genes involved in malignant transfromation
(DGIdb 4.0)
Entrez IDSymbolCategoryInteraction TypesDrug Claim NameDrug NamePMIDs
Page: 1