
|
|||||
|
 | |
| |
| |
| |
| |
| |
|
Gene: HTATIP2 |
Gene summary for HTATIP2 |
| Gene information | Species | Human | Gene symbol | HTATIP2 | Gene ID | 10553 |
| Gene name | HIV-1 Tat interactive protein 2 | |
| Gene Alias | CC3 | |
| Cytomap | 11p15.1 | |
| Gene Type | protein-coding | GO ID | GO:0001525 | UniProtAcc | Q9BUP3 |
Top |
Malignant transformation analysis |
| Identification of the aberrant gene expression in precancerous and cancerous lesions by comparing the gene expression of stem-like cells in diseased tissues with normal stem cells |
| Entrez ID | Symbol | Replicates | Species | Organ | Tissue | Adj P-value | Log2FC | Malignancy |
| 10553 | HTATIP2 | HTA11_3410_2000001011 | Human | Colorectum | AD | 6.55e-03 | 1.63e-01 | 0.0155 |
| 10553 | HTATIP2 | HTA11_2487_2000001011 | Human | Colorectum | SER | 1.85e-03 | 4.25e-01 | -0.1808 |
| 10553 | HTATIP2 | HTA11_1938_2000001011 | Human | Colorectum | AD | 8.73e-09 | 6.40e-01 | -0.0811 |
| 10553 | HTATIP2 | HTA11_78_2000001011 | Human | Colorectum | AD | 3.62e-10 | 5.68e-01 | -0.1088 |
| 10553 | HTATIP2 | HTA11_347_2000001011 | Human | Colorectum | AD | 1.53e-13 | 5.74e-01 | -0.1954 |
| 10553 | HTATIP2 | HTA11_83_2000001011 | Human | Colorectum | SER | 9.84e-03 | 3.94e-01 | -0.1526 |
| 10553 | HTATIP2 | HTA11_866_2000001011 | Human | Colorectum | AD | 1.02e-03 | 2.00e-01 | -0.1001 |
| 10553 | HTATIP2 | HTA11_1391_2000001011 | Human | Colorectum | AD | 1.95e-08 | 4.81e-01 | -0.059 |
| 10553 | HTATIP2 | HTA11_7862_2000001011 | Human | Colorectum | AD | 6.81e-05 | 4.11e-01 | -0.0179 |
| 10553 | HTATIP2 | HTA11_866_3004761011 | Human | Colorectum | AD | 6.71e-06 | 3.71e-01 | 0.096 |
| 10553 | HTATIP2 | HTA11_99999970781_79442 | Human | Colorectum | MSS | 8.73e-17 | 5.93e-01 | 0.294 |
| 10553 | HTATIP2 | HTA11_99999965104_69814 | Human | Colorectum | MSS | 3.15e-04 | 5.07e-01 | 0.281 |
| 10553 | HTATIP2 | HTA11_99999971662_82457 | Human | Colorectum | MSS | 4.64e-18 | 5.40e-01 | 0.3859 |
| 10553 | HTATIP2 | HTA11_99999973899_84307 | Human | Colorectum | MSS | 4.83e-02 | 4.02e-01 | 0.2585 |
| 10553 | HTATIP2 | LZE2T | Human | Esophagus | ESCC | 4.85e-07 | 6.76e-01 | 0.082 |
| 10553 | HTATIP2 | LZE4T | Human | Esophagus | ESCC | 1.95e-44 | 1.62e+00 | 0.0811 |
| 10553 | HTATIP2 | LZE5T | Human | Esophagus | ESCC | 1.39e-03 | 4.67e-01 | 0.0514 |
| 10553 | HTATIP2 | LZE7T | Human | Esophagus | ESCC | 1.40e-09 | 8.16e-01 | 0.0667 |
| 10553 | HTATIP2 | LZE8T | Human | Esophagus | ESCC | 5.40e-14 | 3.57e-01 | 0.067 |
| 10553 | HTATIP2 | LZE20T | Human | Esophagus | ESCC | 4.45e-11 | 4.27e-01 | 0.0662 |
| Page: 1 2 3 4 5 6 7 8 |
| Tissue | Expression Dynamics | Abbreviation |
| Colorectum (GSE201348) |  | FAP: Familial adenomatous polyposis |
| CRC: Colorectal cancer | ||
| Colorectum (HTA11) |  | AD: Adenomas |
| SER: Sessile serrated lesions | ||
| MSI-H: Microsatellite-high colorectal cancer | ||
| MSS: Microsatellite stable colorectal cancer | ||
| Esophagus | 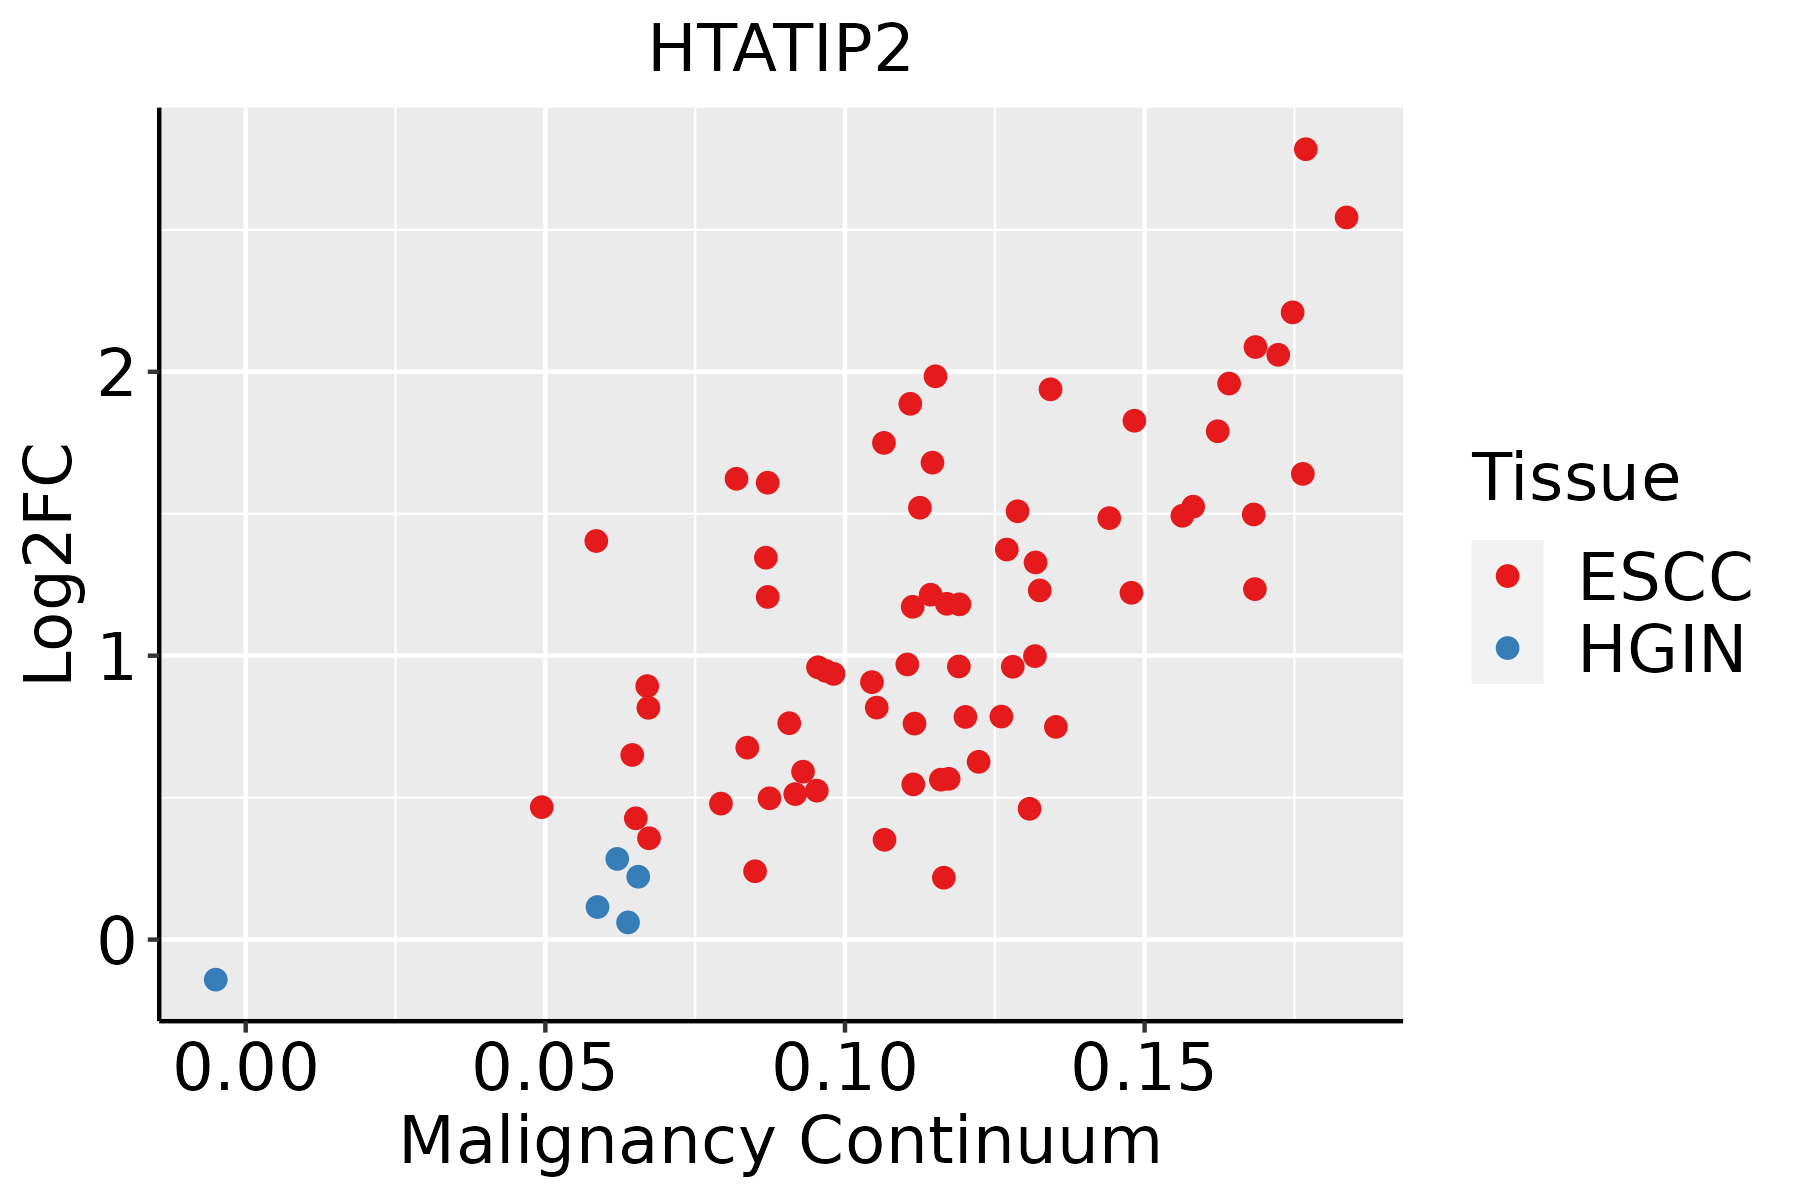 | ESCC: Esophageal squamous cell carcinoma |
| HGIN: High-grade intraepithelial neoplasias | ||
| LGIN: Low-grade intraepithelial neoplasias | ||
| Liver | 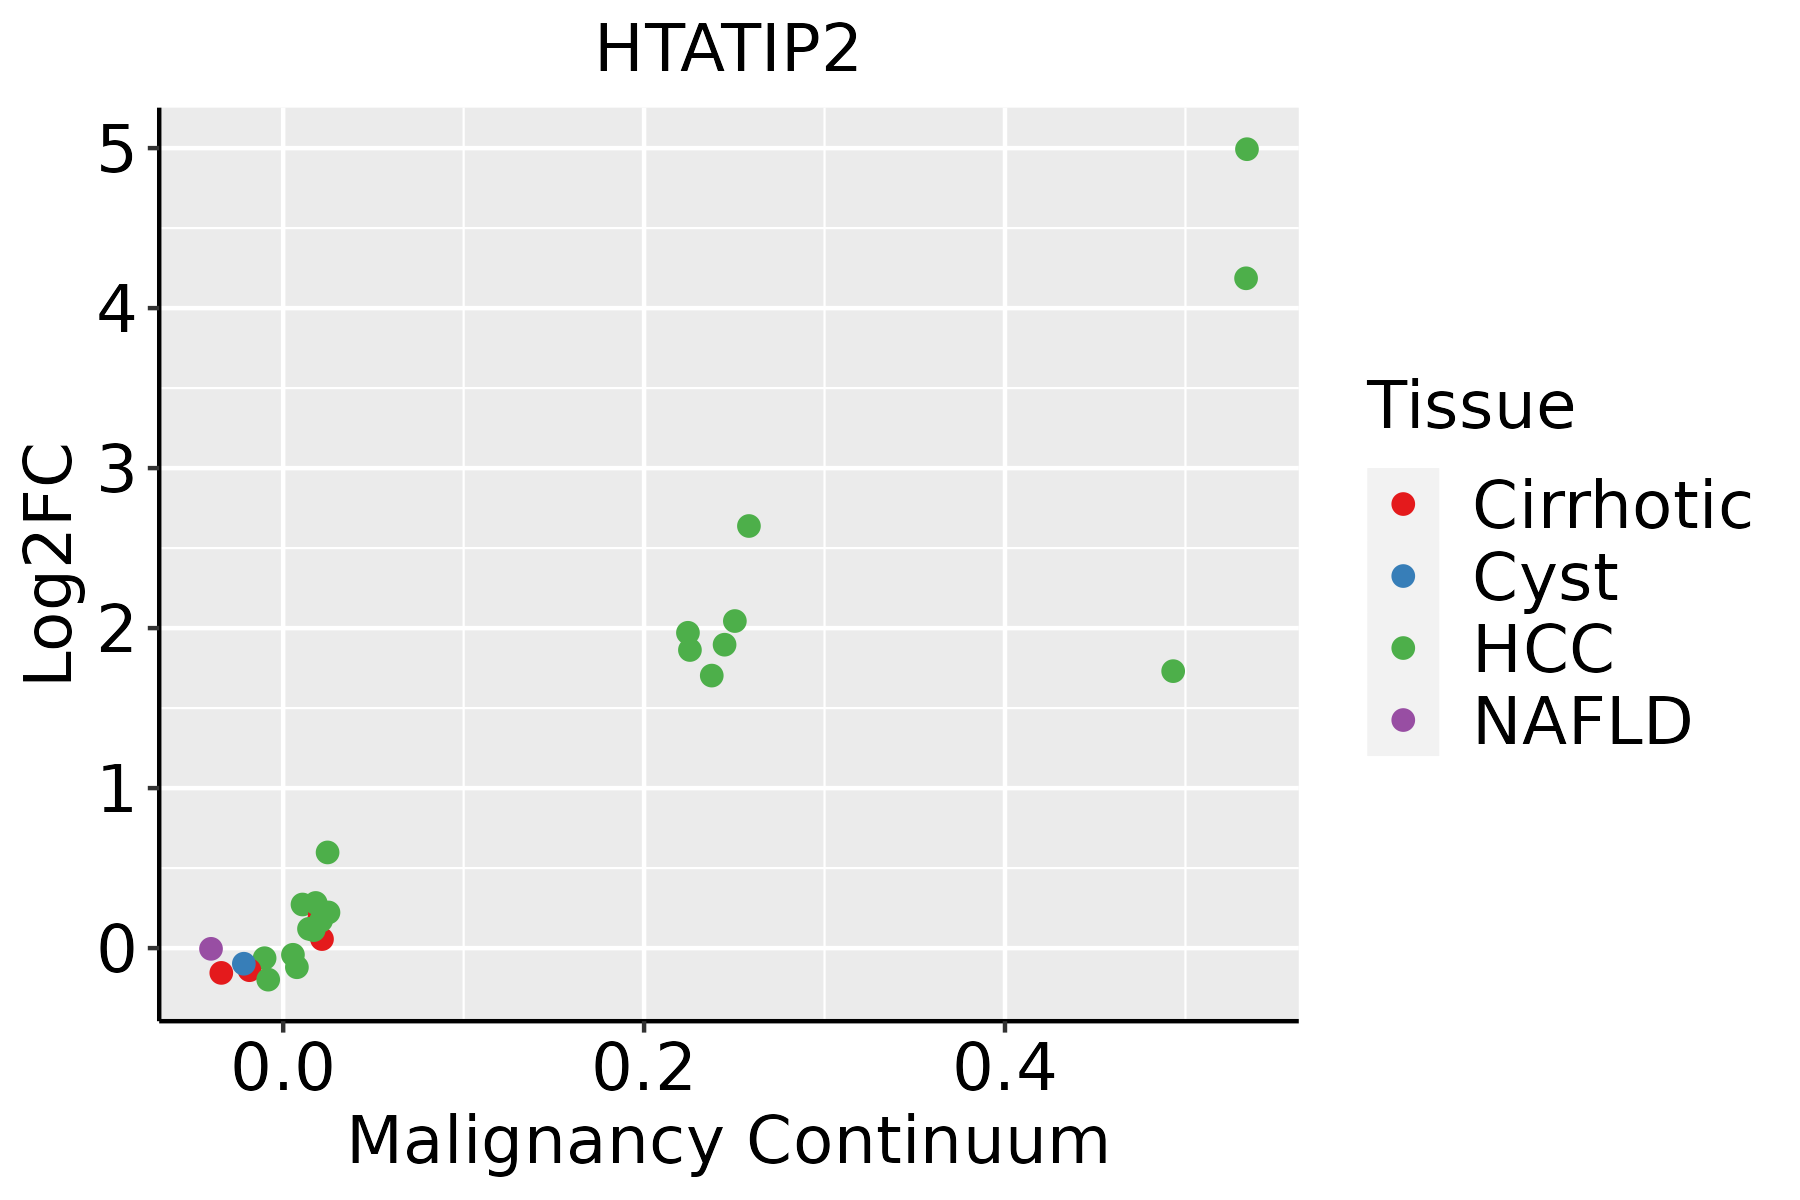 | HCC: Hepatocellular carcinoma |
| NAFLD: Non-alcoholic fatty liver disease | ||
| Oral Cavity |  | EOLP: Erosive Oral lichen planus |
| LP: leukoplakia | ||
| NEOLP: Non-erosive oral lichen planus | ||
| OSCC: Oral squamous cell carcinoma | ||
| Skin | 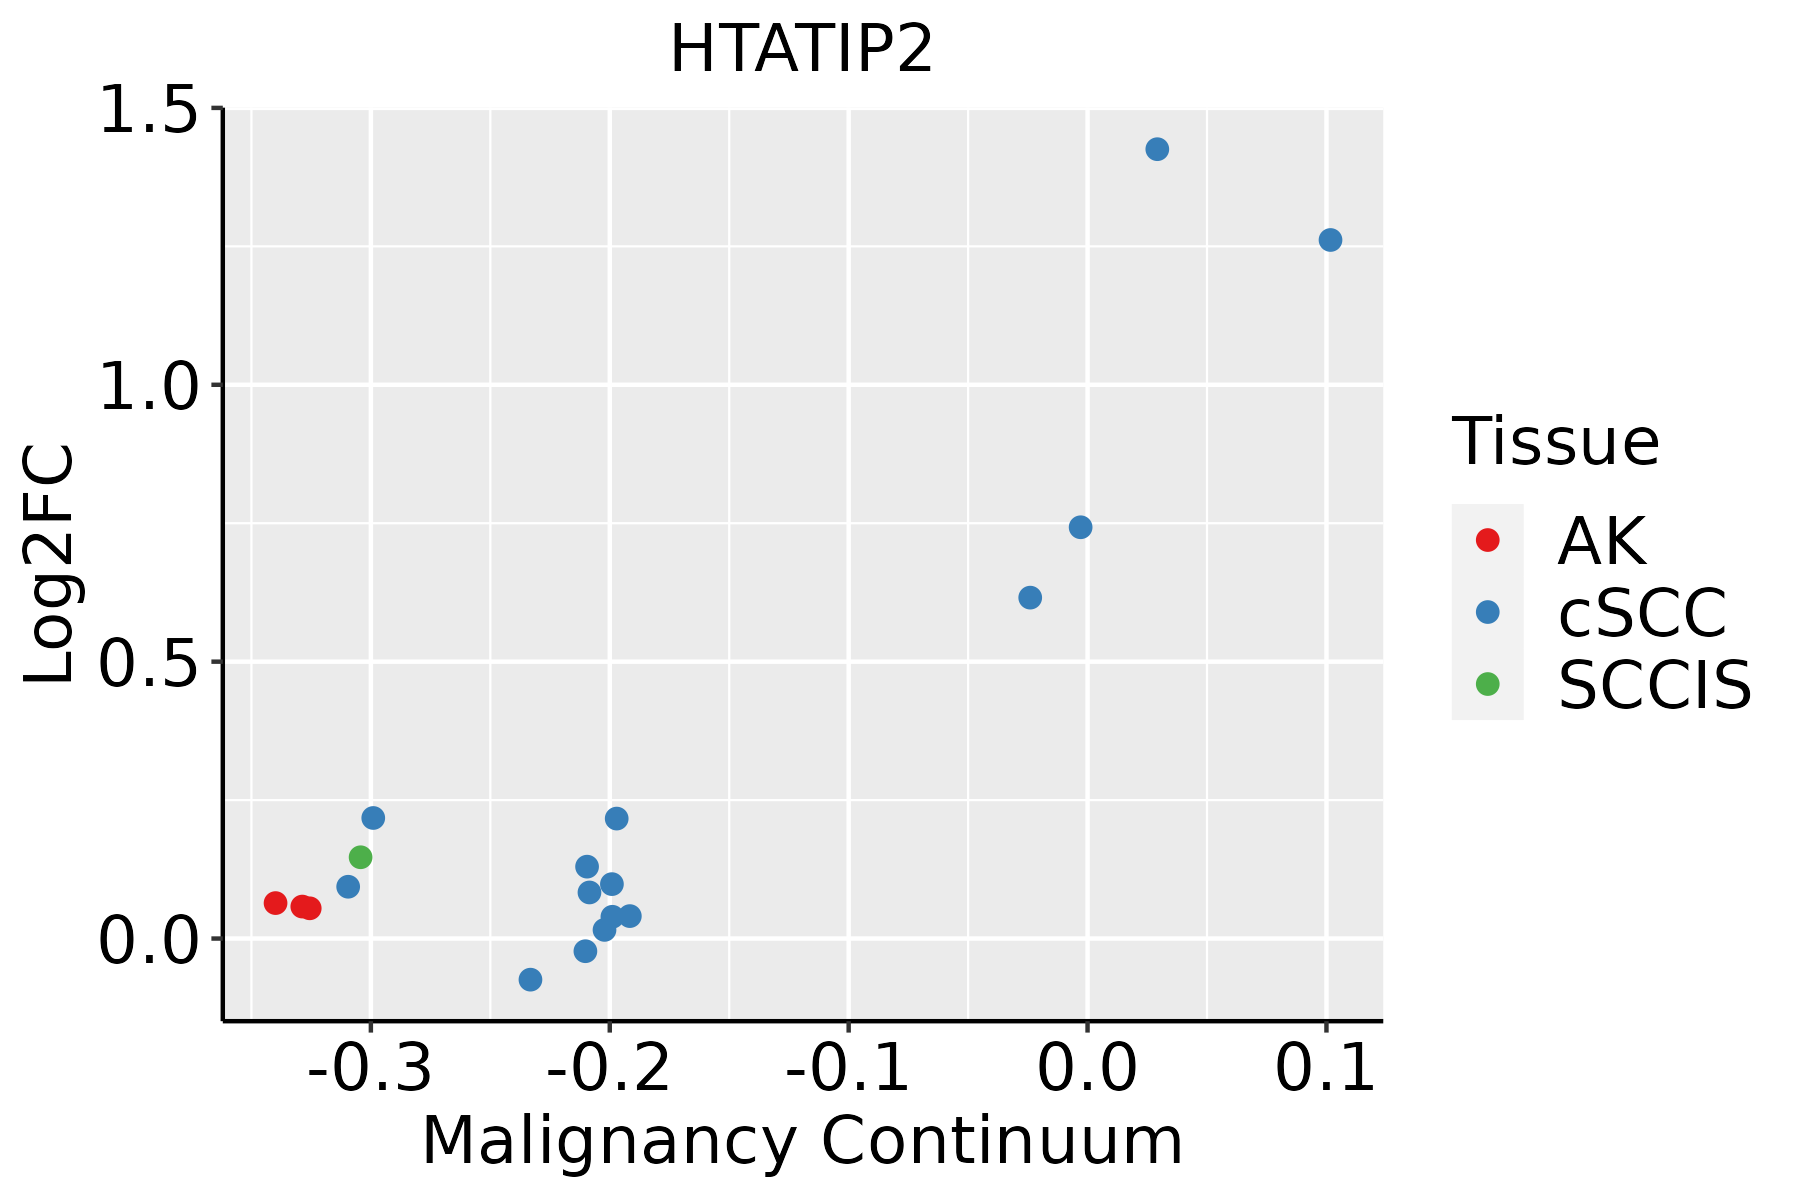 | AK: Actinic keratosis |
| cSCC: Cutaneous squamous cell carcinoma | ||
| SCCIS:squamous cell carcinoma in situ | ||
| Thyroid |  | ATC: Anaplastic thyroid cancer |
| HT: Hashimoto's thyroiditis | ||
| PTC: Papillary thyroid cancer |
| ∗log2FC in expression of this searched gene in stem-like cells from each diseased tissue sample relative to stem-like cells in normal samples in each tissue plotted against the malignancy continuum. Samples are colored based on if they are from different disease stage. |
Top |
Malignant transformation related pathway analysis |
| Find out the enriched GO biological processes and KEGG pathways involved in transition from healthy to precancer to cancer |
| Tissue | Disease Stage | Enriched GO biological Processes |
| Colorectum | AD |  |
| Colorectum | SER |  |
| Colorectum | MSS |  |
| Colorectum | MSI-H |  |
| Colorectum | FAP |  |
| ∗Top 15 enriched GO BP terms are showed in the bar plot of each disease state in each tissue. Each row represents a significant GO biological process which is colored according to the -log10(p.adjust). |
| Page: 1 2 3 4 5 6 7 8 9 |
| GO ID | Tissue | Disease Stage | Description | Gene Ratio | Bg Ratio | pvalue | p.adjust | Count |
| GO:005116912 | Liver | Cirrhotic | nuclear transport | 118/4634 | 301/18723 | 1.71e-08 | 6.27e-07 | 118 |
| GO:00511706 | Liver | Cirrhotic | import into nucleus | 54/4634 | 159/18723 | 5.59e-03 | 2.83e-02 | 54 |
| GO:000691322 | Liver | HCC | nucleocytoplasmic transport | 208/7958 | 301/18723 | 5.51e-21 | 8.12e-19 | 208 |
| GO:005116922 | Liver | HCC | nuclear transport | 208/7958 | 301/18723 | 5.51e-21 | 8.12e-19 | 208 |
| GO:005117011 | Liver | HCC | import into nucleus | 102/7958 | 159/18723 | 2.78e-08 | 6.39e-07 | 102 |
| GO:00467775 | Liver | HCC | protein autophosphorylation | 123/7958 | 227/18723 | 2.40e-04 | 1.80e-03 | 123 |
| GO:000691317 | Oral cavity | OSCC | nucleocytoplasmic transport | 204/7305 | 301/18723 | 2.65e-24 | 6.98e-22 | 204 |
| GO:005116917 | Oral cavity | OSCC | nuclear transport | 204/7305 | 301/18723 | 2.65e-24 | 6.98e-22 | 204 |
| GO:00511709 | Oral cavity | OSCC | import into nucleus | 100/7305 | 159/18723 | 8.67e-10 | 2.15e-08 | 100 |
| GO:00467779 | Oral cavity | OSCC | protein autophosphorylation | 123/7305 | 227/18723 | 2.31e-06 | 2.93e-05 | 123 |
| GO:000691318 | Oral cavity | LP | nucleocytoplasmic transport | 130/4623 | 301/18723 | 1.19e-12 | 9.77e-11 | 130 |
| GO:005116918 | Oral cavity | LP | nuclear transport | 130/4623 | 301/18723 | 1.19e-12 | 9.77e-11 | 130 |
| GO:005117013 | Oral cavity | LP | import into nucleus | 65/4623 | 159/18723 | 4.78e-06 | 9.69e-05 | 65 |
| GO:000691324 | Skin | cSCC | nucleocytoplasmic transport | 162/4864 | 301/18723 | 4.20e-25 | 1.10e-22 | 162 |
| GO:005116924 | Skin | cSCC | nuclear transport | 162/4864 | 301/18723 | 4.20e-25 | 1.10e-22 | 162 |
| GO:005117016 | Skin | cSCC | import into nucleus | 77/4864 | 159/18723 | 9.17e-10 | 3.58e-08 | 77 |
| GO:004677715 | Skin | cSCC | protein autophosphorylation | 84/4864 | 227/18723 | 1.53e-04 | 1.35e-03 | 84 |
| GO:0006913112 | Thyroid | PTC | nucleocytoplasmic transport | 181/5968 | 301/18723 | 2.93e-24 | 7.69e-22 | 181 |
| GO:0051169112 | Thyroid | PTC | nuclear transport | 181/5968 | 301/18723 | 2.93e-24 | 7.69e-22 | 181 |
| GO:005117017 | Thyroid | PTC | import into nucleus | 85/5968 | 159/18723 | 1.30e-08 | 3.08e-07 | 85 |
| Page: 1 2 3 |
| Pathway ID | Tissue | Disease Stage | Description | Gene Ratio | Bg Ratio | pvalue | p.adjust | qvalue | Count |
| Page: 1 |
Top |
Cell-cell communication analysis |
| Identification of potential cell-cell interactions between two cell types and their ligand-receptor pairs for different disease states |
| Ligand | Receptor | LRpair | Pathway | Tissue | Disease Stage |
| Page: 1 |
Top |
Single-cell gene regulatory network inference analysis |
| Find out the significant the regulons (TFs) and the target genes of each regulon across cell types for different disease states |
| TF | Cell Type | Tissue | Disease Stage | Target Gene | RSS | Regulon Activity |
| ∗The dot plots of a searched regulon are shown for all cell subpopulations in each disease state of each tissue based on the regulon specific score inferred using pySCENIC and by calculating the average expression. |
| Page: 1 |
Top |
Somatic mutation of malignant transformation related genes |
| Annotation of somatic variants for genes involved in malignant transformation |
| Hugo Symbol | Variant Class | Variant Classification | dbSNP RS | HGVSc | HGVSp | HGVSp Short | SWISSPROT | BIOTYPE | SIFT | PolyPhen | Tumor Sample Barcode | Tissue | Histology | Sex | Age | Stage | Therapy Types | Drugs | Outcome |
| HTATIP2 | SNV | Missense_Mutation | c.683C>T | p.Ser228Phe | p.S228F | Q9BUP3 | protein_coding | tolerated(0.39) | benign(0.003) | TCGA-AC-A23H-01 | Breast | breast invasive carcinoma | Female | >=65 | I/II | Unknown | Unknown | PD | |
| HTATIP2 | SNV | Missense_Mutation | novel | c.663N>A | p.Phe221Leu | p.F221L | Q9BUP3 | protein_coding | tolerated(0.51) | benign(0.007) | TCGA-AA-3984-01 | Colorectum | colon adenocarcinoma | Female | <65 | I/II | Unknown | Unknown | SD |
| HTATIP2 | SNV | Missense_Mutation | c.758N>G | p.Asp253Gly | p.D253G | Q9BUP3 | protein_coding | tolerated(0.13) | benign(0.003) | TCGA-AA-A010-01 | Colorectum | colon adenocarcinoma | Female | <65 | I/II | Chemotherapy | folinic | CR | |
| HTATIP2 | SNV | Missense_Mutation | rs748188484 | c.337G>A | p.Ala113Thr | p.A113T | Q9BUP3 | protein_coding | deleterious(0.03) | possibly_damaging(0.652) | TCGA-CK-4951-01 | Colorectum | colon adenocarcinoma | Female | >=65 | I/II | Unknown | Unknown | PD |
| HTATIP2 | SNV | Missense_Mutation | novel | c.561N>T | p.Lys187Asn | p.K187N | Q9BUP3 | protein_coding | tolerated(0.29) | benign(0.125) | TCGA-A5-A0G2-01 | Endometrium | uterine corpus endometrioid carcinoma | Female | <65 | III/IV | Unknown | Unknown | SD |
| HTATIP2 | SNV | Missense_Mutation | novel | c.115G>A | p.Glu39Lys | p.E39K | Q9BUP3 | protein_coding | deleterious(0.02) | benign(0.079) | TCGA-AJ-A3EL-01 | Endometrium | uterine corpus endometrioid carcinoma | Female | <65 | I/II | Unknown | Unknown | SD |
| HTATIP2 | SNV | Missense_Mutation | c.206N>C | p.Leu69Ser | p.L69S | Q9BUP3 | protein_coding | deleterious(0) | probably_damaging(0.981) | TCGA-AP-A056-01 | Endometrium | uterine corpus endometrioid carcinoma | Female | <65 | I/II | Unknown | Unknown | SD | |
| HTATIP2 | SNV | Missense_Mutation | rs778154551 | c.635N>A | p.Arg212His | p.R212H | Q9BUP3 | protein_coding | deleterious(0) | probably_damaging(0.999) | TCGA-B5-A11E-01 | Endometrium | uterine corpus endometrioid carcinoma | Female | <65 | I/II | Unknown | Unknown | SD |
| HTATIP2 | SNV | Missense_Mutation | rs778154551 | c.635N>A | p.Arg212His | p.R212H | Q9BUP3 | protein_coding | deleterious(0) | probably_damaging(0.999) | TCGA-B5-A3FA-01 | Endometrium | uterine corpus endometrioid carcinoma | Female | >=65 | I/II | Unknown | Unknown | SD |
| HTATIP2 | SNV | Missense_Mutation | novel | c.610N>A | p.Leu204Met | p.L204M | Q9BUP3 | protein_coding | deleterious(0) | probably_damaging(0.997) | TCGA-BS-A0UF-01 | Endometrium | uterine corpus endometrioid carcinoma | Female | >=65 | I/II | Unknown | Unknown | SD |
| Page: 1 2 |
Top |
Related drugs of malignant transformation related genes |
| Identification of chemicals and drugs interact with genes involved in malignant transfromation |
| (DGIdb 4.0) |
| Entrez ID | Symbol | Category | Interaction Types | Drug Claim Name | Drug Name | PMIDs |
| Page: 1 |

Copyright 2023-Present -The University of Texas Health Science Center at Houston |