
|
|||||
|
 | |
| |
| |
| |
| |
| |
|
Gene: HOXA5 |
Gene summary for HOXA5 |
| Gene information | Species | Human | Gene symbol | HOXA5 | Gene ID | 3202 |
| Gene name | homeobox A5 | |
| Gene Alias | HOX1 | |
| Cytomap | 7p15.2 | |
| Gene Type | protein-coding | GO ID | GO:0001501 | UniProtAcc | P20719 |
Top |
Malignant transformation analysis |
| Identification of the aberrant gene expression in precancerous and cancerous lesions by comparing the gene expression of stem-like cells in diseased tissues with normal stem cells |
| Entrez ID | Symbol | Replicates | Species | Organ | Tissue | Adj P-value | Log2FC | Malignancy |
| 3202 | HOXA5 | LZE22T | Human | Esophagus | ESCC | 2.18e-03 | 5.68e-01 | 0.068 |
| 3202 | HOXA5 | P1T-E | Human | Esophagus | ESCC | 1.58e-02 | 2.38e-01 | 0.0875 |
| 3202 | HOXA5 | P4T-E | Human | Esophagus | ESCC | 2.62e-07 | 2.33e-01 | 0.1323 |
| 3202 | HOXA5 | P8T-E | Human | Esophagus | ESCC | 5.60e-07 | 1.16e-01 | 0.0889 |
| 3202 | HOXA5 | P9T-E | Human | Esophagus | ESCC | 9.76e-11 | 2.63e-01 | 0.1131 |
| 3202 | HOXA5 | P10T-E | Human | Esophagus | ESCC | 4.47e-10 | 1.96e-01 | 0.116 |
| 3202 | HOXA5 | P15T-E | Human | Esophagus | ESCC | 3.13e-02 | 5.35e-02 | 0.1149 |
| 3202 | HOXA5 | P16T-E | Human | Esophagus | ESCC | 3.27e-05 | 1.15e-01 | 0.1153 |
| 3202 | HOXA5 | P20T-E | Human | Esophagus | ESCC | 1.01e-08 | 2.40e-01 | 0.1124 |
| 3202 | HOXA5 | P21T-E | Human | Esophagus | ESCC | 4.61e-04 | 6.12e-02 | 0.1617 |
| 3202 | HOXA5 | P22T-E | Human | Esophagus | ESCC | 7.27e-04 | 2.85e-01 | 0.1236 |
| 3202 | HOXA5 | P23T-E | Human | Esophagus | ESCC | 5.57e-05 | 7.90e-02 | 0.108 |
| 3202 | HOXA5 | P24T-E | Human | Esophagus | ESCC | 5.33e-03 | 1.26e-01 | 0.1287 |
| 3202 | HOXA5 | P26T-E | Human | Esophagus | ESCC | 1.77e-06 | 9.51e-02 | 0.1276 |
| 3202 | HOXA5 | P27T-E | Human | Esophagus | ESCC | 1.94e-08 | 1.10e-01 | 0.1055 |
| 3202 | HOXA5 | P28T-E | Human | Esophagus | ESCC | 3.08e-03 | 1.35e-01 | 0.1149 |
| 3202 | HOXA5 | P30T-E | Human | Esophagus | ESCC | 2.88e-09 | 3.16e-01 | 0.137 |
| 3202 | HOXA5 | P36T-E | Human | Esophagus | ESCC | 1.01e-03 | 1.19e-01 | 0.1187 |
| 3202 | HOXA5 | P37T-E | Human | Esophagus | ESCC | 5.55e-05 | 1.40e-01 | 0.1371 |
| 3202 | HOXA5 | P39T-E | Human | Esophagus | ESCC | 6.92e-05 | 5.24e-02 | 0.0894 |
| Page: 1 2 |
| Tissue | Expression Dynamics | Abbreviation |
| Esophagus | 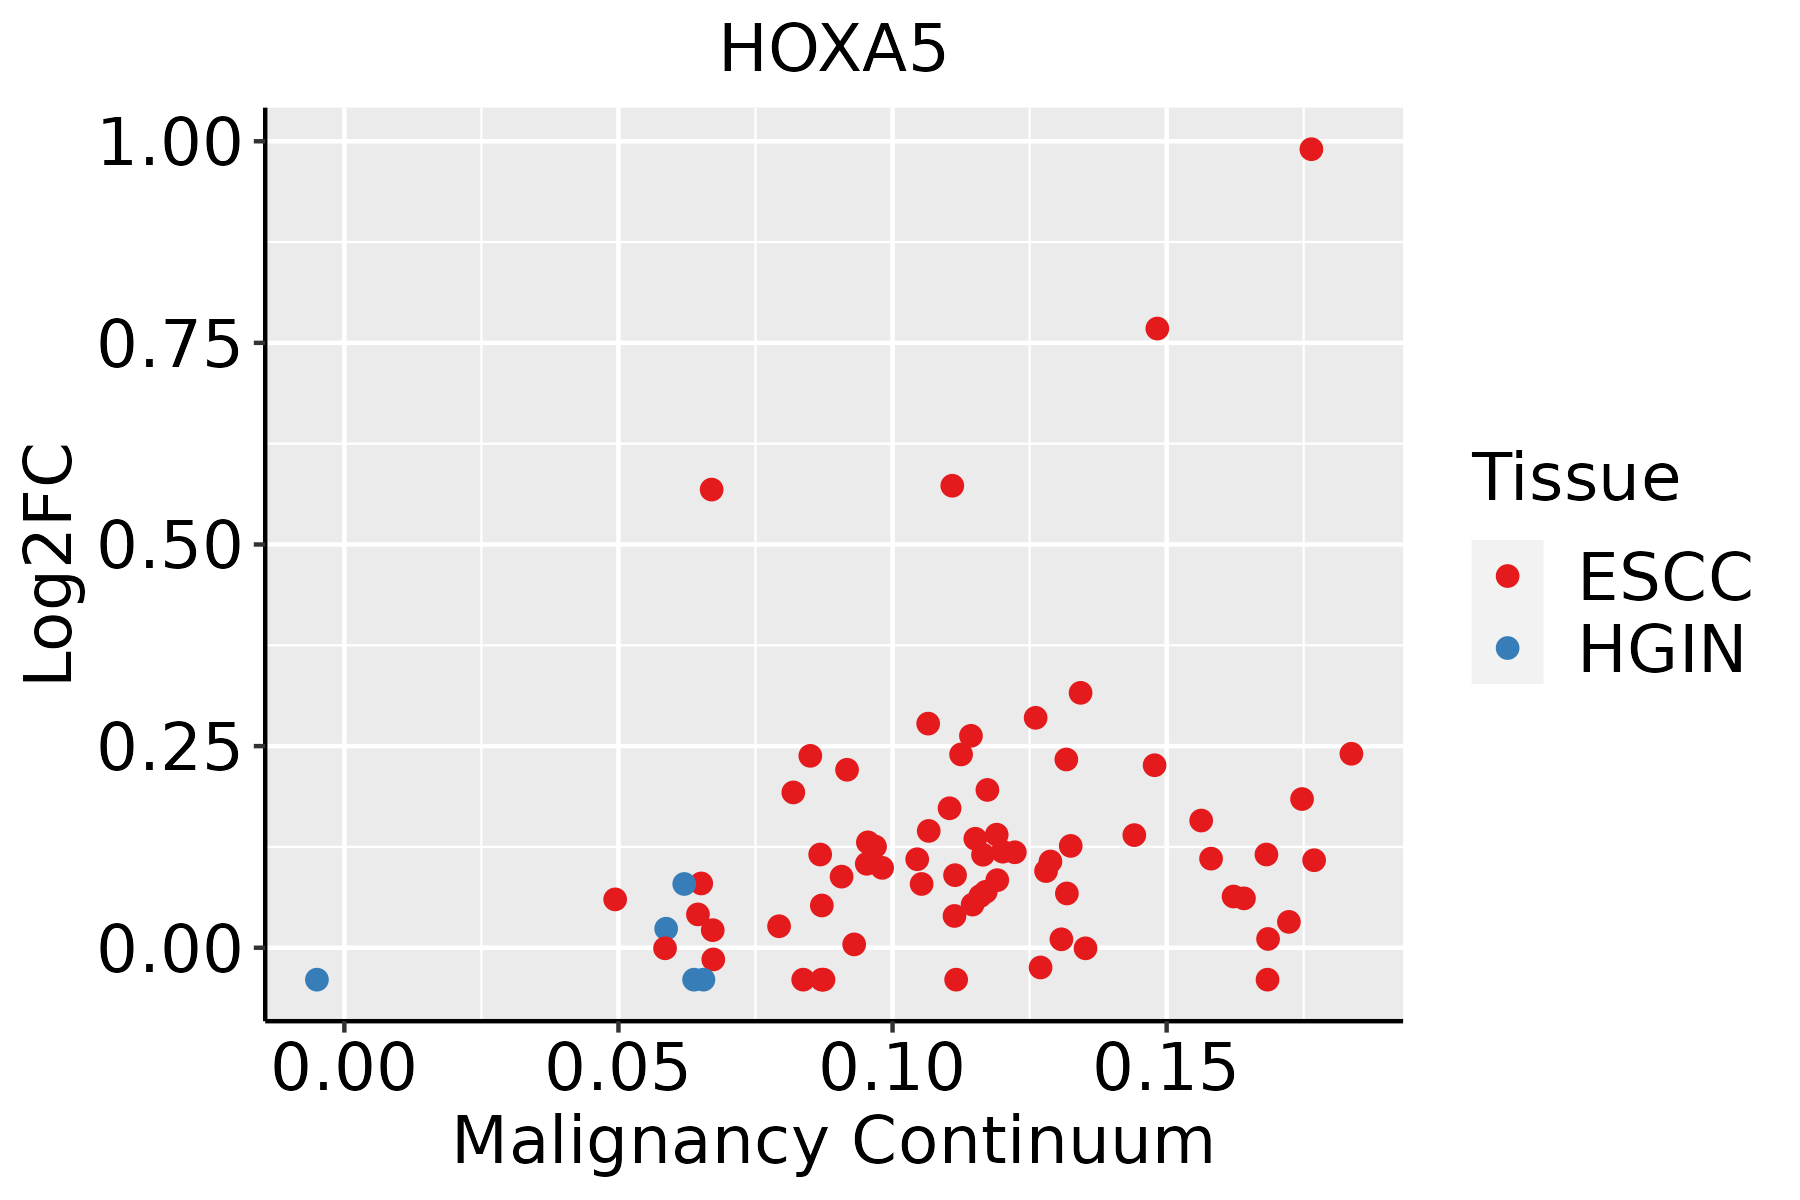 | ESCC: Esophageal squamous cell carcinoma |
| HGIN: High-grade intraepithelial neoplasias | ||
| LGIN: Low-grade intraepithelial neoplasias |
| ∗log2FC in expression of this searched gene in stem-like cells from each diseased tissue sample relative to stem-like cells in normal samples in each tissue plotted against the malignancy continuum. Samples are colored based on if they are from different disease stage. |
Top |
Malignant transformation related pathway analysis |
| Find out the enriched GO biological processes and KEGG pathways involved in transition from healthy to precancer to cancer |
| Tissue | Disease Stage | Enriched GO biological Processes |
| Colorectum | AD |  |
| Colorectum | SER |  |
| Colorectum | MSS |  |
| Colorectum | MSI-H |  |
| Colorectum | FAP |  |
| ∗Top 15 enriched GO BP terms are showed in the bar plot of each disease state in each tissue. Each row represents a significant GO biological process which is colored according to the -log10(p.adjust). |
| Page: 1 2 3 4 5 6 7 8 9 |
| GO ID | Tissue | Disease Stage | Description | Gene Ratio | Bg Ratio | pvalue | p.adjust | Count |
| GO:00604414 | Esophagus | ESCC | epithelial tube branching involved in lung morphogenesis | 22/8552 | 29/18723 | 9.30e-04 | 4.73e-03 | 22 |
| GO:003359815 | Esophagus | ESCC | mammary gland epithelial cell proliferation | 20/8552 | 26/18723 | 1.19e-03 | 5.88e-03 | 20 |
| GO:0045637111 | Esophagus | ESCC | regulation of myeloid cell differentiation | 118/8552 | 210/18723 | 1.35e-03 | 6.43e-03 | 118 |
| GO:004564619 | Esophagus | ESCC | regulation of erythrocyte differentiation | 32/8552 | 47/18723 | 1.59e-03 | 7.43e-03 | 32 |
| GO:00611807 | Esophagus | ESCC | mammary gland epithelium development | 43/8552 | 67/18723 | 1.73e-03 | 7.97e-03 | 43 |
| GO:00605763 | Esophagus | ESCC | intestinal epithelial cell development | 12/8552 | 14/18723 | 2.51e-03 | 1.08e-02 | 12 |
| GO:006047913 | Esophagus | ESCC | lung cell differentiation | 18/8552 | 24/18723 | 3.43e-03 | 1.41e-02 | 18 |
| GO:00604856 | Esophagus | ESCC | mesenchyme development | 156/8552 | 291/18723 | 3.76e-03 | 1.53e-02 | 156 |
| GO:00487052 | Esophagus | ESCC | skeletal system morphogenesis | 120/8552 | 220/18723 | 4.90e-03 | 1.89e-02 | 120 |
| GO:0002066 | Esophagus | ESCC | columnar/cuboidal epithelial cell development | 29/8552 | 44/18723 | 5.41e-03 | 2.02e-02 | 29 |
| GO:00604872 | Esophagus | ESCC | lung epithelial cell differentiation | 17/8552 | 23/18723 | 5.73e-03 | 2.13e-02 | 17 |
| GO:003359911 | Esophagus | ESCC | regulation of mammary gland epithelial cell proliferation | 12/8552 | 15/18723 | 7.31e-03 | 2.63e-02 | 12 |
| GO:00017639 | Esophagus | ESCC | morphogenesis of a branching structure | 106/8552 | 196/18723 | 1.08e-02 | 3.66e-02 | 106 |
| GO:00512161 | Esophagus | ESCC | cartilage development | 103/8552 | 190/18723 | 1.08e-02 | 3.67e-02 | 103 |
| Page: 1 2 |
| Pathway ID | Tissue | Disease Stage | Description | Gene Ratio | Bg Ratio | pvalue | p.adjust | qvalue | Count |
| Page: 1 |
Top |
Cell-cell communication analysis |
| Identification of potential cell-cell interactions between two cell types and their ligand-receptor pairs for different disease states |
| Ligand | Receptor | LRpair | Pathway | Tissue | Disease Stage |
| Page: 1 |
Top |
Single-cell gene regulatory network inference analysis |
| Find out the significant the regulons (TFs) and the target genes of each regulon across cell types for different disease states |
| TF | Cell Type | Tissue | Disease Stage | Target Gene | RSS | Regulon Activity |
| HOXA5 | LYMEND | Breast | DCIS | ANKRD27,TUBB2B,AC106739.2, etc. | 1.36e-02 |  |
| ∗The dot plots of a searched regulon are shown for all cell subpopulations in each disease state of each tissue based on the regulon specific score inferred using pySCENIC and by calculating the average expression. |
| Page: 1 |
Top |
Somatic mutation of malignant transformation related genes |
| Annotation of somatic variants for genes involved in malignant transformation |
| Hugo Symbol | Variant Class | Variant Classification | dbSNP RS | HGVSc | HGVSp | HGVSp Short | SWISSPROT | BIOTYPE | SIFT | PolyPhen | Tumor Sample Barcode | Tissue | Histology | Sex | Age | Stage | Therapy Types | Drugs | Outcome |
| HOXA5 | SNV | Missense_Mutation | c.311N>T | p.Ser104Phe | p.S104F | P20719 | protein_coding | deleterious(0) | benign(0.282) | TCGA-AN-A049-01 | Breast | breast invasive carcinoma | Female | <65 | I/II | Unknown | Unknown | SD | |
| HOXA5 | SNV | Missense_Mutation | c.682N>G | p.Ile228Val | p.I228V | P20719 | protein_coding | deleterious(0) | possibly_damaging(0.759) | TCGA-E2-A14Z-01 | Breast | breast invasive carcinoma | Female | <65 | I/II | Hormone Therapy | arimidex | PD | |
| HOXA5 | SNV | Missense_Mutation | c.492N>A | p.Ser164Arg | p.S164R | P20719 | protein_coding | tolerated(0.37) | benign(0.093) | TCGA-E2-A15M-01 | Breast | breast invasive carcinoma | Female | >=65 | I/II | Hormone Therapy | arimidex | SD | |
| HOXA5 | deletion | Frame_Shift_Del | c.324delN | p.Ser109ArgfsTer14 | p.S109Rfs*14 | P20719 | protein_coding | TCGA-BH-A18G-01 | Breast | breast invasive carcinoma | Female | >=65 | I/II | Unknown | Unknown | SD | |||
| HOXA5 | insertion | Frame_Shift_Ins | novel | c.353_354insATTTA | p.Lys119PhefsTer6 | p.K119Ffs*6 | P20719 | protein_coding | TCGA-DS-A1OC-01 | Cervix | cervical & endocervical cancer | Female | <65 | I/II | Chemotherapy | gemcitabine | SD | ||
| HOXA5 | insertion | Frame_Shift_Ins | novel | c.352_353insTG | p.Gly118ValfsTer6 | p.G118Vfs*6 | P20719 | protein_coding | TCGA-DS-A1OC-01 | Cervix | cervical & endocervical cancer | Female | <65 | I/II | Chemotherapy | gemcitabine | SD | ||
| HOXA5 | SNV | Missense_Mutation | c.784N>T | p.Ala262Ser | p.A262S | P20719 | protein_coding | tolerated(0.05) | benign(0.223) | TCGA-AG-3901-01 | Colorectum | rectum adenocarcinoma | Female | >=65 | III/IV | Unknown | Unknown | SD | |
| HOXA5 | SNV | Missense_Mutation | rs774910615 | c.799N>A | p.Ala267Thr | p.A267T | P20719 | protein_coding | deleterious(0.01) | benign(0.143) | TCGA-AG-A00Y-01 | Colorectum | rectum adenocarcinoma | Male | >=65 | I/II | Unknown | Unknown | PD |
| HOXA5 | deletion | In_Frame_Del | c.634_636delAAG | p.Lys212del | p.K212del | P20719 | protein_coding | TCGA-AD-6889-01 | Colorectum | colon adenocarcinoma | Male | >=65 | I/II | Chemotherapy | xeloda | PD | |||
| HOXA5 | SNV | Missense_Mutation | novel | c.341G>T | p.Ser114Ile | p.S114I | P20719 | protein_coding | deleterious(0.02) | benign(0.169) | TCGA-A5-A0G1-01 | Endometrium | uterine corpus endometrioid carcinoma | Female | >=65 | I/II | Unknown | Unknown | SD |
| Page: 1 2 3 4 |
Top |
Related drugs of malignant transformation related genes |
| Identification of chemicals and drugs interact with genes involved in malignant transfromation |
| (DGIdb 4.0) |
| Entrez ID | Symbol | Category | Interaction Types | Drug Claim Name | Drug Name | PMIDs |
| Page: 1 |

Copyright 2023-Present -The University of Texas Health Science Center at Houston |