
|
|||||
|
 | |
| |
| |
| |
| |
| |
|
Gene: HIBCH |
Gene summary for HIBCH |
| Gene information | Species | Human | Gene symbol | HIBCH | Gene ID | 26275 |
| Gene name | 3-hydroxyisobutyryl-CoA hydrolase | |
| Gene Alias | HIBYLCOAH | |
| Cytomap | 2q32.2 | |
| Gene Type | protein-coding | GO ID | GO:0006082 | UniProtAcc | A0A140VJL0 |
Top |
Malignant transformation analysis |
| Identification of the aberrant gene expression in precancerous and cancerous lesions by comparing the gene expression of stem-like cells in diseased tissues with normal stem cells |
| Entrez ID | Symbol | Replicates | Species | Organ | Tissue | Adj P-value | Log2FC | Malignancy |
| 26275 | HIBCH | CA_HPV_1 | Human | Cervix | CC | 2.28e-06 | -1.59e-01 | 0.0264 |
| 26275 | HIBCH | CCI_2 | Human | Cervix | CC | 1.77e-07 | 8.44e-01 | 0.5249 |
| 26275 | HIBCH | CCI_3 | Human | Cervix | CC | 1.55e-09 | 7.53e-01 | 0.516 |
| 26275 | HIBCH | HTA11_3410_2000001011 | Human | Colorectum | AD | 3.77e-28 | -7.76e-01 | 0.0155 |
| 26275 | HIBCH | HTA11_2487_2000001011 | Human | Colorectum | SER | 4.59e-10 | -5.78e-01 | -0.1808 |
| 26275 | HIBCH | HTA11_2951_2000001011 | Human | Colorectum | AD | 9.53e-03 | -6.88e-01 | 0.0216 |
| 26275 | HIBCH | HTA11_1938_2000001011 | Human | Colorectum | AD | 2.79e-04 | -5.39e-01 | -0.0811 |
| 26275 | HIBCH | HTA11_3361_2000001011 | Human | Colorectum | AD | 1.49e-10 | -7.30e-01 | -0.1207 |
| 26275 | HIBCH | HTA11_696_2000001011 | Human | Colorectum | AD | 6.17e-15 | -5.02e-01 | -0.1464 |
| 26275 | HIBCH | HTA11_866_2000001011 | Human | Colorectum | AD | 2.57e-14 | -5.09e-01 | -0.1001 |
| 26275 | HIBCH | HTA11_1391_2000001011 | Human | Colorectum | AD | 1.30e-04 | -4.11e-01 | -0.059 |
| 26275 | HIBCH | HTA11_5212_2000001011 | Human | Colorectum | AD | 3.22e-05 | -7.40e-01 | -0.2061 |
| 26275 | HIBCH | HTA11_546_2000001011 | Human | Colorectum | AD | 3.05e-02 | -4.68e-01 | -0.0842 |
| 26275 | HIBCH | HTA11_7862_2000001011 | Human | Colorectum | AD | 2.91e-03 | -5.54e-01 | -0.0179 |
| 26275 | HIBCH | HTA11_866_3004761011 | Human | Colorectum | AD | 3.59e-22 | -7.10e-01 | 0.096 |
| 26275 | HIBCH | HTA11_9408_2000001011 | Human | Colorectum | AD | 1.06e-02 | -8.27e-01 | 0.0451 |
| 26275 | HIBCH | HTA11_8622_2000001021 | Human | Colorectum | SER | 5.37e-05 | -7.48e-01 | 0.0528 |
| 26275 | HIBCH | HTA11_10711_2000001011 | Human | Colorectum | AD | 5.90e-08 | -6.16e-01 | 0.0338 |
| 26275 | HIBCH | HTA11_7696_3000711011 | Human | Colorectum | AD | 5.76e-20 | -5.62e-01 | 0.0674 |
| 26275 | HIBCH | HTA11_6818_2000001011 | Human | Colorectum | AD | 2.71e-04 | -6.36e-01 | 0.0112 |
| Page: 1 2 3 4 5 6 7 8 9 10 |
| Tissue | Expression Dynamics | Abbreviation |
| Cervix |  | CC: Cervix cancer |
| HSIL_HPV: HPV-infected high-grade squamous intraepithelial lesions | ||
| N_HPV: HPV-infected normal cervix | ||
| Colorectum (GSE201348) |  | FAP: Familial adenomatous polyposis |
| CRC: Colorectal cancer | ||
| Colorectum (HTA11) |  | AD: Adenomas |
| SER: Sessile serrated lesions | ||
| MSI-H: Microsatellite-high colorectal cancer | ||
| MSS: Microsatellite stable colorectal cancer | ||
| Esophagus | 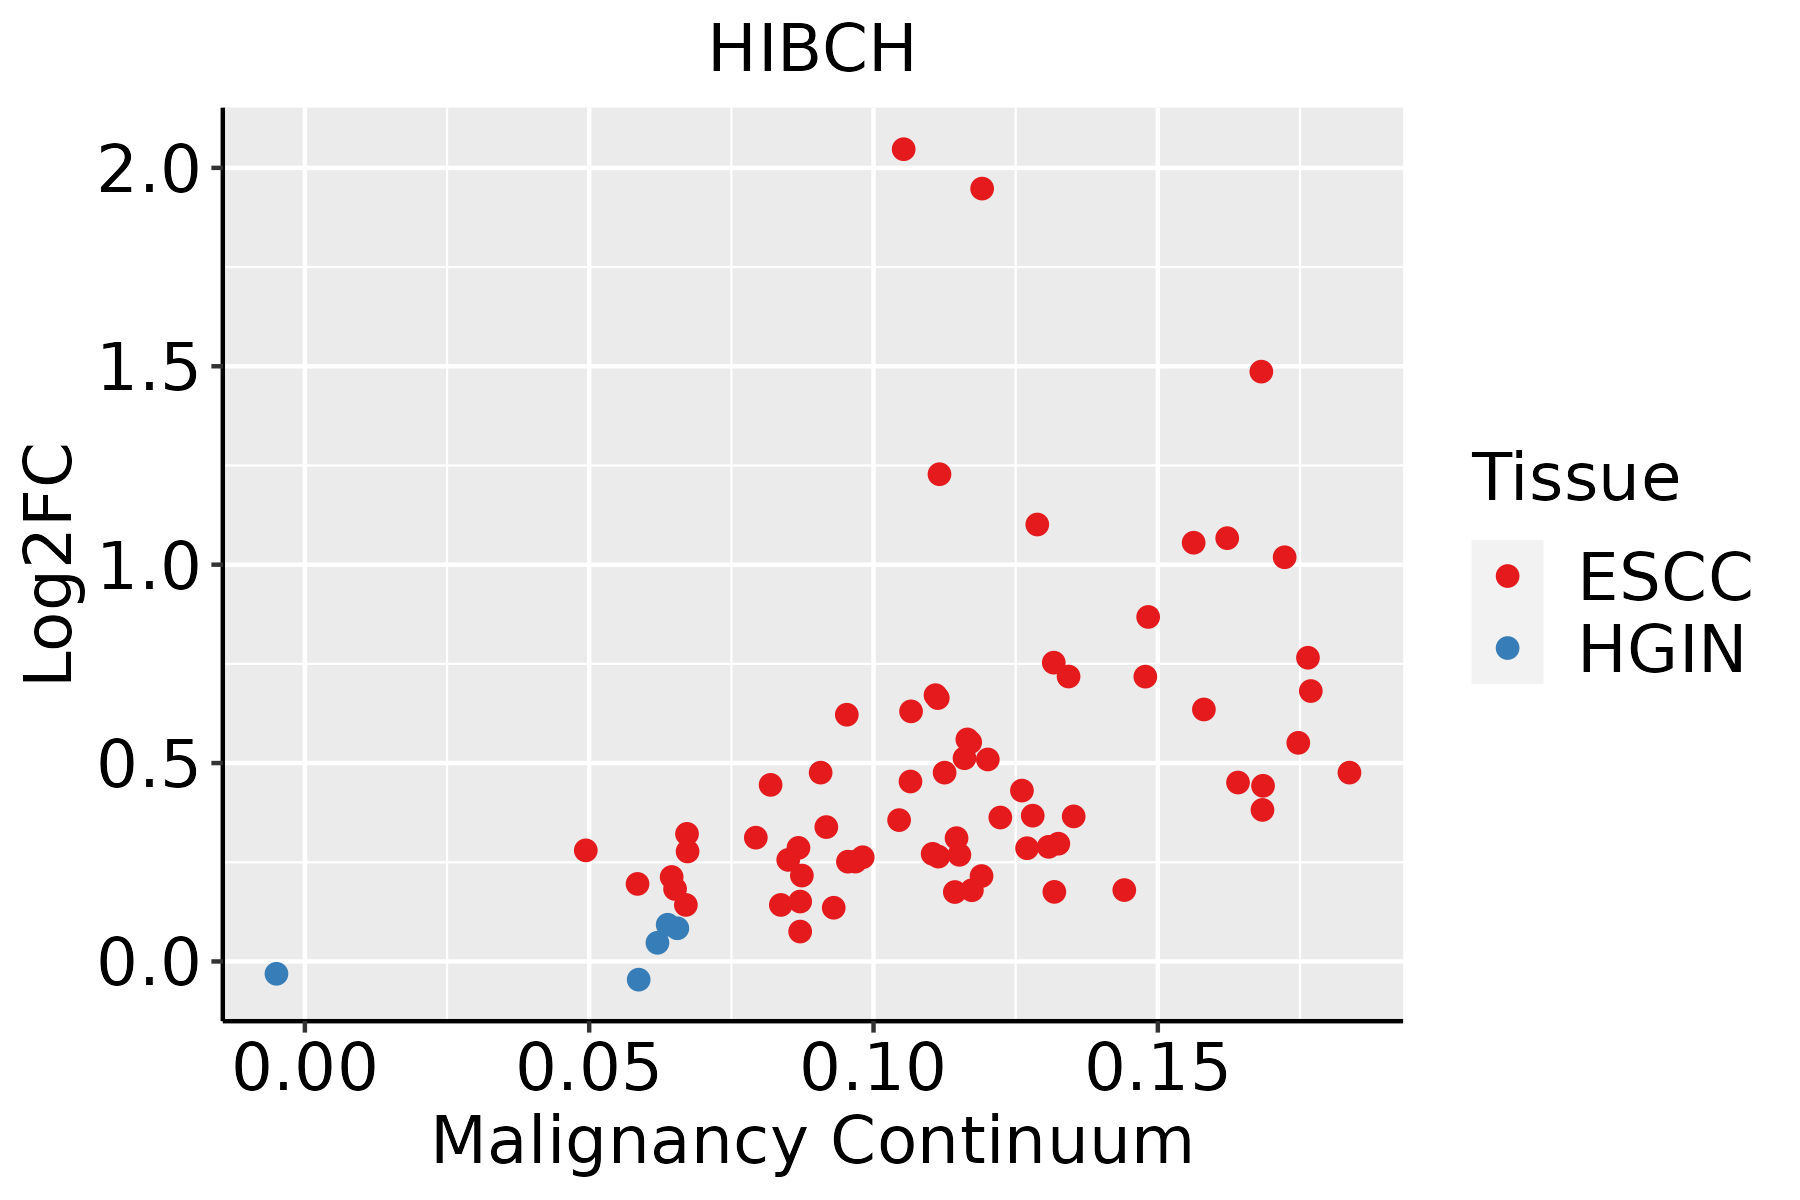 | ESCC: Esophageal squamous cell carcinoma |
| HGIN: High-grade intraepithelial neoplasias | ||
| LGIN: Low-grade intraepithelial neoplasias | ||
| Liver | 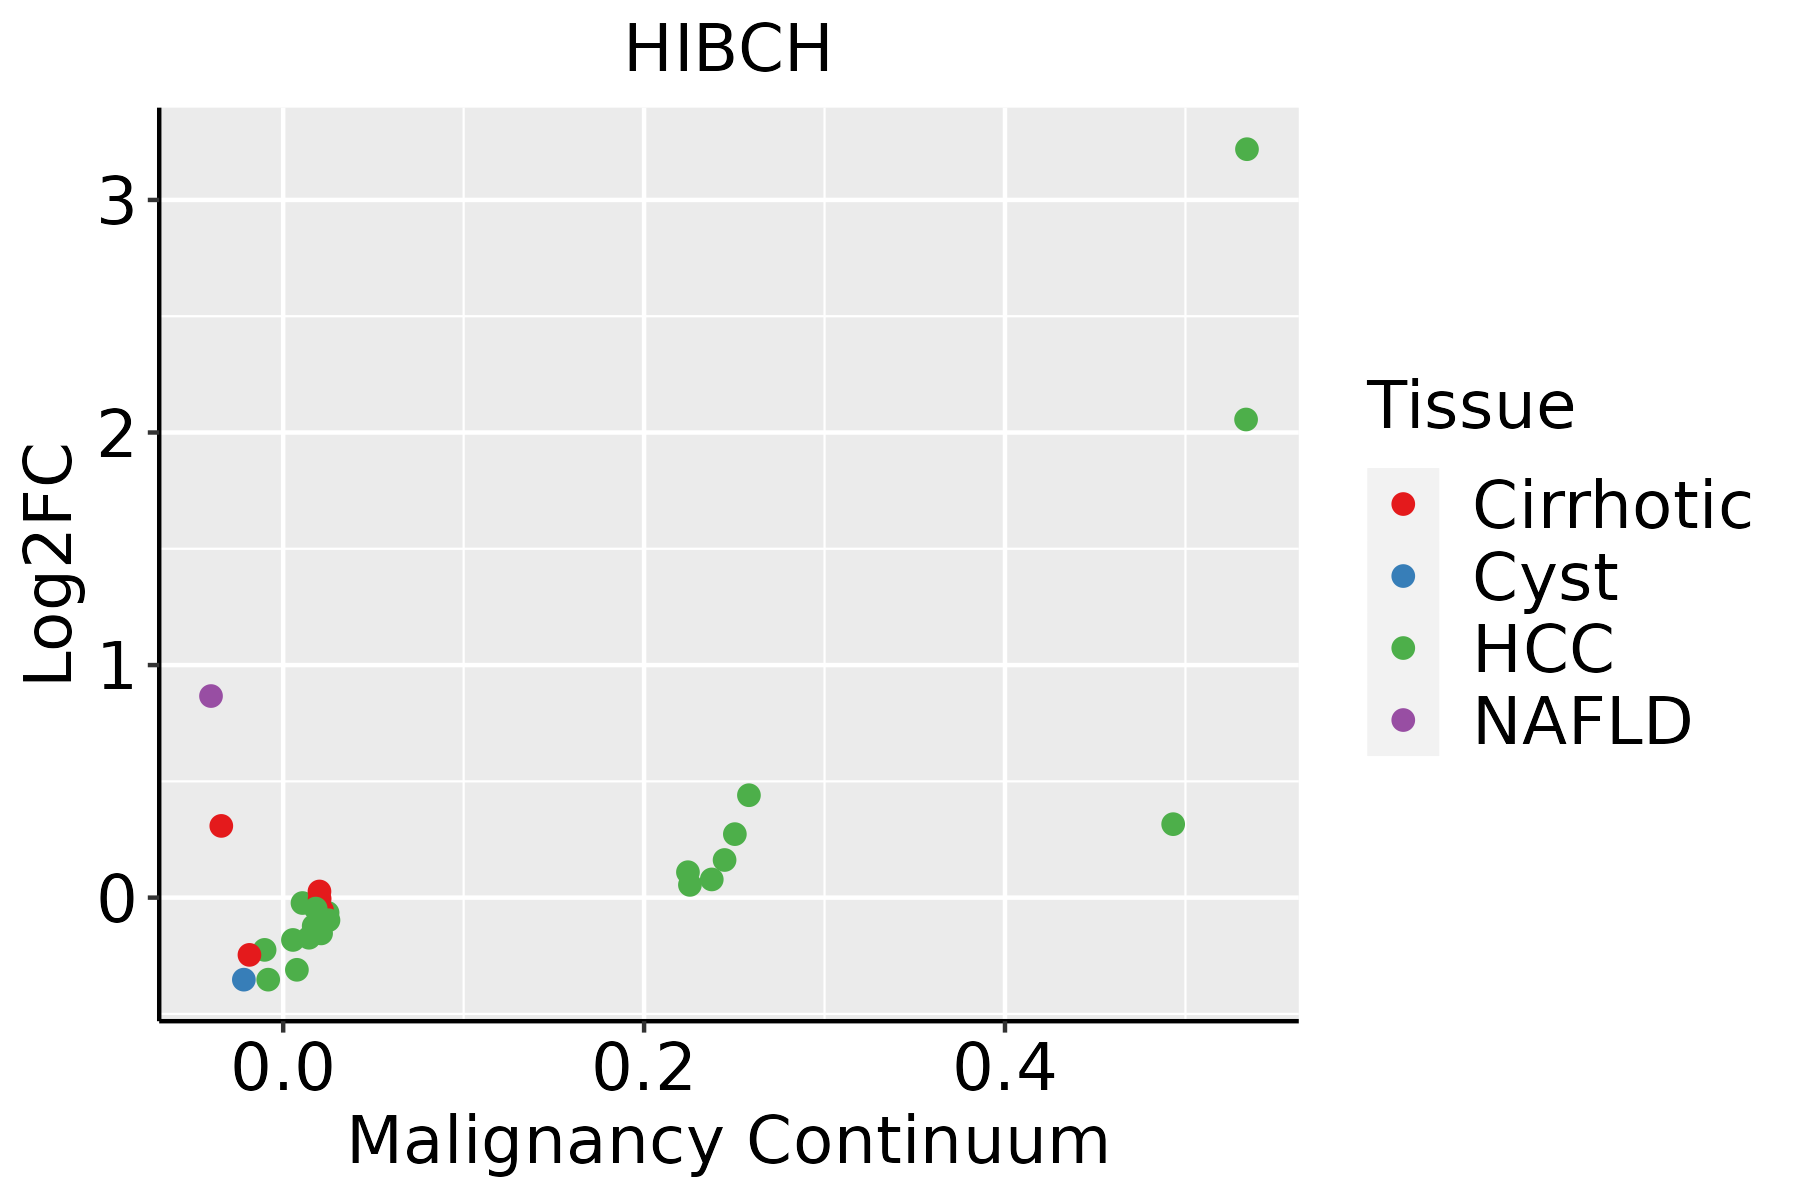 | HCC: Hepatocellular carcinoma |
| NAFLD: Non-alcoholic fatty liver disease | ||
| Oral Cavity | 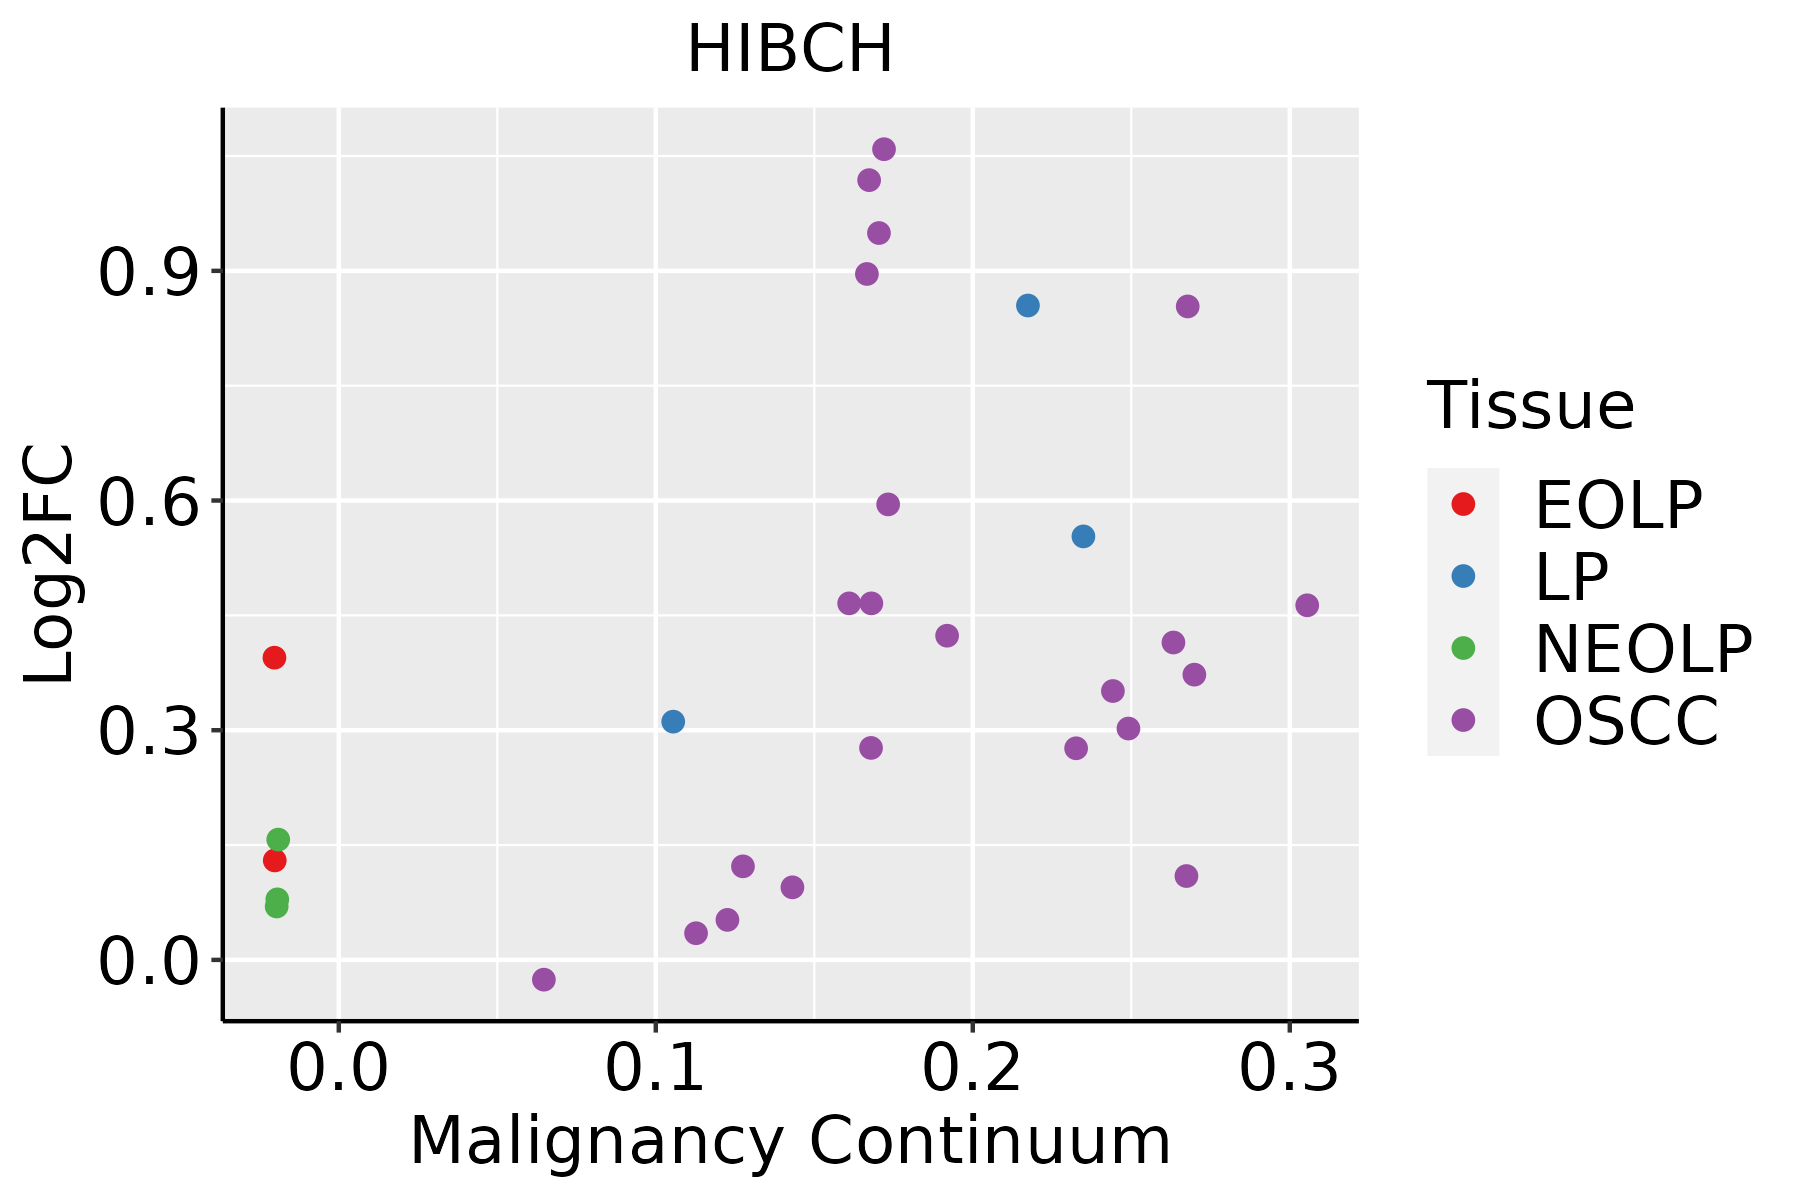 | EOLP: Erosive Oral lichen planus |
| LP: leukoplakia | ||
| NEOLP: Non-erosive oral lichen planus | ||
| OSCC: Oral squamous cell carcinoma | ||
| Prostate | 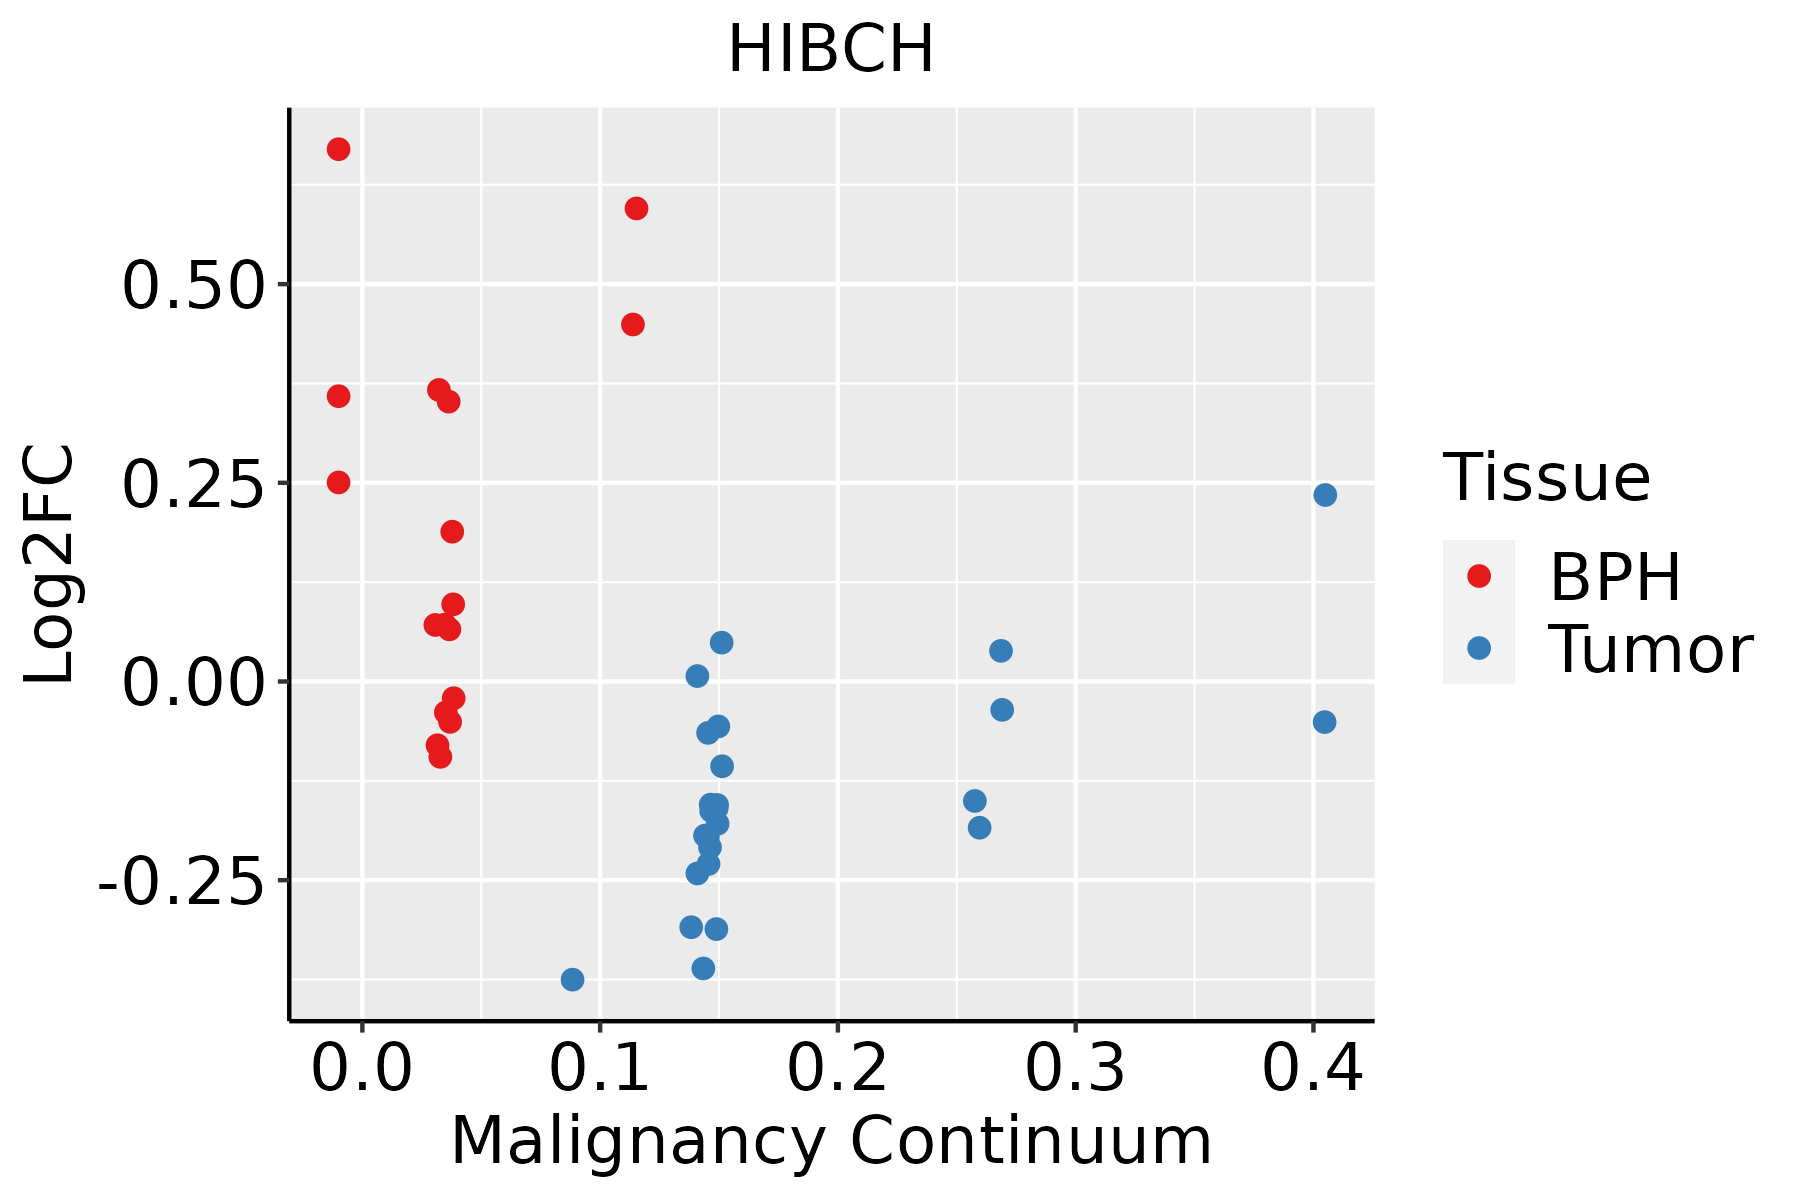 | BPH: Benign Prostatic Hyperplasia |
| Skin | 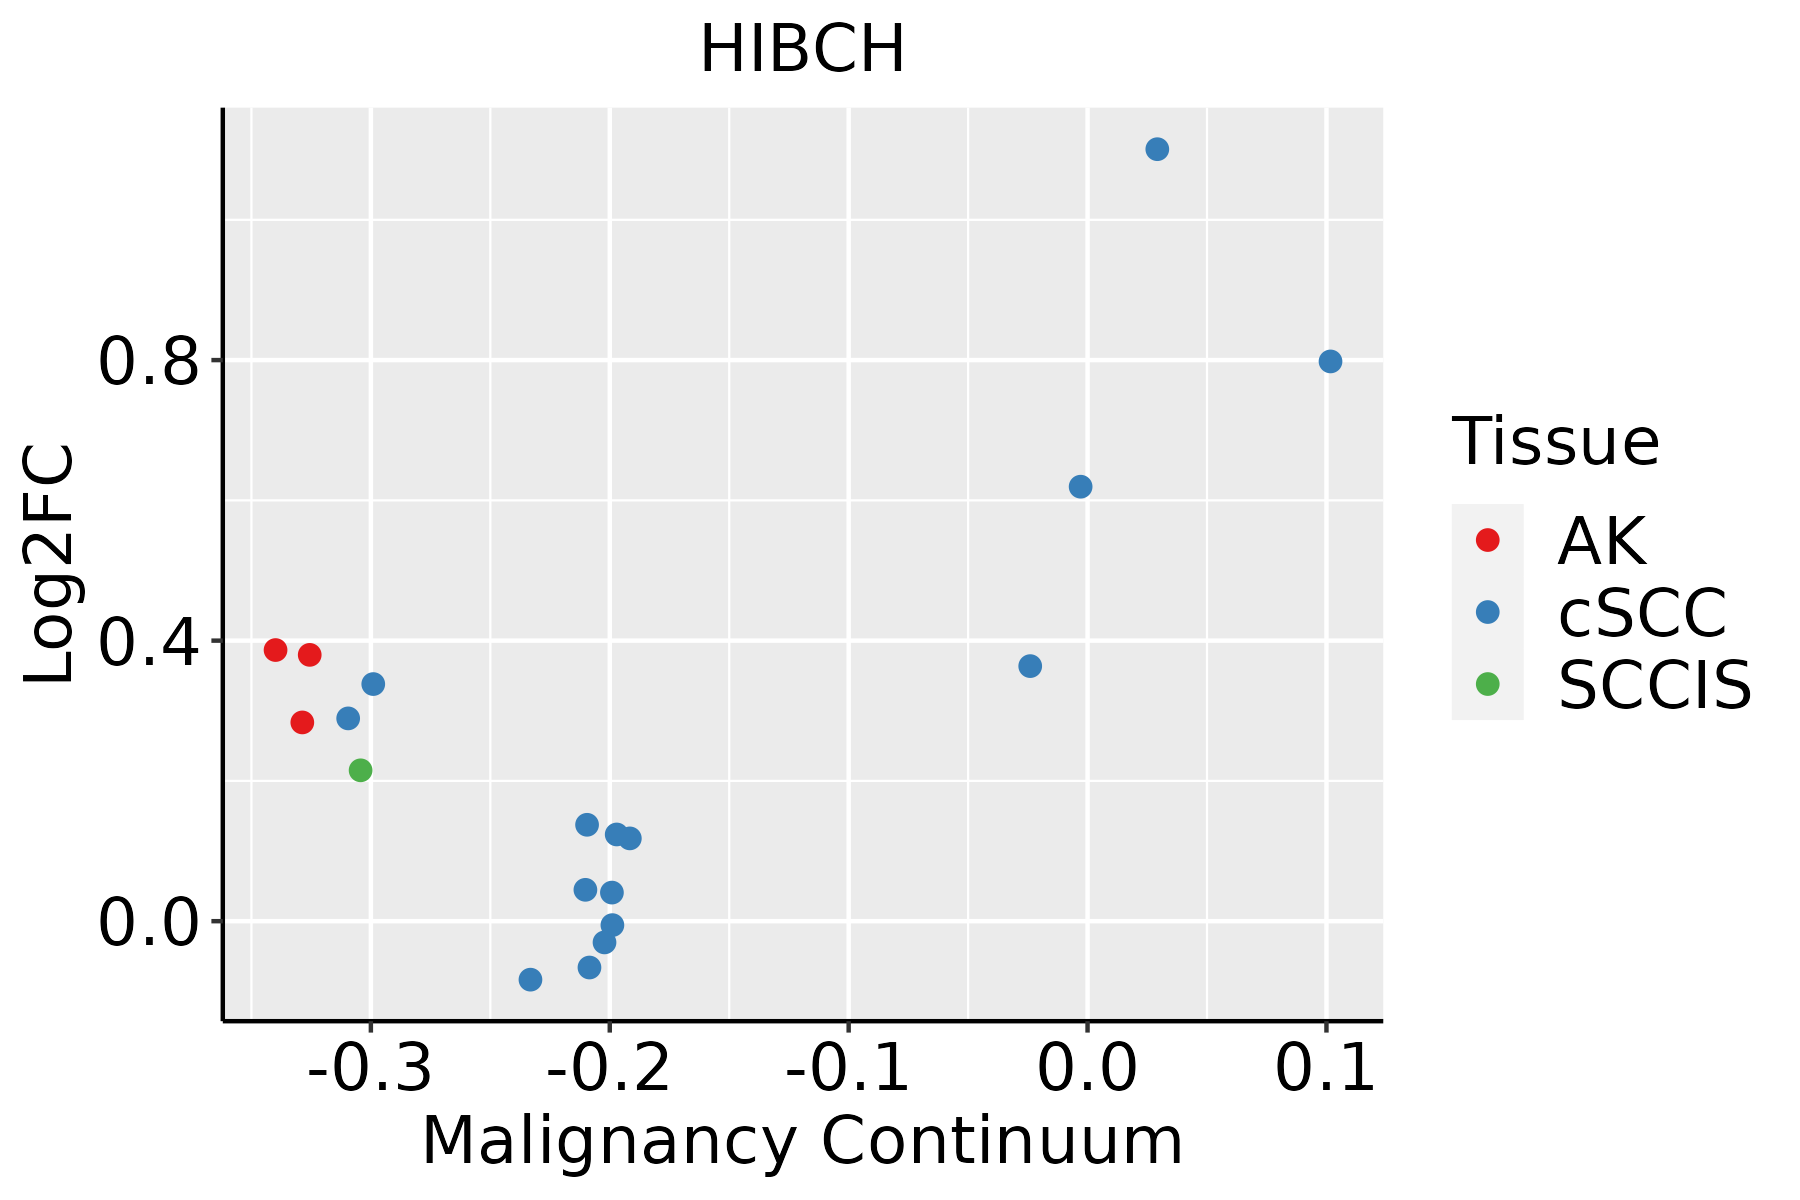 | AK: Actinic keratosis |
| cSCC: Cutaneous squamous cell carcinoma | ||
| SCCIS:squamous cell carcinoma in situ | ||
| Thyroid | 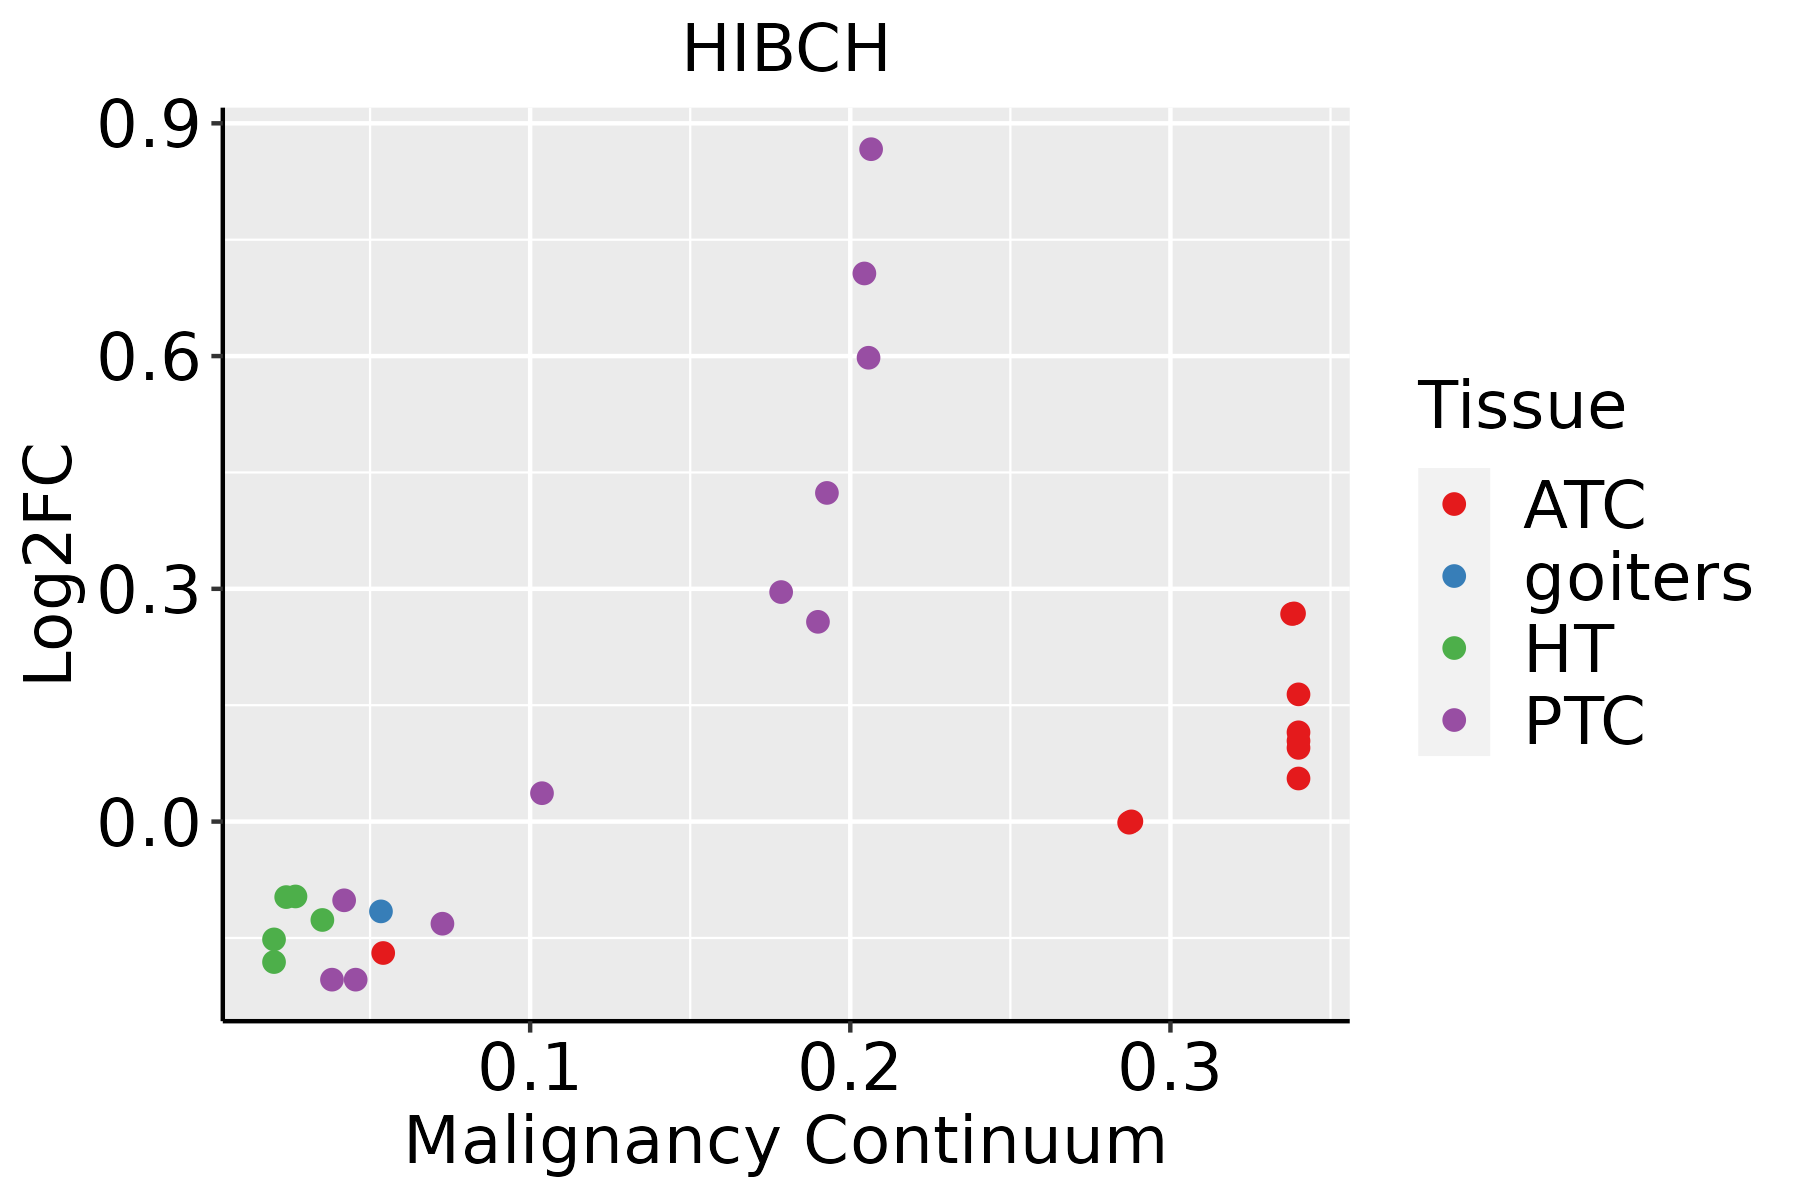 | ATC: Anaplastic thyroid cancer |
| HT: Hashimoto's thyroiditis | ||
| PTC: Papillary thyroid cancer |
| ∗log2FC in expression of this searched gene in stem-like cells from each diseased tissue sample relative to stem-like cells in normal samples in each tissue plotted against the malignancy continuum. Samples are colored based on if they are from different disease stage. |
Top |
Malignant transformation related pathway analysis |
| Find out the enriched GO biological processes and KEGG pathways involved in transition from healthy to precancer to cancer |
| Tissue | Disease Stage | Enriched GO biological Processes |
| Colorectum | AD |  |
| Colorectum | SER |  |
| Colorectum | MSS |  |
| Colorectum | MSI-H |  |
| Colorectum | FAP |  |
| ∗Top 15 enriched GO BP terms are showed in the bar plot of each disease state in each tissue. Each row represents a significant GO biological process which is colored according to the -log10(p.adjust). |
| Page: 1 2 3 4 5 6 7 8 9 |
| GO ID | Tissue | Disease Stage | Description | Gene Ratio | Bg Ratio | pvalue | p.adjust | Count |
| GO:00090815 | Esophagus | ESCC | branched-chain amino acid metabolic process | 14/8552 | 19/18723 | 1.27e-02 | 4.21e-02 | 14 |
| GO:00463953 | Liver | NAFLD | carboxylic acid catabolic process | 73/1882 | 236/18723 | 4.16e-19 | 1.22e-15 | 73 |
| GO:00160544 | Liver | NAFLD | organic acid catabolic process | 73/1882 | 240/18723 | 1.20e-18 | 2.34e-15 | 73 |
| GO:00442825 | Liver | NAFLD | small molecule catabolic process | 91/1882 | 376/18723 | 8.96e-16 | 1.31e-12 | 91 |
| GO:0009063 | Liver | NAFLD | cellular amino acid catabolic process | 36/1882 | 110/18723 | 6.56e-11 | 1.99e-08 | 36 |
| GO:00065203 | Liver | NAFLD | cellular amino acid metabolic process | 63/1882 | 284/18723 | 1.14e-09 | 2.17e-07 | 63 |
| GO:00090813 | Liver | NAFLD | branched-chain amino acid metabolic process | 8/1882 | 19/18723 | 2.81e-04 | 4.51e-03 | 8 |
| GO:00090834 | Liver | NAFLD | branched-chain amino acid catabolic process | 7/1882 | 15/18723 | 3.18e-04 | 4.95e-03 | 7 |
| GO:004428211 | Liver | Cirrhotic | small molecule catabolic process | 151/4634 | 376/18723 | 2.20e-11 | 1.34e-09 | 151 |
| GO:001605411 | Liver | Cirrhotic | organic acid catabolic process | 104/4634 | 240/18723 | 1.91e-10 | 9.53e-09 | 104 |
| GO:004639511 | Liver | Cirrhotic | carboxylic acid catabolic process | 102/4634 | 236/18723 | 3.41e-10 | 1.63e-08 | 102 |
| GO:00090631 | Liver | Cirrhotic | cellular amino acid catabolic process | 49/4634 | 110/18723 | 4.47e-06 | 7.42e-05 | 49 |
| GO:000652011 | Liver | Cirrhotic | cellular amino acid metabolic process | 103/4634 | 284/18723 | 8.88e-06 | 1.30e-04 | 103 |
| GO:000908111 | Liver | Cirrhotic | branched-chain amino acid metabolic process | 14/4634 | 19/18723 | 1.00e-05 | 1.45e-04 | 14 |
| GO:000908311 | Liver | Cirrhotic | branched-chain amino acid catabolic process | 11/4634 | 15/18723 | 1.04e-04 | 1.07e-03 | 11 |
| GO:004428221 | Liver | HCC | small molecule catabolic process | 225/7958 | 376/18723 | 6.50e-12 | 2.80e-10 | 225 |
| GO:001605421 | Liver | HCC | organic acid catabolic process | 152/7958 | 240/18723 | 5.11e-11 | 1.92e-09 | 152 |
| GO:00463952 | Liver | HCC | carboxylic acid catabolic process | 149/7958 | 236/18723 | 1.11e-10 | 3.87e-09 | 149 |
| GO:00065202 | Liver | HCC | cellular amino acid metabolic process | 167/7958 | 284/18723 | 1.91e-08 | 4.56e-07 | 167 |
| GO:00090632 | Liver | HCC | cellular amino acid catabolic process | 70/7958 | 110/18723 | 6.12e-06 | 7.52e-05 | 70 |
| Page: 1 2 3 |
| Pathway ID | Tissue | Disease Stage | Description | Gene Ratio | Bg Ratio | pvalue | p.adjust | qvalue | Count |
| hsa01200 | Colorectum | AD | Carbon metabolism | 55/2092 | 115/8465 | 5.53e-08 | 8.42e-07 | 5.37e-07 | 55 |
| hsa00280 | Colorectum | AD | Valine, leucine and isoleucine degradation | 25/2092 | 48/8465 | 3.97e-05 | 3.41e-04 | 2.18e-04 | 25 |
| hsa00640 | Colorectum | AD | Propanoate metabolism | 18/2092 | 32/8465 | 1.33e-04 | 1.11e-03 | 7.08e-04 | 18 |
| hsa012001 | Colorectum | AD | Carbon metabolism | 55/2092 | 115/8465 | 5.53e-08 | 8.42e-07 | 5.37e-07 | 55 |
| hsa002801 | Colorectum | AD | Valine, leucine and isoleucine degradation | 25/2092 | 48/8465 | 3.97e-05 | 3.41e-04 | 2.18e-04 | 25 |
| hsa006401 | Colorectum | AD | Propanoate metabolism | 18/2092 | 32/8465 | 1.33e-04 | 1.11e-03 | 7.08e-04 | 18 |
| hsa012002 | Colorectum | SER | Carbon metabolism | 40/1580 | 115/8465 | 2.77e-05 | 3.41e-04 | 2.47e-04 | 40 |
| hsa006402 | Colorectum | SER | Propanoate metabolism | 13/1580 | 32/8465 | 3.20e-03 | 2.12e-02 | 1.54e-02 | 13 |
| hsa012003 | Colorectum | SER | Carbon metabolism | 40/1580 | 115/8465 | 2.77e-05 | 3.41e-04 | 2.47e-04 | 40 |
| hsa006403 | Colorectum | SER | Propanoate metabolism | 13/1580 | 32/8465 | 3.20e-03 | 2.12e-02 | 1.54e-02 | 13 |
| hsa012004 | Colorectum | MSS | Carbon metabolism | 43/1875 | 115/8465 | 1.37e-04 | 1.17e-03 | 7.19e-04 | 43 |
| hsa002802 | Colorectum | MSS | Valine, leucine and isoleucine degradation | 21/1875 | 48/8465 | 6.73e-04 | 4.51e-03 | 2.76e-03 | 21 |
| hsa006404 | Colorectum | MSS | Propanoate metabolism | 15/1875 | 32/8465 | 1.68e-03 | 9.05e-03 | 5.55e-03 | 15 |
| hsa012005 | Colorectum | MSS | Carbon metabolism | 43/1875 | 115/8465 | 1.37e-04 | 1.17e-03 | 7.19e-04 | 43 |
| hsa002803 | Colorectum | MSS | Valine, leucine and isoleucine degradation | 21/1875 | 48/8465 | 6.73e-04 | 4.51e-03 | 2.76e-03 | 21 |
| hsa006405 | Colorectum | MSS | Propanoate metabolism | 15/1875 | 32/8465 | 1.68e-03 | 9.05e-03 | 5.55e-03 | 15 |
| hsa012006 | Colorectum | FAP | Carbon metabolism | 38/1404 | 115/8465 | 1.04e-05 | 1.44e-04 | 8.76e-05 | 38 |
| hsa006406 | Colorectum | FAP | Propanoate metabolism | 15/1404 | 32/8465 | 6.21e-05 | 6.10e-04 | 3.71e-04 | 15 |
| hsa002804 | Colorectum | FAP | Valine, leucine and isoleucine degradation | 18/1404 | 48/8465 | 3.94e-04 | 3.06e-03 | 1.86e-03 | 18 |
| hsa012007 | Colorectum | FAP | Carbon metabolism | 38/1404 | 115/8465 | 1.04e-05 | 1.44e-04 | 8.76e-05 | 38 |
| Page: 1 2 3 |
Top |
Cell-cell communication analysis |
| Identification of potential cell-cell interactions between two cell types and their ligand-receptor pairs for different disease states |
| Ligand | Receptor | LRpair | Pathway | Tissue | Disease Stage |
| Page: 1 |
Top |
Single-cell gene regulatory network inference analysis |
| Find out the significant the regulons (TFs) and the target genes of each regulon across cell types for different disease states |
| TF | Cell Type | Tissue | Disease Stage | Target Gene | RSS | Regulon Activity |
| ∗The dot plots of a searched regulon are shown for all cell subpopulations in each disease state of each tissue based on the regulon specific score inferred using pySCENIC and by calculating the average expression. |
| Page: 1 |
Top |
Somatic mutation of malignant transformation related genes |
| Annotation of somatic variants for genes involved in malignant transformation |
| Hugo Symbol | Variant Class | Variant Classification | dbSNP RS | HGVSc | HGVSp | HGVSp Short | SWISSPROT | BIOTYPE | SIFT | PolyPhen | Tumor Sample Barcode | Tissue | Histology | Sex | Age | Stage | Therapy Types | Drugs | Outcome |
| HIBCH | SNV | Missense_Mutation | c.541N>C | p.Gly181Arg | p.G181R | Q6NVY1 | protein_coding | deleterious(0) | probably_damaging(0.985) | TCGA-A2-A0T0-01 | Breast | breast invasive carcinoma | Female | <65 | I/II | Chemotherapy | taxotere | SD | |
| HIBCH | SNV | Missense_Mutation | c.1149N>G | p.Asp383Glu | p.D383E | Q6NVY1 | protein_coding | tolerated(0.19) | benign(0.014) | TCGA-B6-A0IB-01 | Breast | breast invasive carcinoma | Female | <65 | III/IV | Unknown | Unknown | PD | |
| HIBCH | SNV | Missense_Mutation | c.696G>C | p.Leu232Phe | p.L232F | Q6NVY1 | protein_coding | deleterious(0.03) | benign(0.093) | TCGA-EK-A3GK-01 | Cervix | cervical & endocervical cancer | Female | <65 | I/II | Unknown | Unknown | SD | |
| HIBCH | SNV | Missense_Mutation | rs367938014 | c.1036N>A | p.Val346Ile | p.V346I | Q6NVY1 | protein_coding | tolerated(0.08) | benign(0.081) | TCGA-CA-6718-01 | Colorectum | colon adenocarcinoma | Male | <65 | I/II | Unknown | Unknown | PD |
| HIBCH | SNV | Missense_Mutation | novel | c.260N>T | p.Lys87Met | p.K87M | Q6NVY1 | protein_coding | deleterious(0) | probably_damaging(0.967) | TCGA-SS-A7HO-01 | Colorectum | colon adenocarcinoma | Female | <65 | I/II | Chemotherapy | oxaliplatin | PD |
| HIBCH | SNV | Missense_Mutation | rs569593420 | c.991N>T | p.Arg331Trp | p.R331W | Q6NVY1 | protein_coding | deleterious(0) | probably_damaging(1) | TCGA-AG-3878-01 | Colorectum | rectum adenocarcinoma | Male | <65 | I/II | Unknown | Unknown | SD |
| HIBCH | SNV | Missense_Mutation | c.1133N>T | p.Ser378Phe | p.S378F | Q6NVY1 | protein_coding | deleterious(0.02) | benign(0.017) | TCGA-F5-6814-01 | Colorectum | rectum adenocarcinoma | Male | <65 | I/II | Unknown | Unknown | SD | |
| HIBCH | SNV | Missense_Mutation | novel | c.869N>A | p.Ser290Tyr | p.S290Y | Q6NVY1 | protein_coding | deleterious(0.01) | possibly_damaging(0.725) | TCGA-AJ-A3EL-01 | Endometrium | uterine corpus endometrioid carcinoma | Female | <65 | I/II | Unknown | Unknown | SD |
| HIBCH | SNV | Missense_Mutation | rs757976755 | c.196N>T | p.Arg66Trp | p.R66W | Q6NVY1 | protein_coding | deleterious(0) | possibly_damaging(0.778) | TCGA-AJ-A5DW-01 | Endometrium | uterine corpus endometrioid carcinoma | Female | <65 | I/II | Unknown | Unknown | SD |
| HIBCH | SNV | Missense_Mutation | c.287N>T | p.Ala96Val | p.A96V | Q6NVY1 | protein_coding | deleterious(0.01) | possibly_damaging(0.861) | TCGA-AP-A051-01 | Endometrium | uterine corpus endometrioid carcinoma | Female | >=65 | I/II | Unknown | Unknown | SD |
| Page: 1 2 3 4 |
Top |
Related drugs of malignant transformation related genes |
| Identification of chemicals and drugs interact with genes involved in malignant transfromation |
| (DGIdb 4.0) |
| Entrez ID | Symbol | Category | Interaction Types | Drug Claim Name | Drug Name | PMIDs |
| Page: 1 |

Copyright 2023-Present -The University of Texas Health Science Center at Houston |