
|
|||||
|
 | |
| |
| |
| |
| |
| |
|
Gene: GUCY1B1 |
Gene summary for GUCY1B1 |
| Gene information | Species | Human | Gene symbol | GUCY1B1 | Gene ID | 2983 |
| Gene name | guanylate cyclase 1 soluble subunit beta 1 | |
| Gene Alias | GC-S-beta-1 | |
| Cytomap | 4q32.1 | |
| Gene Type | protein-coding | GO ID | GO:0003008 | UniProtAcc | Q02153 |
Top |
Malignant transformation analysis |
| Identification of the aberrant gene expression in precancerous and cancerous lesions by comparing the gene expression of stem-like cells in diseased tissues with normal stem cells |
| Entrez ID | Symbol | Replicates | Species | Organ | Tissue | Adj P-value | Log2FC | Malignancy |
| 2983 | GUCY1B1 | S027 | Human | Liver | HCC | 2.14e-11 | 6.95e-01 | 0.2446 |
| 2983 | GUCY1B1 | S028 | Human | Liver | HCC | 1.99e-26 | 6.99e-01 | 0.2503 |
| 2983 | GUCY1B1 | S029 | Human | Liver | HCC | 1.87e-16 | 4.13e-01 | 0.2581 |
| 2983 | GUCY1B1 | male-WTA | Human | Thyroid | PTC | 2.43e-03 | 8.42e-02 | 0.1037 |
| 2983 | GUCY1B1 | PTC06 | Human | Thyroid | PTC | 1.97e-05 | 1.74e-01 | 0.2057 |
| 2983 | GUCY1B1 | ATC13 | Human | Thyroid | ATC | 2.82e-21 | 5.12e-01 | 0.34 |
| 2983 | GUCY1B1 | ATC5 | Human | Thyroid | ATC | 4.60e-30 | 5.89e-01 | 0.34 |
| Page: 1 |
| Tissue | Expression Dynamics | Abbreviation |
| Liver | 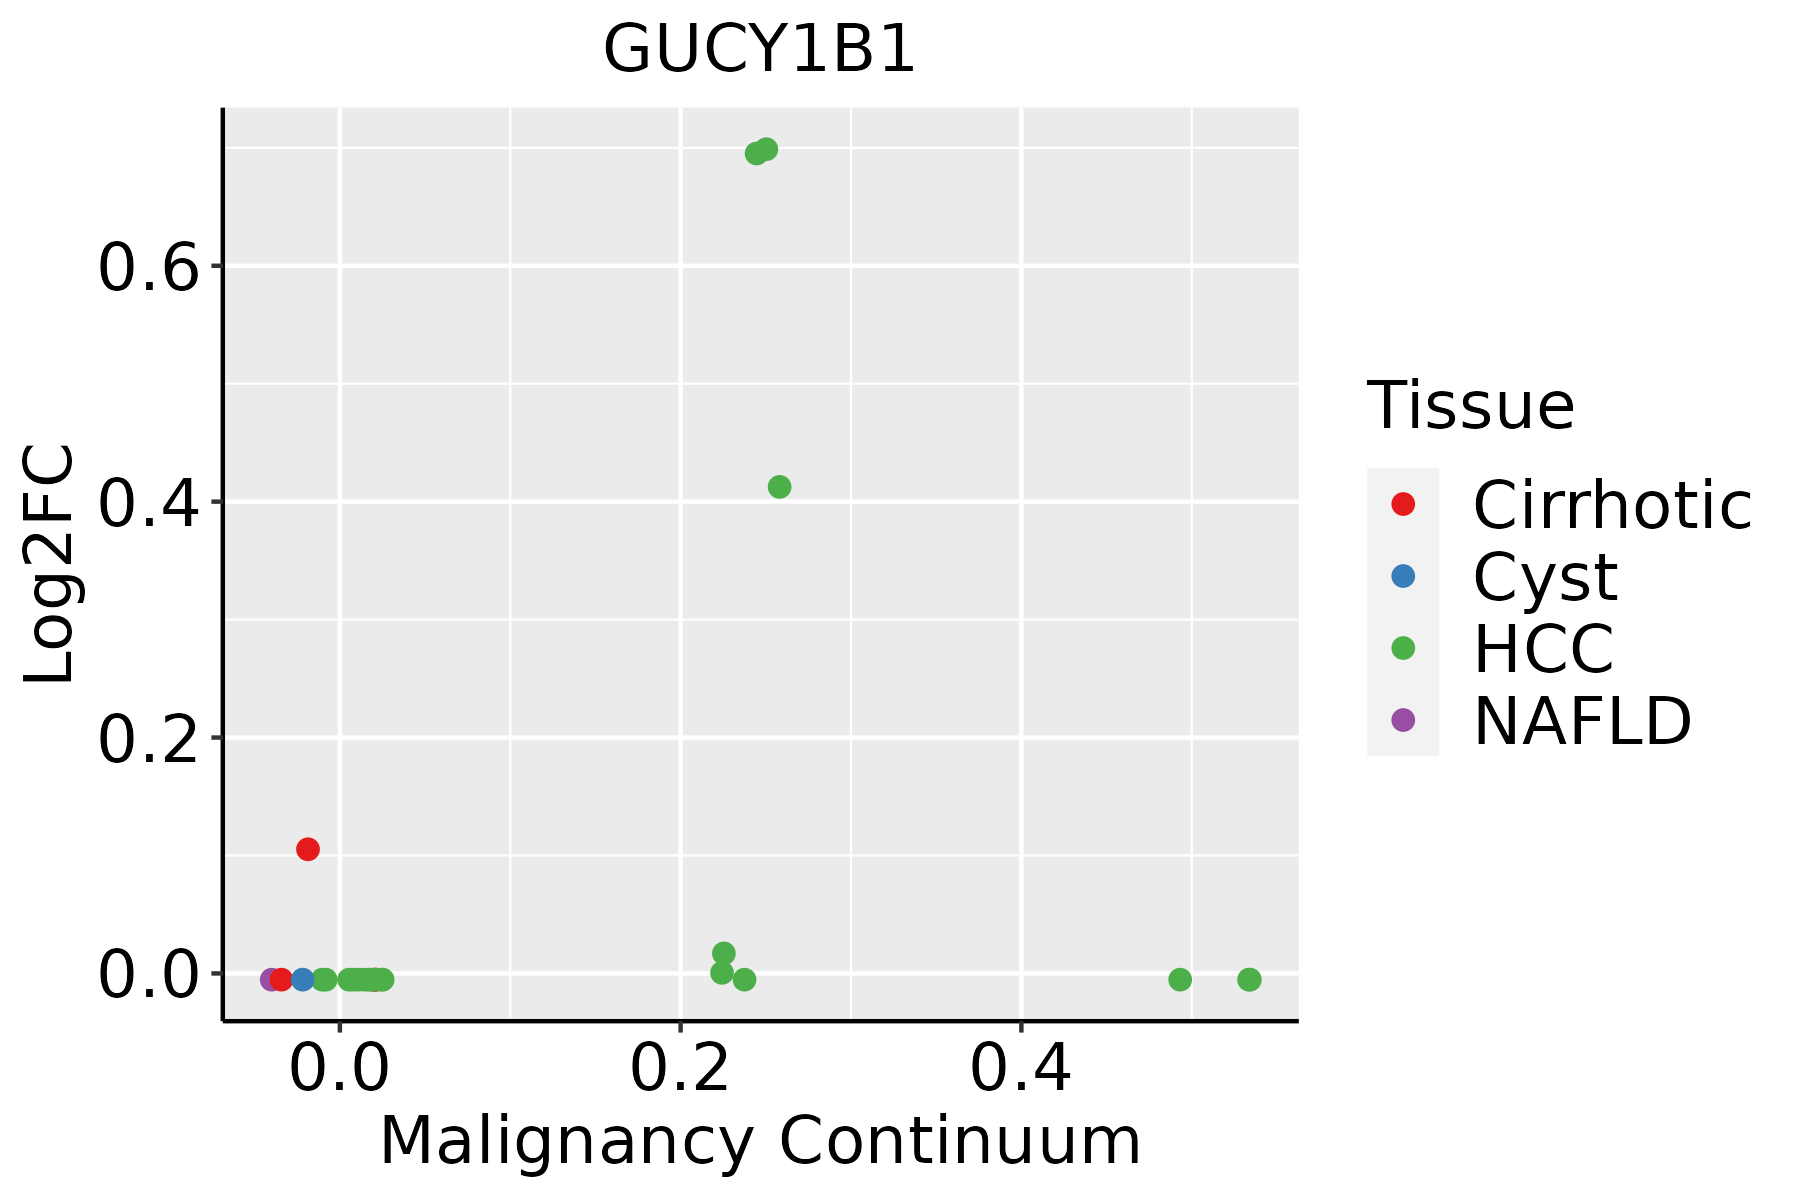 | HCC: Hepatocellular carcinoma |
| NAFLD: Non-alcoholic fatty liver disease | ||
| Thyroid |  | ATC: Anaplastic thyroid cancer |
| HT: Hashimoto's thyroiditis | ||
| PTC: Papillary thyroid cancer |
| ∗log2FC in expression of this searched gene in stem-like cells from each diseased tissue sample relative to stem-like cells in normal samples in each tissue plotted against the malignancy continuum. Samples are colored based on if they are from different disease stage. |
Top |
Malignant transformation related pathway analysis |
| Find out the enriched GO biological processes and KEGG pathways involved in transition from healthy to precancer to cancer |
| Tissue | Disease Stage | Enriched GO biological Processes |
| Colorectum | AD |  |
| Colorectum | SER |  |
| Colorectum | MSS |  |
| Colorectum | MSI-H |  |
| Colorectum | FAP |  |
| ∗Top 15 enriched GO BP terms are showed in the bar plot of each disease state in each tissue. Each row represents a significant GO biological process which is colored according to the -log10(p.adjust). |
| Page: 1 2 3 4 5 6 7 8 9 |
| GO ID | Tissue | Disease Stage | Description | Gene Ratio | Bg Ratio | pvalue | p.adjust | Count |
| GO:000616327 | Thyroid | PTC | purine nucleotide metabolic process | 170/5968 | 396/18723 | 2.02e-06 | 2.75e-05 | 170 |
| GO:000675325 | Thyroid | PTC | nucleoside phosphate metabolic process | 205/5968 | 497/18723 | 5.24e-06 | 6.35e-05 | 205 |
| GO:000911725 | Thyroid | PTC | nucleotide metabolic process | 202/5968 | 489/18723 | 5.46e-06 | 6.60e-05 | 202 |
| GO:000915224 | Thyroid | PTC | purine ribonucleotide biosynthetic process | 78/5968 | 169/18723 | 6.88e-05 | 6.01e-04 | 78 |
| GO:004639024 | Thyroid | PTC | ribose phosphate biosynthetic process | 85/5968 | 190/18723 | 1.30e-04 | 1.03e-03 | 85 |
| GO:000926024 | Thyroid | PTC | ribonucleotide biosynthetic process | 81/5968 | 182/18723 | 2.27e-04 | 1.65e-03 | 81 |
| GO:007252219 | Thyroid | PTC | purine-containing compound biosynthetic process | 86/5968 | 200/18723 | 5.85e-04 | 3.72e-03 | 86 |
| GO:000616419 | Thyroid | PTC | purine nucleotide biosynthetic process | 81/5968 | 191/18723 | 1.35e-03 | 7.65e-03 | 81 |
| GO:0071241110 | Thyroid | PTC | cellular response to inorganic substance | 92/5968 | 226/18723 | 3.01e-03 | 1.49e-02 | 92 |
| GO:001969328 | Thyroid | ATC | ribose phosphate metabolic process | 184/6293 | 396/18723 | 5.87e-08 | 1.05e-06 | 184 |
| GO:000915029 | Thyroid | ATC | purine ribonucleotide metabolic process | 172/6293 | 368/18723 | 9.58e-08 | 1.64e-06 | 172 |
| GO:000925928 | Thyroid | ATC | ribonucleotide metabolic process | 178/6293 | 385/18723 | 1.47e-07 | 2.39e-06 | 178 |
| GO:007252128 | Thyroid | ATC | purine-containing compound metabolic process | 189/6293 | 416/18723 | 2.83e-07 | 4.29e-06 | 189 |
| GO:0006753111 | Thyroid | ATC | nucleoside phosphate metabolic process | 219/6293 | 497/18723 | 5.92e-07 | 8.29e-06 | 219 |
| GO:0009117112 | Thyroid | ATC | nucleotide metabolic process | 215/6293 | 489/18723 | 9.09e-07 | 1.20e-05 | 215 |
| GO:000616328 | Thyroid | ATC | purine nucleotide metabolic process | 177/6293 | 396/18723 | 2.39e-06 | 2.82e-05 | 177 |
| GO:000915225 | Thyroid | ATC | purine ribonucleotide biosynthetic process | 84/6293 | 169/18723 | 1.05e-05 | 1.04e-04 | 84 |
| GO:004639025 | Thyroid | ATC | ribose phosphate biosynthetic process | 92/6293 | 190/18723 | 1.57e-05 | 1.46e-04 | 92 |
| GO:000926025 | Thyroid | ATC | ribonucleotide biosynthetic process | 88/6293 | 182/18723 | 2.55e-05 | 2.20e-04 | 88 |
| GO:007252223 | Thyroid | ATC | purine-containing compound biosynthetic process | 92/6293 | 200/18723 | 1.74e-04 | 1.18e-03 | 92 |
| Page: 1 2 3 |
| Pathway ID | Tissue | Disease Stage | Description | Gene Ratio | Bg Ratio | pvalue | p.adjust | qvalue | Count |
| Page: 1 |
Top |
Cell-cell communication analysis |
| Identification of potential cell-cell interactions between two cell types and their ligand-receptor pairs for different disease states |
| Ligand | Receptor | LRpair | Pathway | Tissue | Disease Stage |
| Page: 1 |
Top |
Single-cell gene regulatory network inference analysis |
| Find out the significant the regulons (TFs) and the target genes of each regulon across cell types for different disease states |
| TF | Cell Type | Tissue | Disease Stage | Target Gene | RSS | Regulon Activity |
| ∗The dot plots of a searched regulon are shown for all cell subpopulations in each disease state of each tissue based on the regulon specific score inferred using pySCENIC and by calculating the average expression. |
| Page: 1 |
Top |
Somatic mutation of malignant transformation related genes |
| Annotation of somatic variants for genes involved in malignant transformation |
| Hugo Symbol | Variant Class | Variant Classification | dbSNP RS | HGVSc | HGVSp | HGVSp Short | SWISSPROT | BIOTYPE | SIFT | PolyPhen | Tumor Sample Barcode | Tissue | Histology | Sex | Age | Stage | Therapy Types | Drugs | Outcome |
| Page: 1 |
Top |
Related drugs of malignant transformation related genes |
| Identification of chemicals and drugs interact with genes involved in malignant transfromation |
| (DGIdb 4.0) |
| Entrez ID | Symbol | Category | Interaction Types | Drug Claim Name | Drug Name | PMIDs |
| 2983 | GUCY1B1 | DRUGGABLE GENOME | positive modulator | CHEMBL2107834 | RIOCIGUAT | |
| 2983 | GUCY1B1 | DRUGGABLE GENOME | activator | CHEMBL136478 | SODIUM NITROPRUSSIDE | |
| 2983 | GUCY1B1 | DRUGGABLE GENOME | activator | CHEMBL1200689 | NITRIC OXIDE | |
| 2983 | GUCY1B1 | DRUGGABLE GENOME | RIOCIGUAT | RIOCIGUAT | ||
| 2983 | GUCY1B1 | DRUGGABLE GENOME | activator | CHEMBL6622 | ISOSORBIDE DINITRATE | |
| 2983 | GUCY1B1 | DRUGGABLE GENOME | Cinaciguat | CINACIGUAT | ||
| 2983 | GUCY1B1 | DRUGGABLE GENOME | activator | CHEMBL1311 | ISOSORBIDE MONONITRATE | |
| 2983 | GUCY1B1 | DRUGGABLE GENOME | Vericigiuat | |||
| 2983 | GUCY1B1 | DRUGGABLE GENOME | activator | CHEMBL730 | NITROGLYCERIN |
| Page: 1 |

Copyright 2023-Present -The University of Texas Health Science Center at Houston |