
|
|||||
|
 | |
| |
| |
| |
| |
| |
|
Gene: GTPBP1 |
Gene summary for GTPBP1 |
| Gene information | Species | Human | Gene symbol | GTPBP1 | Gene ID | 9567 |
| Gene name | GTP binding protein 1 | |
| Gene Alias | GP-1 | |
| Cytomap | 22q13.1 | |
| Gene Type | protein-coding | GO ID | GO:0002376 | UniProtAcc | O00178 |
Top |
Malignant transformation analysis |
| Identification of the aberrant gene expression in precancerous and cancerous lesions by comparing the gene expression of stem-like cells in diseased tissues with normal stem cells |
| Entrez ID | Symbol | Replicates | Species | Organ | Tissue | Adj P-value | Log2FC | Malignancy |
| 9567 | GTPBP1 | LZE7T | Human | Esophagus | ESCC | 1.90e-02 | 4.38e-02 | 0.0667 |
| 9567 | GTPBP1 | LZE20T | Human | Esophagus | ESCC | 2.43e-04 | 8.29e-02 | 0.0662 |
| 9567 | GTPBP1 | LZE21D1 | Human | Esophagus | HGIN | 8.81e-09 | 3.11e-01 | 0.0632 |
| 9567 | GTPBP1 | LZE24T | Human | Esophagus | ESCC | 5.90e-15 | 1.38e-01 | 0.0596 |
| 9567 | GTPBP1 | LZE21T | Human | Esophagus | ESCC | 1.39e-02 | 2.73e-01 | 0.0655 |
| 9567 | GTPBP1 | P1T-E | Human | Esophagus | ESCC | 1.14e-09 | 4.26e-01 | 0.0875 |
| 9567 | GTPBP1 | P2T-E | Human | Esophagus | ESCC | 1.10e-11 | 1.15e-01 | 0.1177 |
| 9567 | GTPBP1 | P4T-E | Human | Esophagus | ESCC | 4.00e-05 | 2.78e-01 | 0.1323 |
| 9567 | GTPBP1 | P5T-E | Human | Esophagus | ESCC | 9.33e-12 | 1.44e-01 | 0.1327 |
| 9567 | GTPBP1 | P8T-E | Human | Esophagus | ESCC | 1.34e-15 | 1.18e-01 | 0.0889 |
| 9567 | GTPBP1 | P9T-E | Human | Esophagus | ESCC | 9.90e-11 | 8.75e-02 | 0.1131 |
| 9567 | GTPBP1 | P10T-E | Human | Esophagus | ESCC | 1.09e-07 | 9.11e-02 | 0.116 |
| 9567 | GTPBP1 | P11T-E | Human | Esophagus | ESCC | 1.29e-11 | 3.13e-01 | 0.1426 |
| 9567 | GTPBP1 | P12T-E | Human | Esophagus | ESCC | 1.04e-08 | 1.31e-01 | 0.1122 |
| 9567 | GTPBP1 | P15T-E | Human | Esophagus | ESCC | 8.13e-12 | 1.65e-01 | 0.1149 |
| 9567 | GTPBP1 | P16T-E | Human | Esophagus | ESCC | 4.12e-10 | 1.02e-01 | 0.1153 |
| 9567 | GTPBP1 | P20T-E | Human | Esophagus | ESCC | 2.95e-09 | 8.17e-02 | 0.1124 |
| 9567 | GTPBP1 | P21T-E | Human | Esophagus | ESCC | 2.49e-11 | 1.80e-01 | 0.1617 |
| 9567 | GTPBP1 | P22T-E | Human | Esophagus | ESCC | 2.16e-07 | 2.32e-01 | 0.1236 |
| 9567 | GTPBP1 | P23T-E | Human | Esophagus | ESCC | 1.05e-15 | 2.99e-01 | 0.108 |
| Page: 1 2 3 4 |
| Tissue | Expression Dynamics | Abbreviation |
| Esophagus |  | ESCC: Esophageal squamous cell carcinoma |
| HGIN: High-grade intraepithelial neoplasias | ||
| LGIN: Low-grade intraepithelial neoplasias | ||
| Liver | 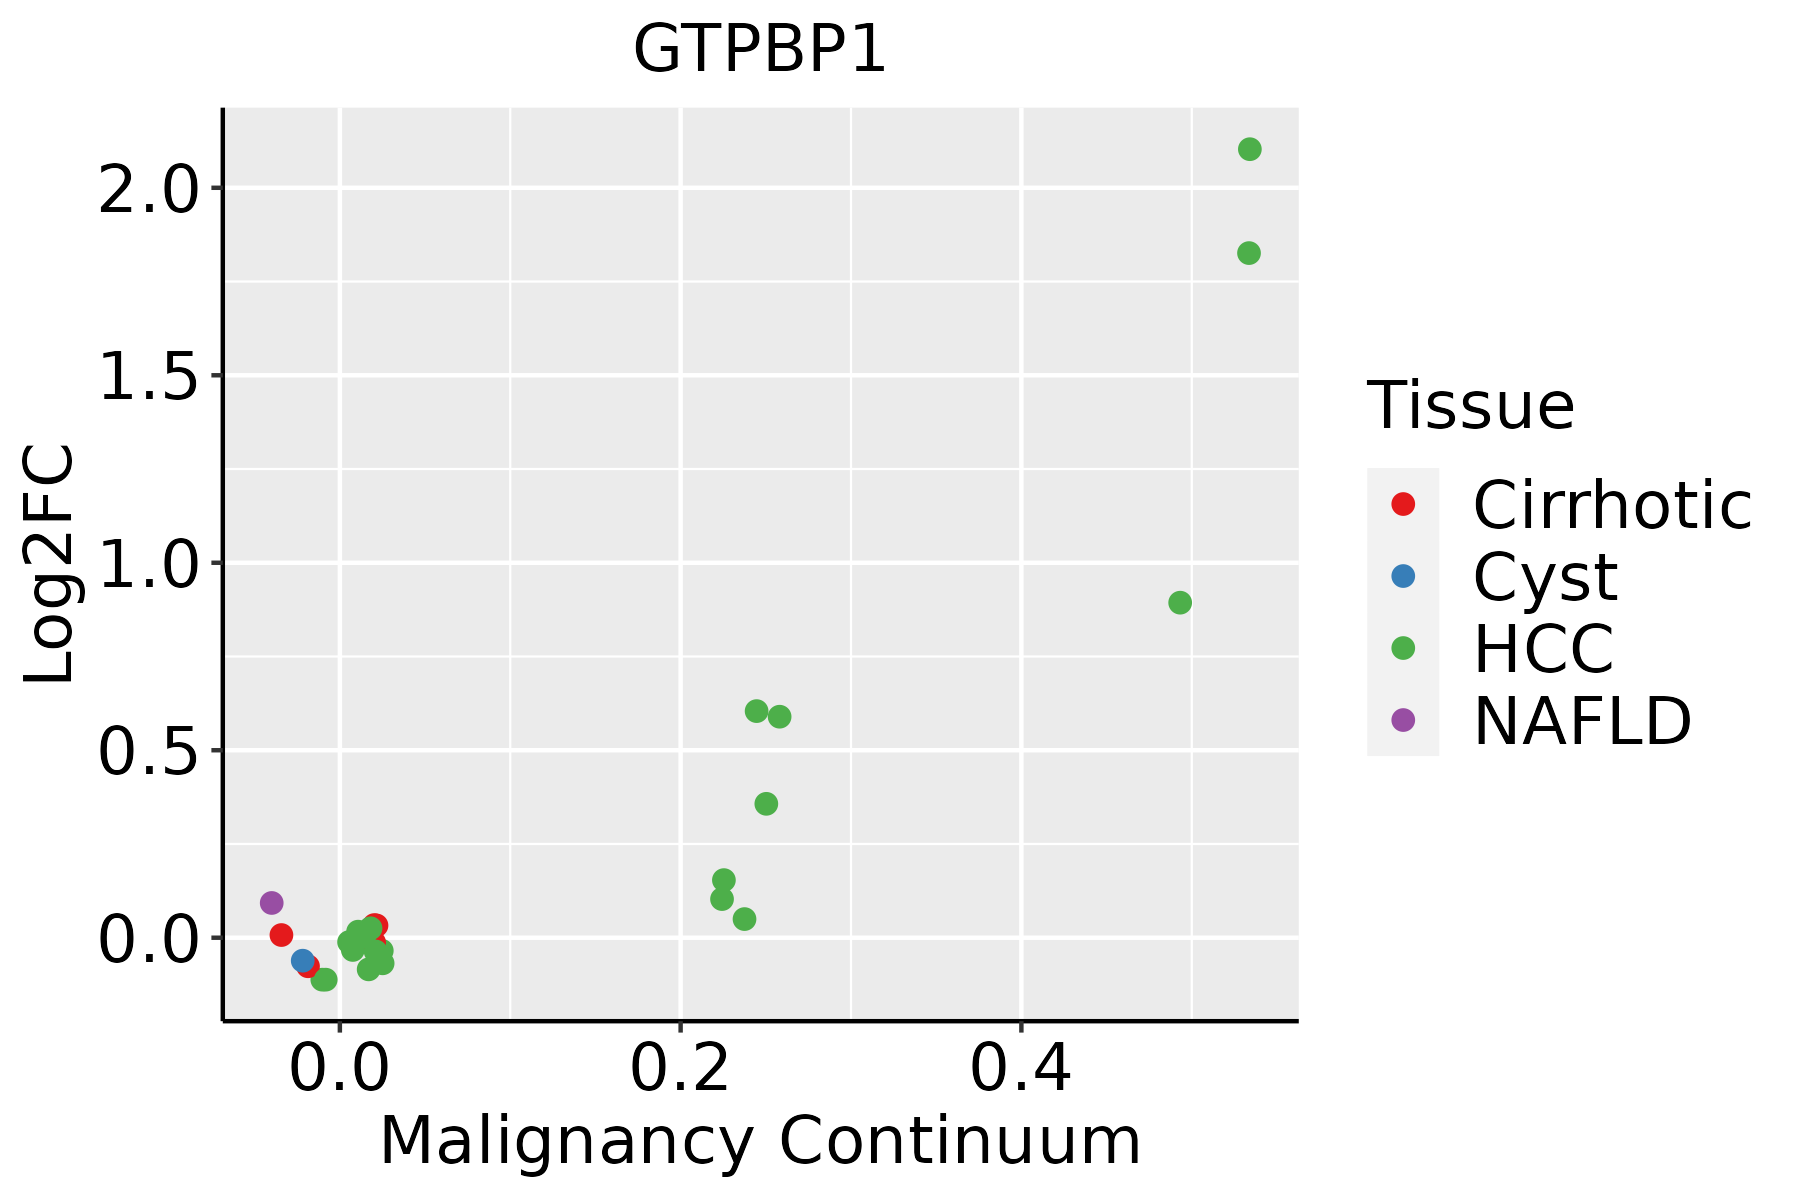 | HCC: Hepatocellular carcinoma |
| NAFLD: Non-alcoholic fatty liver disease | ||
| Oral Cavity |  | EOLP: Erosive Oral lichen planus |
| LP: leukoplakia | ||
| NEOLP: Non-erosive oral lichen planus | ||
| OSCC: Oral squamous cell carcinoma |
| ∗log2FC in expression of this searched gene in stem-like cells from each diseased tissue sample relative to stem-like cells in normal samples in each tissue plotted against the malignancy continuum. Samples are colored based on if they are from different disease stage. |
Top |
Malignant transformation related pathway analysis |
| Find out the enriched GO biological processes and KEGG pathways involved in transition from healthy to precancer to cancer |
| Tissue | Disease Stage | Enriched GO biological Processes |
| Colorectum | AD |  |
| Colorectum | SER |  |
| Colorectum | MSS |  |
| Colorectum | MSI-H |  |
| Colorectum | FAP |  |
| ∗Top 15 enriched GO BP terms are showed in the bar plot of each disease state in each tissue. Each row represents a significant GO biological process which is colored according to the -log10(p.adjust). |
| Page: 1 2 3 4 5 6 7 8 9 |
| GO ID | Tissue | Disease Stage | Description | Gene Ratio | Bg Ratio | pvalue | p.adjust | Count |
| GO:000915026 | Esophagus | HGIN | purine ribonucleotide metabolic process | 71/2587 | 368/18723 | 2.00e-03 | 2.11e-02 | 71 |
| GO:000616325 | Esophagus | HGIN | purine nucleotide metabolic process | 75/2587 | 396/18723 | 2.53e-03 | 2.51e-02 | 75 |
| GO:001969320 | Esophagus | HGIN | ribose phosphate metabolic process | 75/2587 | 396/18723 | 2.53e-03 | 2.51e-02 | 75 |
| GO:007252125 | Esophagus | HGIN | purine-containing compound metabolic process | 78/2587 | 416/18723 | 2.78e-03 | 2.73e-02 | 78 |
| GO:000925920 | Esophagus | HGIN | ribonucleotide metabolic process | 71/2587 | 385/18723 | 6.25e-03 | 4.97e-02 | 71 |
| GO:0022613111 | Esophagus | ESCC | ribonucleoprotein complex biogenesis | 365/8552 | 463/18723 | 1.74e-49 | 1.11e-45 | 365 |
| GO:0042254111 | Esophagus | ESCC | ribosome biogenesis | 252/8552 | 299/18723 | 3.27e-44 | 1.04e-40 | 252 |
| GO:0009896111 | Esophagus | ESCC | positive regulation of catabolic process | 332/8552 | 492/18723 | 4.36e-23 | 9.22e-21 | 332 |
| GO:0031331111 | Esophagus | ESCC | positive regulation of cellular catabolic process | 292/8552 | 427/18723 | 8.67e-22 | 1.53e-19 | 292 |
| GO:1903311110 | Esophagus | ESCC | regulation of mRNA metabolic process | 210/8552 | 288/18723 | 3.25e-21 | 5.56e-19 | 210 |
| GO:0006401110 | Esophagus | ESCC | RNA catabolic process | 204/8552 | 278/18723 | 3.39e-21 | 5.66e-19 | 204 |
| GO:0034655110 | Esophagus | ESCC | nucleobase-containing compound catabolic process | 272/8552 | 407/18723 | 2.92e-18 | 2.90e-16 | 272 |
| GO:0006402110 | Esophagus | ESCC | mRNA catabolic process | 170/8552 | 232/18723 | 8.70e-18 | 8.00e-16 | 170 |
| GO:004670018 | Esophagus | ESCC | heterocycle catabolic process | 286/8552 | 445/18723 | 1.12e-15 | 7.47e-14 | 286 |
| GO:004427019 | Esophagus | ESCC | cellular nitrogen compound catabolic process | 288/8552 | 451/18723 | 3.03e-15 | 1.79e-13 | 288 |
| GO:001943918 | Esophagus | ESCC | aromatic compound catabolic process | 295/8552 | 467/18723 | 1.09e-14 | 5.98e-13 | 295 |
| GO:190136118 | Esophagus | ESCC | organic cyclic compound catabolic process | 307/8552 | 495/18723 | 9.99e-14 | 4.80e-12 | 307 |
| GO:190331316 | Esophagus | ESCC | positive regulation of mRNA metabolic process | 87/8552 | 118/18723 | 5.10e-10 | 1.32e-08 | 87 |
| GO:006101319 | Esophagus | ESCC | regulation of mRNA catabolic process | 115/8552 | 166/18723 | 5.90e-10 | 1.49e-08 | 115 |
| GO:0006753110 | Esophagus | ESCC | nucleoside phosphate metabolic process | 288/8552 | 497/18723 | 1.80e-08 | 3.50e-07 | 288 |
| Page: 1 2 3 4 5 6 7 8 9 |
| Pathway ID | Tissue | Disease Stage | Description | Gene Ratio | Bg Ratio | pvalue | p.adjust | qvalue | Count |
| Page: 1 |
Top |
Cell-cell communication analysis |
| Identification of potential cell-cell interactions between two cell types and their ligand-receptor pairs for different disease states |
| Ligand | Receptor | LRpair | Pathway | Tissue | Disease Stage |
| Page: 1 |
Top |
Single-cell gene regulatory network inference analysis |
| Find out the significant the regulons (TFs) and the target genes of each regulon across cell types for different disease states |
| TF | Cell Type | Tissue | Disease Stage | Target Gene | RSS | Regulon Activity |
| ∗The dot plots of a searched regulon are shown for all cell subpopulations in each disease state of each tissue based on the regulon specific score inferred using pySCENIC and by calculating the average expression. |
| Page: 1 |
Top |
Somatic mutation of malignant transformation related genes |
| Annotation of somatic variants for genes involved in malignant transformation |
| Hugo Symbol | Variant Class | Variant Classification | dbSNP RS | HGVSc | HGVSp | HGVSp Short | SWISSPROT | BIOTYPE | SIFT | PolyPhen | Tumor Sample Barcode | Tissue | Histology | Sex | Age | Stage | Therapy Types | Drugs | Outcome |
| GTPBP1 | SNV | Missense_Mutation | c.801G>C | p.Met267Ile | p.M267I | O00178 | protein_coding | deleterious(0) | possibly_damaging(0.595) | TCGA-A7-A0DA-01 | Breast | breast invasive carcinoma | Female | <65 | I/II | Chemotherapy | adriamycin | SD | |
| GTPBP1 | insertion | Nonsense_Mutation | novel | c.1864_1865insTTGCCAAGGCTGGTCTCAAAACTCTTGGCTTGAAGTAAT | p.Ala622delinsValAlaLysAlaGlyLeuLysThrLeuGlyLeuLysTerSer | p.A622delinsVAKAGLKTLGLK*S | O00178 | protein_coding | TCGA-A2-A0CP-01 | Breast | breast invasive carcinoma | Female | <65 | I/II | Chemotherapy | cytoxan | SD | ||
| GTPBP1 | deletion | Frame_Shift_Del | novel | c.717_723delNNNNNNN | p.Ile240ArgfsTer19 | p.I240Rfs*19 | O00178 | protein_coding | TCGA-A2-A0CR-01 | Breast | breast invasive carcinoma | Female | <65 | I/II | Chemotherapy | adriamycin | CR | ||
| GTPBP1 | insertion | Frame_Shift_Ins | novel | c.764_765insGGGTTATGATGGTCGCTCCACCTCACTCATTCAC | p.His256GlyfsTer13 | p.H256Gfs*13 | O00178 | protein_coding | TCGA-A2-A0D1-01 | Breast | breast invasive carcinoma | Female | >=65 | I/II | Chemotherapy | taxotere | SD | ||
| GTPBP1 | SNV | Missense_Mutation | novel | c.1008N>T | p.Lys336Asn | p.K336N | O00178 | protein_coding | deleterious(0) | probably_damaging(1) | TCGA-2W-A8YY-01 | Cervix | cervical & endocervical cancer | Female | <65 | I/II | Chemotherapy | cisplatin | CR |
| GTPBP1 | SNV | Missense_Mutation | novel | c.1720N>A | p.Leu574Ile | p.L574I | O00178 | protein_coding | tolerated(0.43) | benign(0.014) | TCGA-2W-A8YY-01 | Cervix | cervical & endocervical cancer | Female | <65 | I/II | Chemotherapy | cisplatin | CR |
| GTPBP1 | SNV | Missense_Mutation | c.508N>A | p.Asp170Asn | p.D170N | O00178 | protein_coding | deleterious(0) | probably_damaging(1) | TCGA-C5-A7X3-01 | Cervix | cervical & endocervical cancer | Female | >=65 | III/IV | Chemotherapy | cisplatin | SD | |
| GTPBP1 | SNV | Missense_Mutation | rs774067054 | c.20N>A | p.Arg7His | p.R7H | O00178 | protein_coding | deleterious_low_confidence(0.01) | probably_damaging(0.964) | TCGA-LP-A7HU-01 | Cervix | cervical & endocervical cancer | Female | <65 | I/II | Unknown | Unknown | SD |
| GTPBP1 | SNV | Missense_Mutation | c.1925N>T | p.Pro642Leu | p.P642L | O00178 | protein_coding | tolerated_low_confidence(0.1) | benign(0.003) | TCGA-AA-3821-01 | Colorectum | colon adenocarcinoma | Female | >=65 | I/II | Unknown | Unknown | SD | |
| GTPBP1 | SNV | Missense_Mutation | rs763639124 | c.1628N>A | p.Arg543His | p.R543H | O00178 | protein_coding | deleterious(0) | probably_damaging(0.998) | TCGA-AA-A00N-01 | Colorectum | colon adenocarcinoma | Male | >=65 | I/II | Unknown | Unknown | PD |
| Page: 1 2 3 4 5 6 7 |
Top |
Related drugs of malignant transformation related genes |
| Identification of chemicals and drugs interact with genes involved in malignant transfromation |
| (DGIdb 4.0) |
| Entrez ID | Symbol | Category | Interaction Types | Drug Claim Name | Drug Name | PMIDs |
| Page: 1 |

Copyright 2023-Present -The University of Texas Health Science Center at Houston |