
|
|||||
|
 | |
| |
| |
| |
| |
| |
|
Gene: GTF3A |
Gene summary for GTF3A |
| Gene information | Species | Human | Gene symbol | GTF3A | Gene ID | 2971 |
| Gene name | general transcription factor IIIA | |
| Gene Alias | AP2 | |
| Cytomap | 13q12.2 | |
| Gene Type | protein-coding | GO ID | GO:0006139 | UniProtAcc | Q92664 |
Top |
Malignant transformation analysis |
| Identification of the aberrant gene expression in precancerous and cancerous lesions by comparing the gene expression of stem-like cells in diseased tissues with normal stem cells |
| Entrez ID | Symbol | Replicates | Species | Organ | Tissue | Adj P-value | Log2FC | Malignancy |
| 2971 | GTF3A | CA_HPV_1 | Human | Cervix | CC | 5.54e-03 | -4.39e-02 | 0.0264 |
| 2971 | GTF3A | N_HPV_2 | Human | Cervix | N_HPV | 2.18e-03 | -1.04e-02 | -0.0131 |
| 2971 | GTF3A | CCI_1 | Human | Cervix | CC | 1.79e-04 | -5.03e-01 | 0.528 |
| 2971 | GTF3A | CCI_3 | Human | Cervix | CC | 8.84e-03 | -4.13e-01 | 0.516 |
| 2971 | GTF3A | CCII_1 | Human | Cervix | CC | 9.95e-12 | -5.41e-01 | 0.3249 |
| 2971 | GTF3A | Tumor | Human | Cervix | CC | 2.37e-02 | -2.87e-01 | 0.1241 |
| 2971 | GTF3A | sample3 | Human | Cervix | CC | 3.61e-07 | -3.26e-01 | 0.1387 |
| 2971 | GTF3A | L1 | Human | Cervix | CC | 1.83e-02 | -1.37e-01 | 0.0802 |
| 2971 | GTF3A | T3 | Human | Cervix | CC | 3.57e-10 | -3.75e-01 | 0.1389 |
| 2971 | GTF3A | HTA11_78_2000001011 | Human | Colorectum | AD | 3.56e-02 | 3.20e-01 | -0.1088 |
| 2971 | GTF3A | HTA11_7696_3000711011 | Human | Colorectum | AD | 3.37e-03 | 1.97e-01 | 0.0674 |
| 2971 | GTF3A | HTA11_99999970781_79442 | Human | Colorectum | MSS | 2.02e-04 | 2.68e-01 | 0.294 |
| 2971 | GTF3A | HTA11_99999965104_69814 | Human | Colorectum | MSS | 5.72e-24 | 9.72e-01 | 0.281 |
| 2971 | GTF3A | HTA11_99999971662_82457 | Human | Colorectum | MSS | 2.15e-55 | 1.34e+00 | 0.3859 |
| 2971 | GTF3A | HTA11_99999973899_84307 | Human | Colorectum | MSS | 8.61e-14 | 8.64e-01 | 0.2585 |
| 2971 | GTF3A | HTA11_99999974143_84620 | Human | Colorectum | MSS | 9.07e-04 | 2.73e-01 | 0.3005 |
| 2971 | GTF3A | CRC-1-8810 | Human | Colorectum | CRC | 1.37e-19 | 6.01e-01 | 0.6257 |
| 2971 | GTF3A | AEH-subject1 | Human | Endometrium | AEH | 7.20e-16 | -3.60e-01 | -0.3059 |
| 2971 | GTF3A | AEH-subject2 | Human | Endometrium | AEH | 3.10e-08 | -3.34e-01 | -0.2525 |
| 2971 | GTF3A | AEH-subject3 | Human | Endometrium | AEH | 8.78e-09 | -2.35e-01 | -0.2576 |
| Page: 1 2 3 4 5 6 7 8 9 |
| Tissue | Expression Dynamics | Abbreviation |
| Cervix | 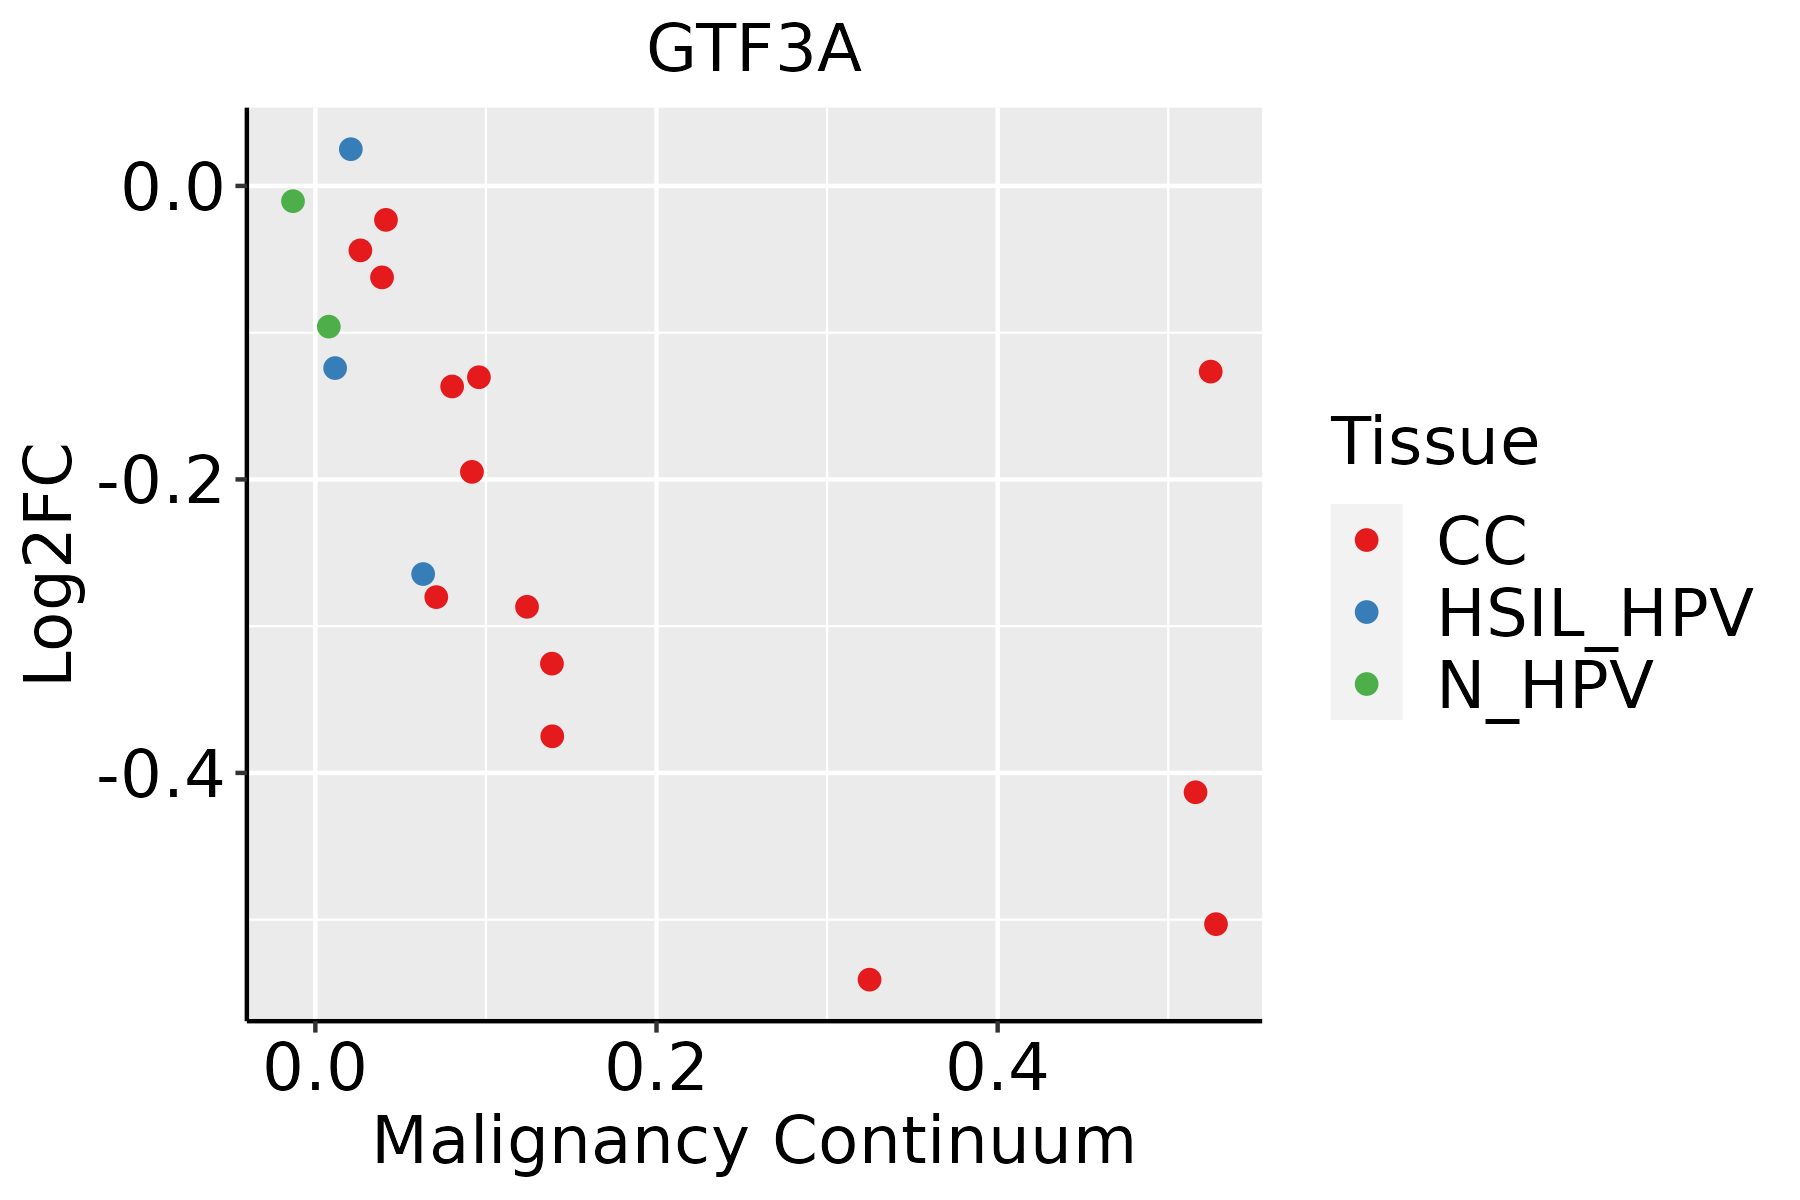 | CC: Cervix cancer |
| HSIL_HPV: HPV-infected high-grade squamous intraepithelial lesions | ||
| N_HPV: HPV-infected normal cervix | ||
| Colorectum (GSE201348) |  | FAP: Familial adenomatous polyposis |
| CRC: Colorectal cancer | ||
| Colorectum (HTA11) |  | AD: Adenomas |
| SER: Sessile serrated lesions | ||
| MSI-H: Microsatellite-high colorectal cancer | ||
| MSS: Microsatellite stable colorectal cancer | ||
| Endometrium |  | AEH: Atypical endometrial hyperplasia |
| EEC: Endometrioid Cancer | ||
| Esophagus |  | ESCC: Esophageal squamous cell carcinoma |
| HGIN: High-grade intraepithelial neoplasias | ||
| LGIN: Low-grade intraepithelial neoplasias | ||
| Liver |  | HCC: Hepatocellular carcinoma |
| NAFLD: Non-alcoholic fatty liver disease | ||
| Oral Cavity |  | EOLP: Erosive Oral lichen planus |
| LP: leukoplakia | ||
| NEOLP: Non-erosive oral lichen planus | ||
| OSCC: Oral squamous cell carcinoma | ||
| Prostate | 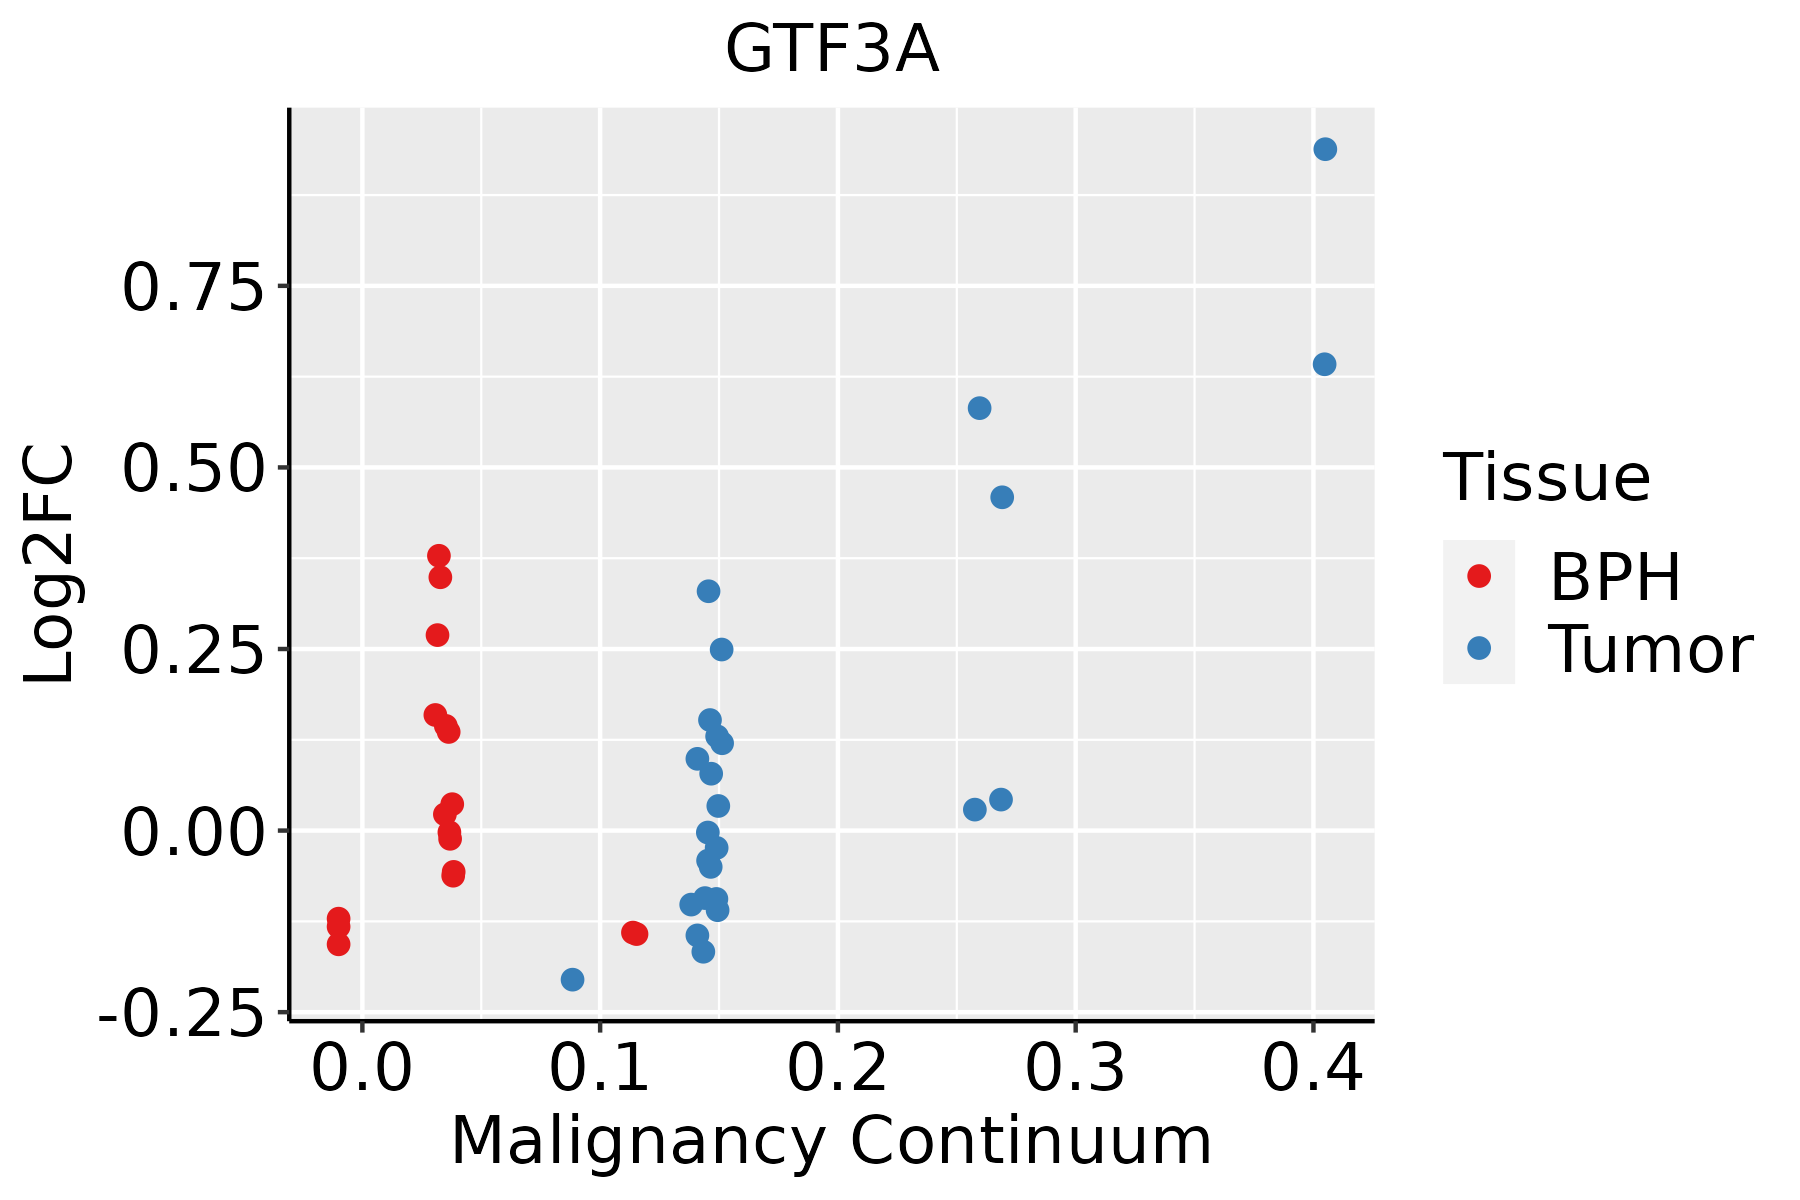 | BPH: Benign Prostatic Hyperplasia |
| Skin | 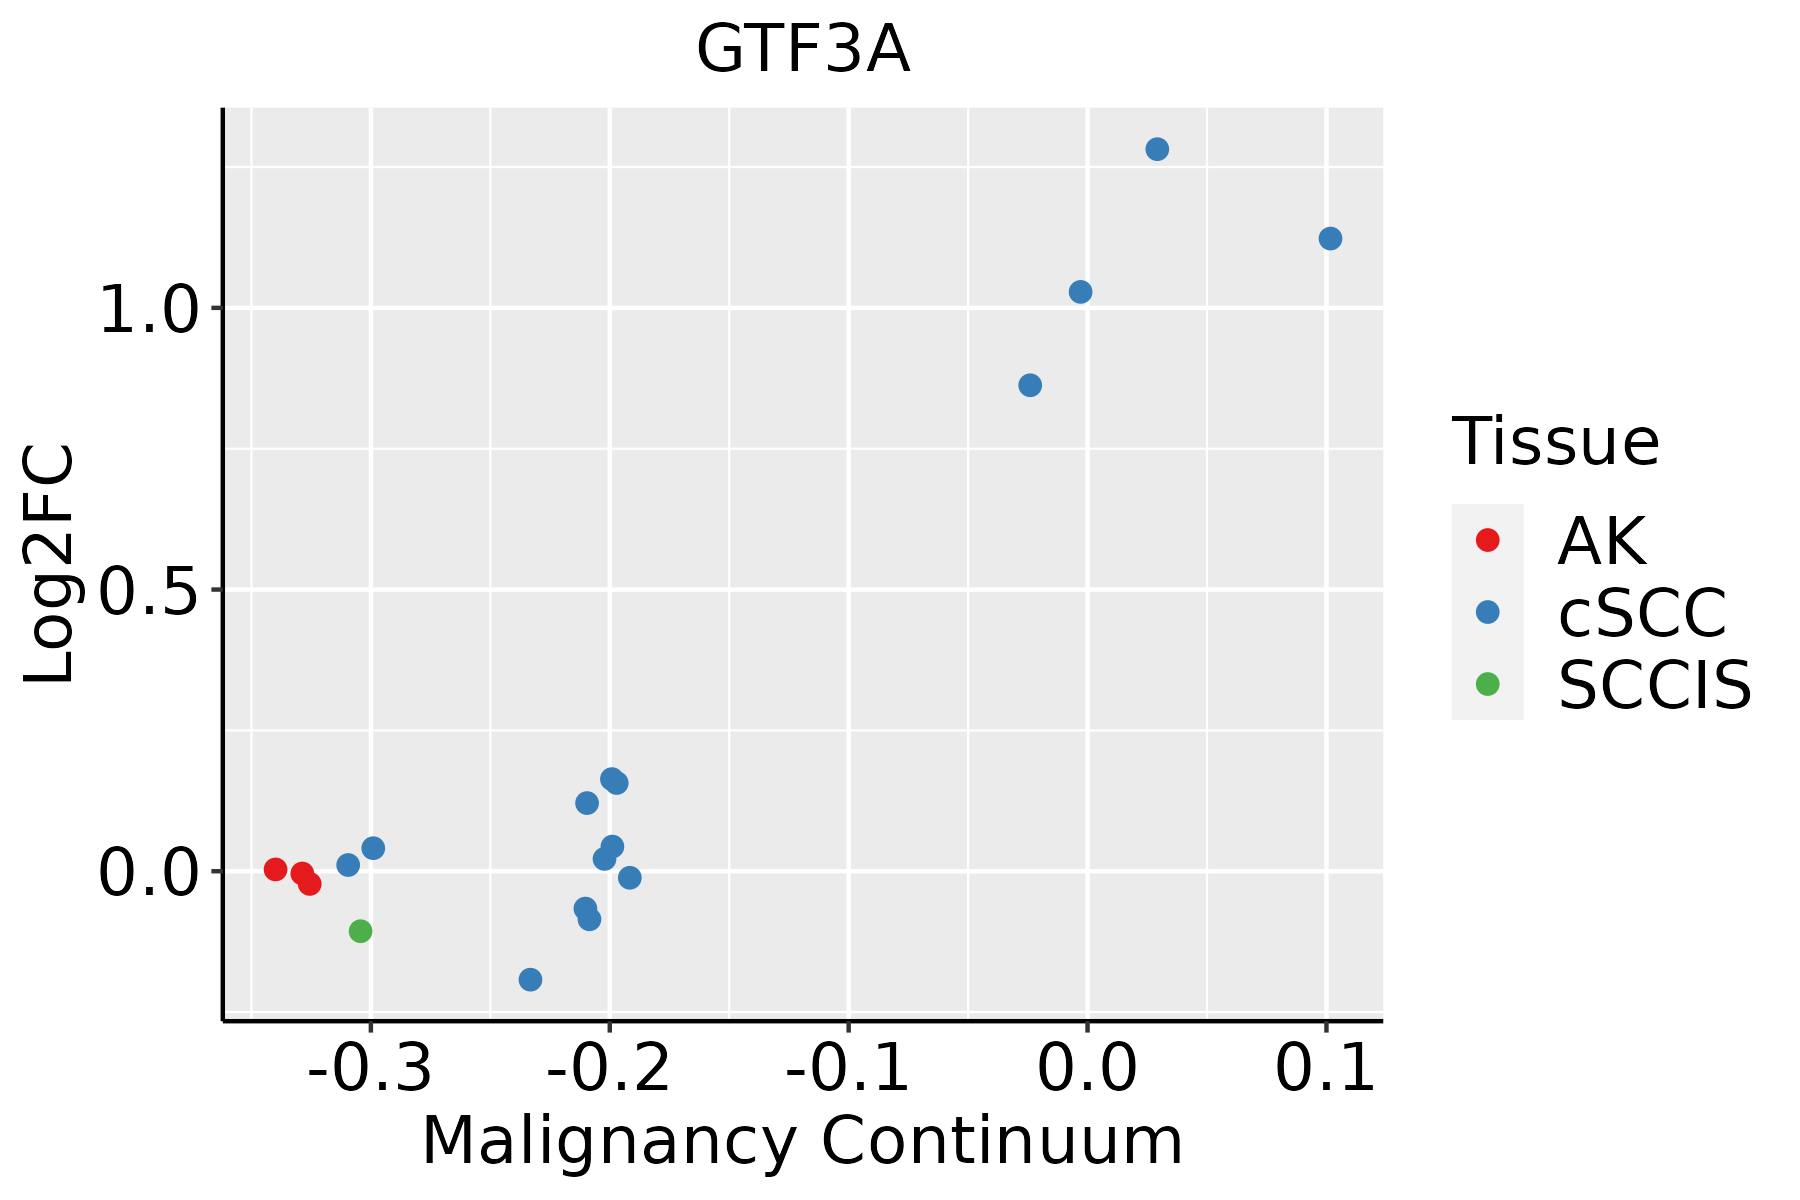 | AK: Actinic keratosis |
| cSCC: Cutaneous squamous cell carcinoma | ||
| SCCIS:squamous cell carcinoma in situ | ||
| Thyroid | 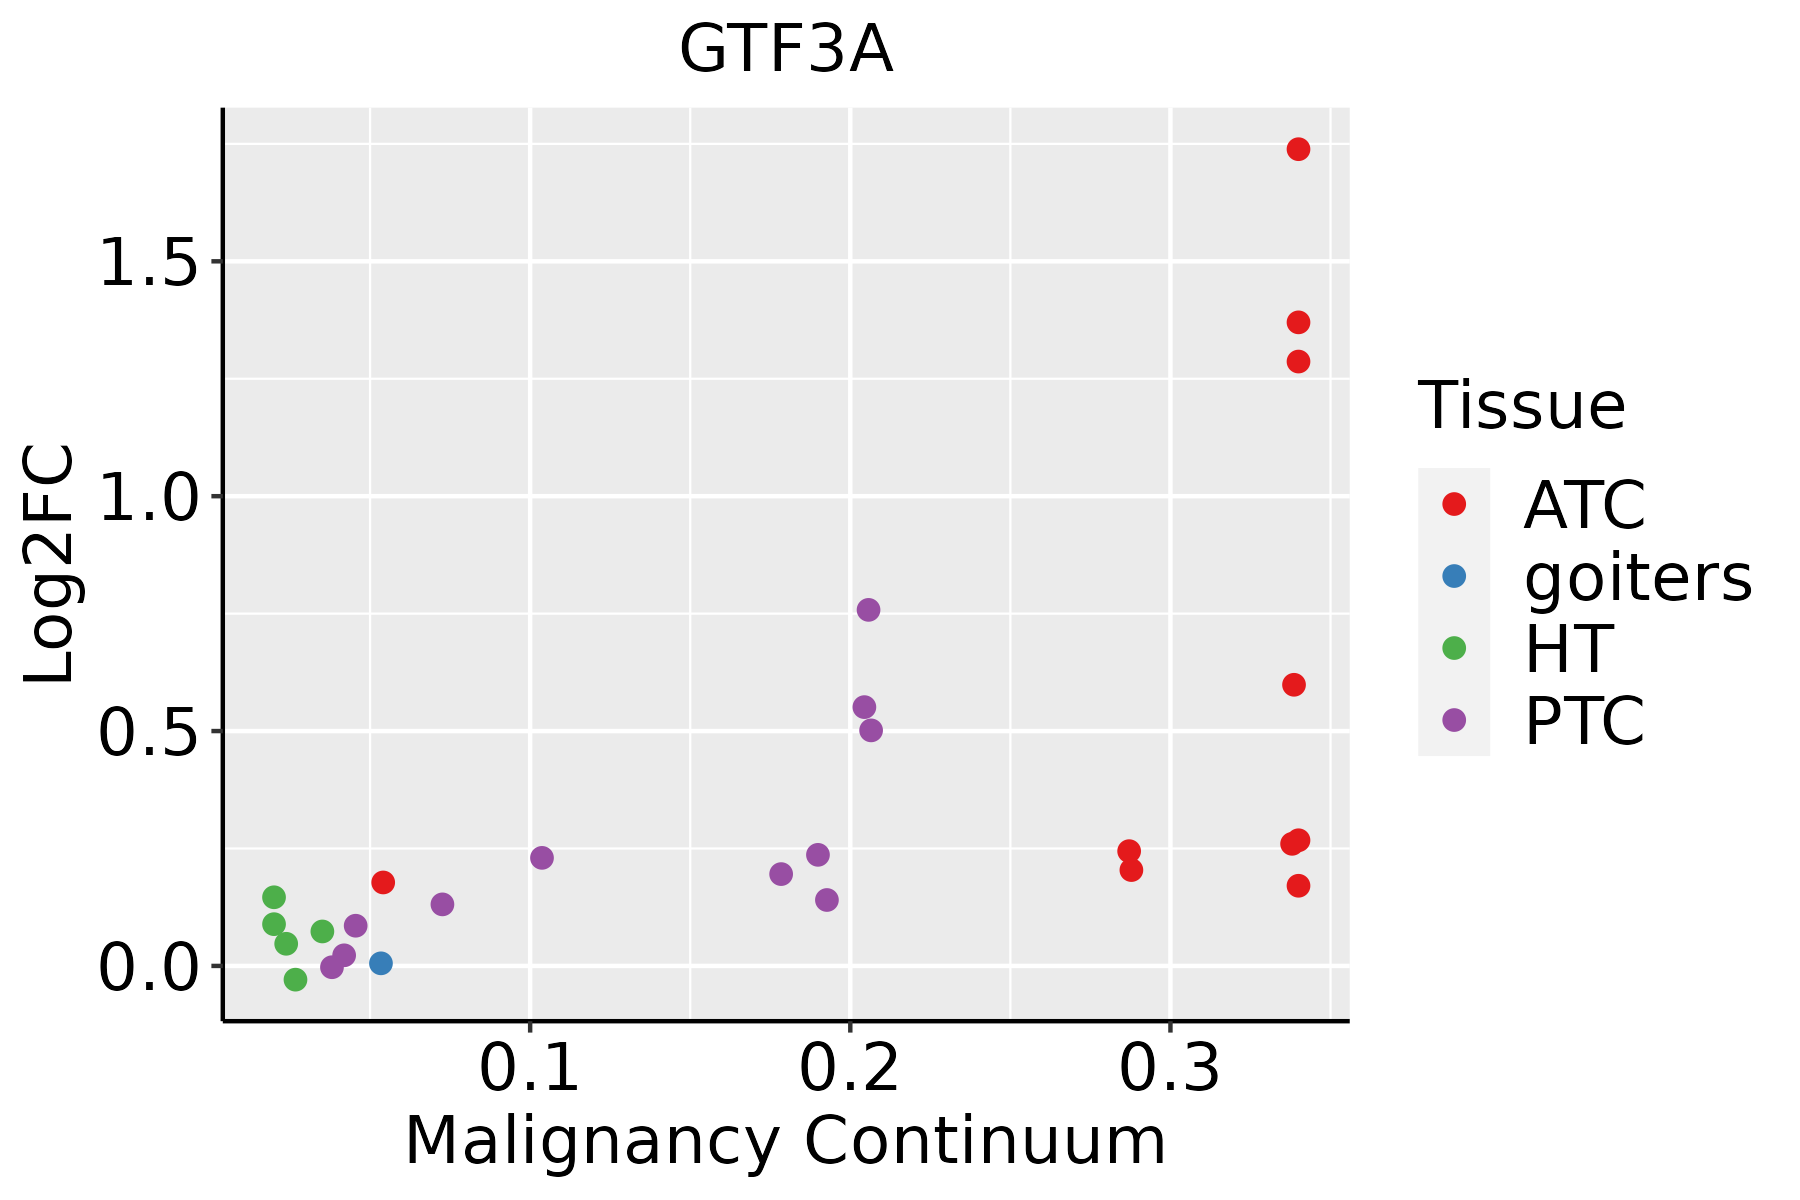 | ATC: Anaplastic thyroid cancer |
| HT: Hashimoto's thyroiditis | ||
| PTC: Papillary thyroid cancer |
| ∗log2FC in expression of this searched gene in stem-like cells from each diseased tissue sample relative to stem-like cells in normal samples in each tissue plotted against the malignancy continuum. Samples are colored based on if they are from different disease stage. |
Top |
Malignant transformation related pathway analysis |
| Find out the enriched GO biological processes and KEGG pathways involved in transition from healthy to precancer to cancer |
| Tissue | Disease Stage | Enriched GO biological Processes |
| Colorectum | AD |  |
| Colorectum | SER |  |
| Colorectum | MSS |  |
| Colorectum | MSI-H |  |
| Colorectum | FAP |  |
| ∗Top 15 enriched GO BP terms are showed in the bar plot of each disease state in each tissue. Each row represents a significant GO biological process which is colored according to the -log10(p.adjust). |
| Page: 1 2 3 4 5 6 7 8 9 |
| GO ID | Tissue | Disease Stage | Description | Gene Ratio | Bg Ratio | pvalue | p.adjust | Count |
| GO:004227326 | Esophagus | HGIN | ribosomal large subunit biogenesis | 34/2587 | 72/18723 | 8.82e-12 | 1.06e-09 | 34 |
| GO:0022613111 | Esophagus | ESCC | ribonucleoprotein complex biogenesis | 365/8552 | 463/18723 | 1.74e-49 | 1.11e-45 | 365 |
| GO:0042254111 | Esophagus | ESCC | ribosome biogenesis | 252/8552 | 299/18723 | 3.27e-44 | 1.04e-40 | 252 |
| GO:0042273111 | Esophagus | ESCC | ribosomal large subunit biogenesis | 65/8552 | 72/18723 | 1.53e-15 | 9.82e-14 | 65 |
| GO:00063833 | Esophagus | ESCC | transcription by RNA polymerase III | 41/8552 | 46/18723 | 7.69e-10 | 1.90e-08 | 41 |
| GO:00987812 | Esophagus | ESCC | ncRNA transcription | 45/8552 | 56/18723 | 1.05e-07 | 1.72e-06 | 45 |
| GO:00093032 | Esophagus | ESCC | rRNA transcription | 28/8552 | 34/18723 | 1.21e-05 | 1.12e-04 | 28 |
| GO:002261312 | Liver | Cirrhotic | ribonucleoprotein complex biogenesis | 231/4634 | 463/18723 | 3.28e-32 | 6.86e-29 | 231 |
| GO:004225412 | Liver | Cirrhotic | ribosome biogenesis | 154/4634 | 299/18723 | 1.18e-23 | 6.72e-21 | 154 |
| GO:004227312 | Liver | Cirrhotic | ribosomal large subunit biogenesis | 47/4634 | 72/18723 | 4.20e-13 | 3.29e-11 | 47 |
| GO:002261322 | Liver | HCC | ribonucleoprotein complex biogenesis | 355/7958 | 463/18723 | 7.76e-52 | 4.92e-48 | 355 |
| GO:004225422 | Liver | HCC | ribosome biogenesis | 246/7958 | 299/18723 | 4.99e-46 | 1.58e-42 | 246 |
| GO:004227322 | Liver | HCC | ribosomal large subunit biogenesis | 64/7958 | 72/18723 | 2.31e-16 | 2.03e-14 | 64 |
| GO:0009303 | Liver | HCC | rRNA transcription | 25/7958 | 34/18723 | 2.42e-04 | 1.81e-03 | 25 |
| GO:0006383 | Liver | HCC | transcription by RNA polymerase III | 31/7958 | 46/18723 | 5.67e-04 | 3.61e-03 | 31 |
| GO:0098781 | Liver | HCC | ncRNA transcription | 33/7958 | 56/18723 | 9.64e-03 | 3.63e-02 | 33 |
| GO:002261320 | Oral cavity | OSCC | ribonucleoprotein complex biogenesis | 333/7305 | 463/18723 | 8.28e-48 | 5.24e-44 | 333 |
| GO:004225420 | Oral cavity | OSCC | ribosome biogenesis | 230/7305 | 299/18723 | 3.22e-41 | 6.80e-38 | 230 |
| GO:004227320 | Oral cavity | OSCC | ribosomal large subunit biogenesis | 61/7305 | 72/18723 | 1.52e-15 | 1.06e-13 | 61 |
| GO:00063832 | Oral cavity | OSCC | transcription by RNA polymerase III | 34/7305 | 46/18723 | 1.61e-06 | 2.11e-05 | 34 |
| Page: 1 2 3 4 |
| Pathway ID | Tissue | Disease Stage | Description | Gene Ratio | Bg Ratio | pvalue | p.adjust | qvalue | Count |
| Page: 1 |
Top |
Cell-cell communication analysis |
| Identification of potential cell-cell interactions between two cell types and their ligand-receptor pairs for different disease states |
| Ligand | Receptor | LRpair | Pathway | Tissue | Disease Stage |
| Page: 1 |
Top |
Single-cell gene regulatory network inference analysis |
| Find out the significant the regulons (TFs) and the target genes of each regulon across cell types for different disease states |
| TF | Cell Type | Tissue | Disease Stage | Target Gene | RSS | Regulon Activity |
| GTF3A | MSC | Liver | Healthy | TMSB10,UNC5B,CTSZ, etc. | 1.98e-02 |  |
| GTF3A | MVA | Liver | NAFLD | TMSB10,UNC5B,CTSZ, etc. | 3.19e-02 |  |
| GTF3A | AT1 | Lung | IAC | RAC1,RPS3A,BRI3, etc. | 8.99e-02 |  |
| GTF3A | SPI | Oral cavity | ADJ | RPL21,SMIM19,ZDHHC4, etc. | 6.42e-02 |  |
| GTF3A | SPI | Oral cavity | LP | RPL21,SMIM19,ZDHHC4, etc. | 3.39e-01 |  |
| GTF3A | PLA | Oral cavity | OSCC | GYPC,RASGRP2,SEC11C, etc. | 1.45e-01 |  |
| GTF3A | SMC | Oral cavity | ADJ | PGAM2,PDE4DIP,CKM, etc. | 3.33e-01 | |
| GTF3A | PVA | Oral cavity | NEOLP | PGAM2,PDE4DIP,CKM, etc. | 3.89e-02 |  |
| GTF3A | CHIEF | Stomach | CAG with IM | DOK1,DNAJC27-AS1,STBD1, etc. | 5.10e-01 |  |
| GTF3A | CHIEF | Stomach | SIM | DOK1,DNAJC27-AS1,STBD1, etc. | 1.19e-01 |  |
| ∗The dot plots of a searched regulon are shown for all cell subpopulations in each disease state of each tissue based on the regulon specific score inferred using pySCENIC and by calculating the average expression. |
| Page: 1 2 |
Top |
Somatic mutation of malignant transformation related genes |
| Annotation of somatic variants for genes involved in malignant transformation |
| Hugo Symbol | Variant Class | Variant Classification | dbSNP RS | HGVSc | HGVSp | HGVSp Short | SWISSPROT | BIOTYPE | SIFT | PolyPhen | Tumor Sample Barcode | Tissue | Histology | Sex | Age | Stage | Therapy Types | Drugs | Outcome |
| GTF3A | SNV | Missense_Mutation | c.974N>G | p.Leu325Arg | p.L325R | Q92664 | protein_coding | deleterious(0) | probably_damaging(0.987) | TCGA-A6-5661-01 | Colorectum | colon adenocarcinoma | Female | >=65 | I/II | Unknown | Unknown | SD | |
| GTF3A | SNV | Missense_Mutation | c.569N>C | p.Val190Ala | p.V190A | Q92664 | protein_coding | tolerated(0.97) | benign(0.001) | TCGA-A6-A565-01 | Colorectum | colon adenocarcinoma | Female | <65 | III/IV | Unspecific | 5FU | PD | |
| GTF3A | SNV | Missense_Mutation | novel | c.304T>A | p.Cys102Ser | p.C102S | Q92664 | protein_coding | deleterious(0) | probably_damaging(1) | TCGA-AA-3858-01 | Colorectum | colon adenocarcinoma | Male | >=65 | I/II | Unknown | Unknown | SD |
| GTF3A | SNV | Missense_Mutation | novel | c.664N>C | p.Cys222Arg | p.C222R | Q92664 | protein_coding | deleterious(0) | probably_damaging(1) | TCGA-AA-3947-01 | Colorectum | colon adenocarcinoma | Female | <65 | I/II | Unknown | Unknown | SD |
| GTF3A | SNV | Missense_Mutation | novel | c.918G>T | p.Lys306Asn | p.K306N | Q92664 | protein_coding | deleterious(0.01) | possibly_damaging(0.777) | TCGA-AA-A010-01 | Colorectum | colon adenocarcinoma | Female | <65 | I/II | Chemotherapy | folinic | CR |
| GTF3A | SNV | Missense_Mutation | rs758878764 | c.683G>A | p.Arg228His | p.R228H | Q92664 | protein_coding | tolerated(0.12) | benign(0.168) | TCGA-D5-6926-01 | Colorectum | colon adenocarcinoma | Male | >=65 | III/IV | Chemotherapy | 5-fluorouracil | SD |
| GTF3A | SNV | Missense_Mutation | novel | c.918N>T | p.Lys306Asn | p.K306N | Q92664 | protein_coding | deleterious(0.01) | possibly_damaging(0.777) | TCGA-AG-3892-01 | Colorectum | rectum adenocarcinoma | Female | <65 | I/II | Unknown | Unknown | SD |
| GTF3A | SNV | Missense_Mutation | c.824N>A | p.Arg275His | p.R275H | Q92664 | protein_coding | deleterious(0.02) | benign(0.249) | TCGA-A5-A0G1-01 | Endometrium | uterine corpus endometrioid carcinoma | Female | >=65 | I/II | Unknown | Unknown | SD | |
| GTF3A | SNV | Missense_Mutation | rs758878764 | c.683N>A | p.Arg228His | p.R228H | Q92664 | protein_coding | tolerated(0.12) | benign(0.168) | TCGA-AX-A1CE-01 | Endometrium | uterine corpus endometrioid carcinoma | Female | <65 | I/II | Unspecific | Paclitaxel | SD |
| GTF3A | SNV | Missense_Mutation | novel | c.817N>A | p.Glu273Lys | p.E273K | Q92664 | protein_coding | tolerated(0.12) | possibly_damaging(0.894) | TCGA-AX-A2HC-01 | Endometrium | uterine corpus endometrioid carcinoma | Female | <65 | III/IV | Chemotherapy | paclitaxel | PD |
| Page: 1 2 3 |
Top |
Related drugs of malignant transformation related genes |
| Identification of chemicals and drugs interact with genes involved in malignant transfromation |
| (DGIdb 4.0) |
| Entrez ID | Symbol | Category | Interaction Types | Drug Claim Name | Drug Name | PMIDs |
| Page: 1 |

Copyright 2023-Present -The University of Texas Health Science Center at Houston |