
|
|||||
|
 | |
| |
| |
| |
| |
| |
|
Gene: GSTZ1 |
Gene summary for GSTZ1 |
| Gene information | Species | Human | Gene symbol | GSTZ1 | Gene ID | 2954 |
| Gene name | glutathione S-transferase zeta 1 | |
| Gene Alias | GSTZ1-1 | |
| Cytomap | 14q24.3 | |
| Gene Type | protein-coding | GO ID | GO:0006082 | UniProtAcc | O43708 |
Top |
Malignant transformation analysis |
| Identification of the aberrant gene expression in precancerous and cancerous lesions by comparing the gene expression of stem-like cells in diseased tissues with normal stem cells |
| Entrez ID | Symbol | Replicates | Species | Organ | Tissue | Adj P-value | Log2FC | Malignancy |
| 2954 | GSTZ1 | LZE4T | Human | Esophagus | ESCC | 1.78e-09 | 3.02e-01 | 0.0811 |
| 2954 | GSTZ1 | LZE8T | Human | Esophagus | ESCC | 9.39e-04 | 1.16e-01 | 0.067 |
| 2954 | GSTZ1 | LZE20T | Human | Esophagus | ESCC | 8.10e-03 | 2.06e-01 | 0.0662 |
| 2954 | GSTZ1 | LZE22D1 | Human | Esophagus | HGIN | 1.50e-02 | 3.46e-01 | 0.0595 |
| 2954 | GSTZ1 | LZE22T | Human | Esophagus | ESCC | 8.22e-04 | 3.70e-01 | 0.068 |
| 2954 | GSTZ1 | LZE24T | Human | Esophagus | ESCC | 1.56e-09 | 3.71e-01 | 0.0596 |
| 2954 | GSTZ1 | P1T-E | Human | Esophagus | ESCC | 1.59e-03 | 2.17e-01 | 0.0875 |
| 2954 | GSTZ1 | P2T-E | Human | Esophagus | ESCC | 1.04e-14 | 1.83e-01 | 0.1177 |
| 2954 | GSTZ1 | P4T-E | Human | Esophagus | ESCC | 5.99e-24 | 6.32e-01 | 0.1323 |
| 2954 | GSTZ1 | P5T-E | Human | Esophagus | ESCC | 6.13e-13 | 2.41e-01 | 0.1327 |
| 2954 | GSTZ1 | P8T-E | Human | Esophagus | ESCC | 2.54e-12 | 2.54e-01 | 0.0889 |
| 2954 | GSTZ1 | P9T-E | Human | Esophagus | ESCC | 1.03e-11 | 3.17e-01 | 0.1131 |
| 2954 | GSTZ1 | P10T-E | Human | Esophagus | ESCC | 9.94e-27 | 5.00e-01 | 0.116 |
| 2954 | GSTZ1 | P11T-E | Human | Esophagus | ESCC | 2.02e-09 | 4.19e-01 | 0.1426 |
| 2954 | GSTZ1 | P12T-E | Human | Esophagus | ESCC | 2.59e-41 | 8.46e-01 | 0.1122 |
| 2954 | GSTZ1 | P15T-E | Human | Esophagus | ESCC | 1.07e-32 | 8.05e-01 | 0.1149 |
| 2954 | GSTZ1 | P16T-E | Human | Esophagus | ESCC | 7.44e-18 | 4.47e-01 | 0.1153 |
| 2954 | GSTZ1 | P17T-E | Human | Esophagus | ESCC | 1.67e-07 | 3.19e-01 | 0.1278 |
| 2954 | GSTZ1 | P19T-E | Human | Esophagus | ESCC | 1.80e-02 | 3.67e-01 | 0.1662 |
| 2954 | GSTZ1 | P20T-E | Human | Esophagus | ESCC | 2.50e-17 | 4.12e-01 | 0.1124 |
| Page: 1 2 3 4 5 |
| Tissue | Expression Dynamics | Abbreviation |
| Esophagus | 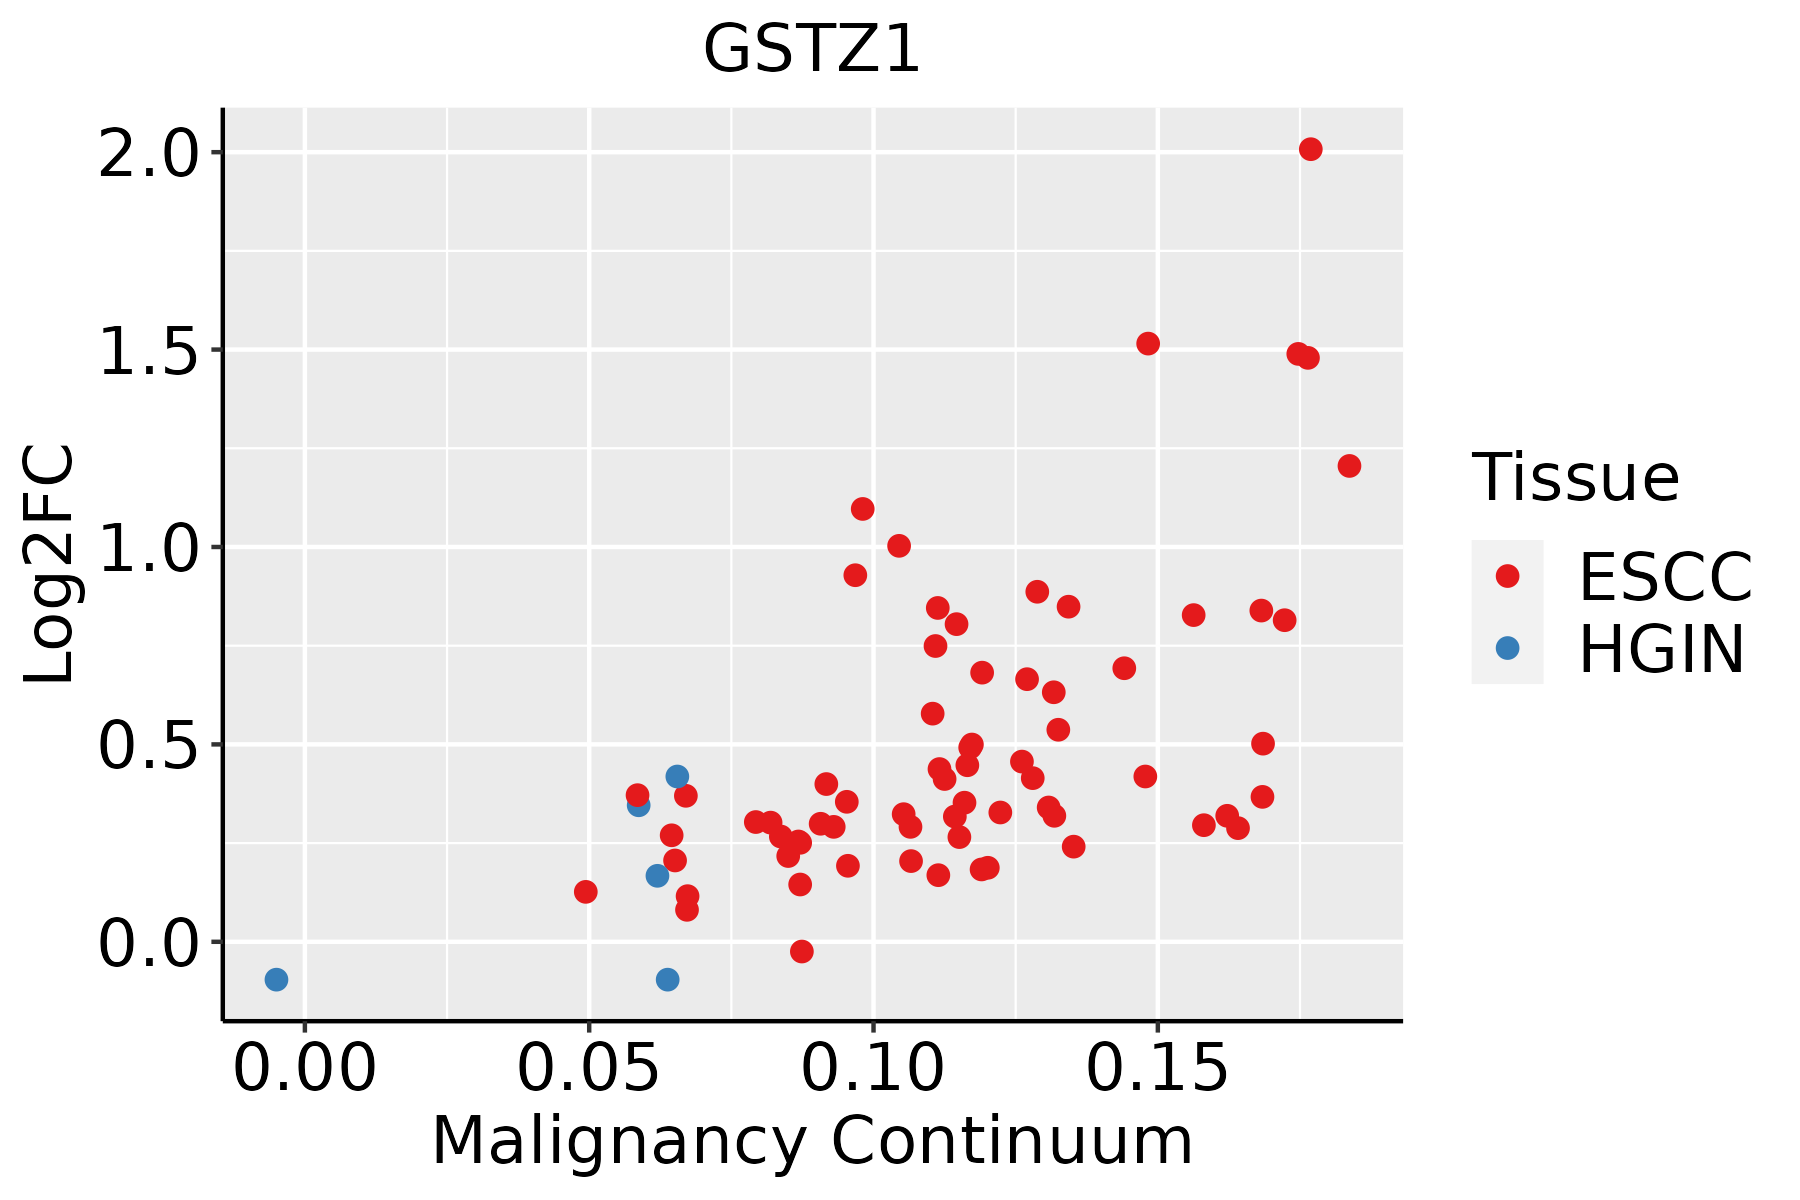 | ESCC: Esophageal squamous cell carcinoma |
| HGIN: High-grade intraepithelial neoplasias | ||
| LGIN: Low-grade intraepithelial neoplasias | ||
| Liver | 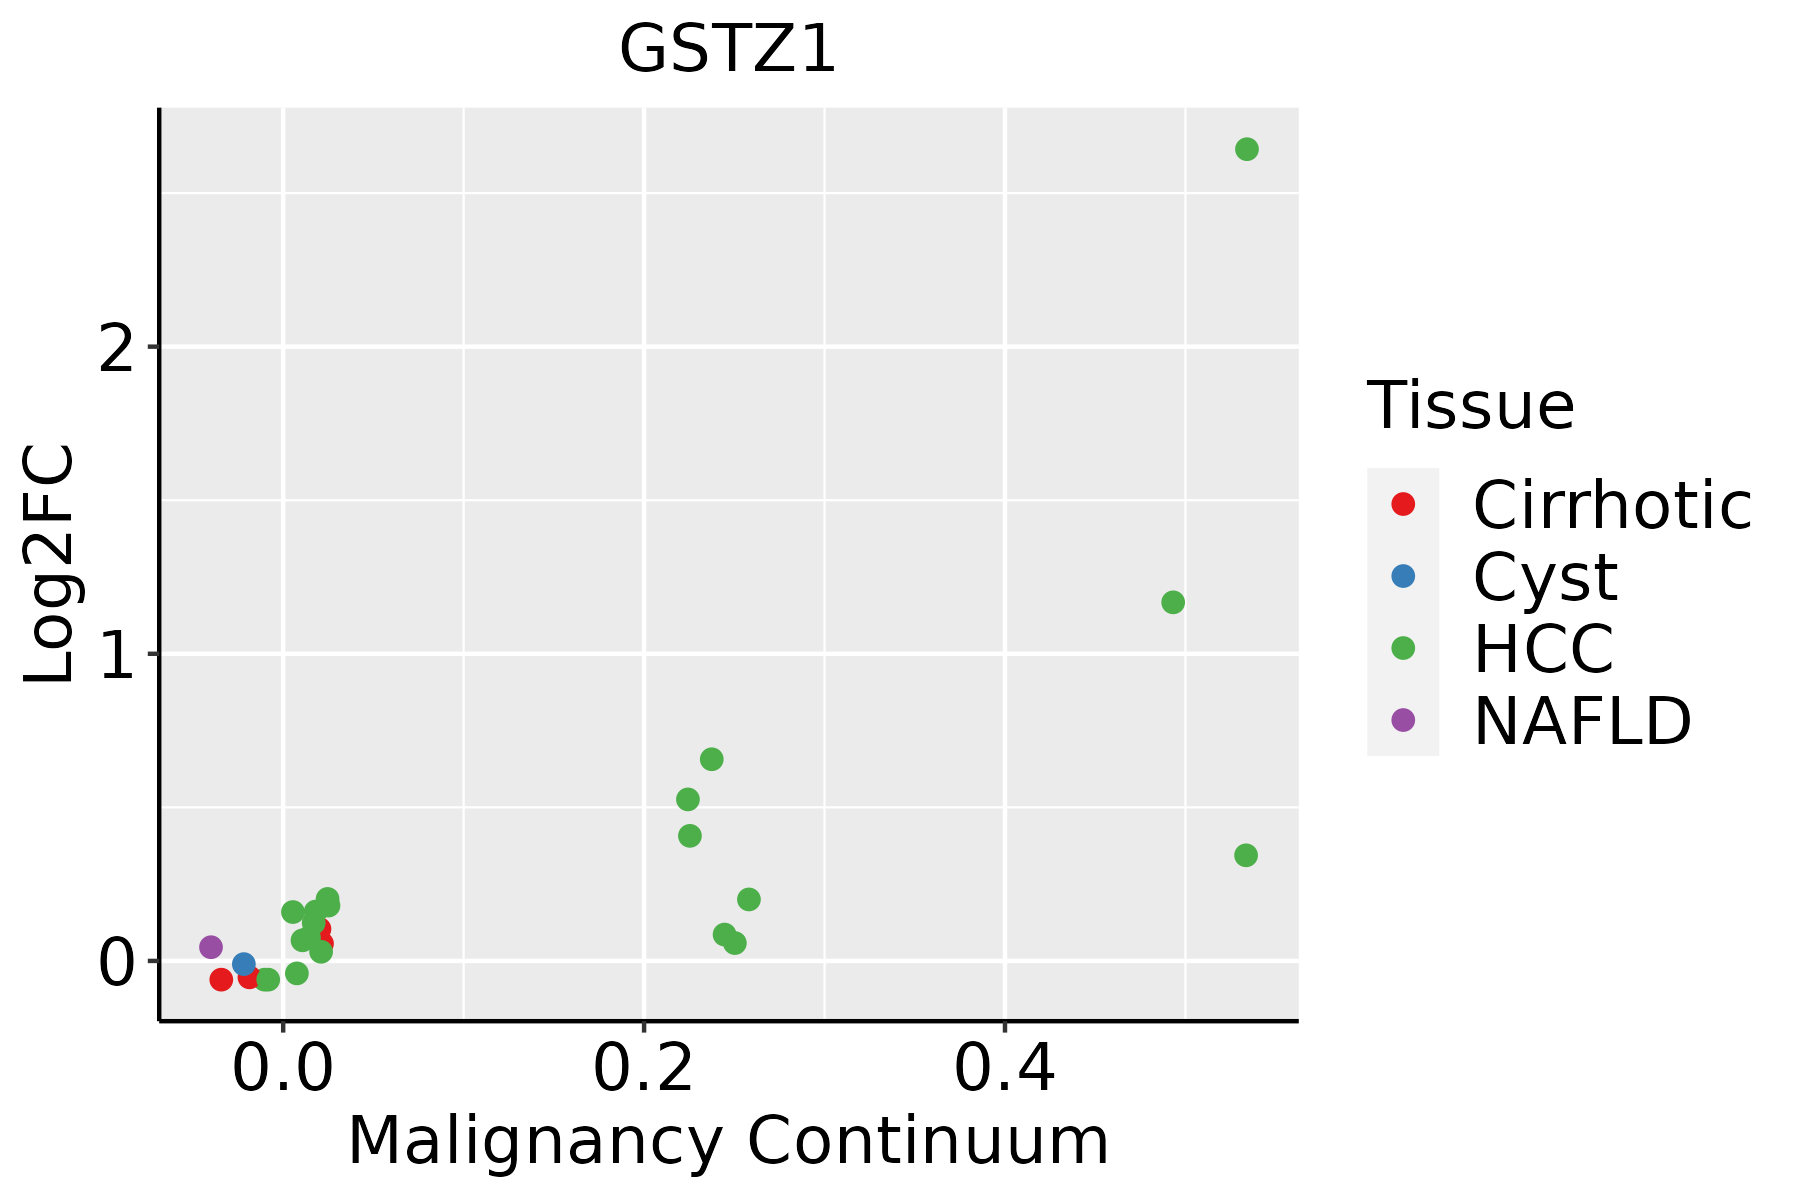 | HCC: Hepatocellular carcinoma |
| NAFLD: Non-alcoholic fatty liver disease | ||
| Oral Cavity |  | EOLP: Erosive Oral lichen planus |
| LP: leukoplakia | ||
| NEOLP: Non-erosive oral lichen planus | ||
| OSCC: Oral squamous cell carcinoma | ||
| Skin | 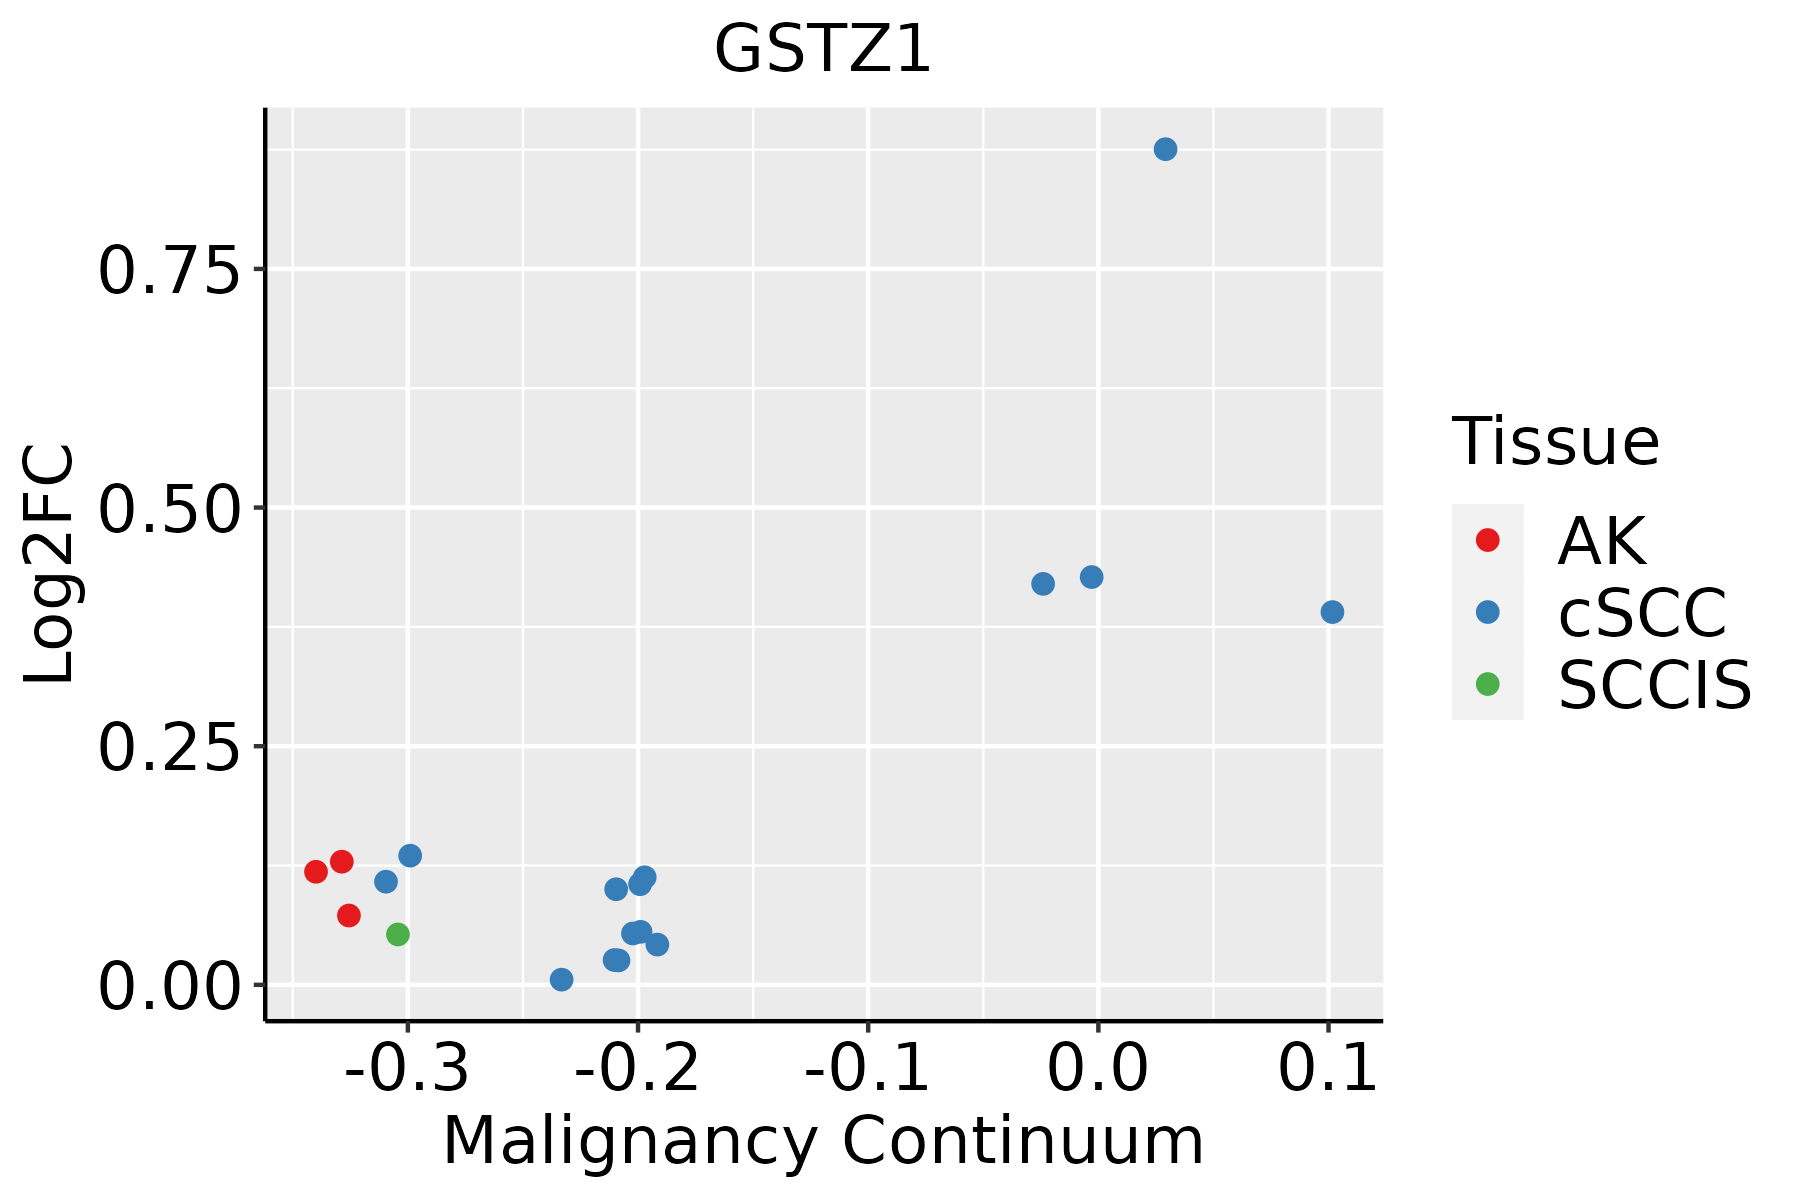 | AK: Actinic keratosis |
| cSCC: Cutaneous squamous cell carcinoma | ||
| SCCIS:squamous cell carcinoma in situ |
| ∗log2FC in expression of this searched gene in stem-like cells from each diseased tissue sample relative to stem-like cells in normal samples in each tissue plotted against the malignancy continuum. Samples are colored based on if they are from different disease stage. |
Top |
Malignant transformation related pathway analysis |
| Find out the enriched GO biological processes and KEGG pathways involved in transition from healthy to precancer to cancer |
| Tissue | Disease Stage | Enriched GO biological Processes |
| Colorectum | AD |  |
| Colorectum | SER |  |
| Colorectum | MSS |  |
| Colorectum | MSI-H |  |
| Colorectum | FAP |  |
| ∗Top 15 enriched GO BP terms are showed in the bar plot of each disease state in each tissue. Each row represents a significant GO biological process which is colored according to the -log10(p.adjust). |
| Page: 1 2 3 4 5 6 7 8 9 |
| GO ID | Tissue | Disease Stage | Description | Gene Ratio | Bg Ratio | pvalue | p.adjust | Count |
| GO:001605421 | Liver | HCC | organic acid catabolic process | 152/7958 | 240/18723 | 5.11e-11 | 1.92e-09 | 152 |
| GO:00463952 | Liver | HCC | carboxylic acid catabolic process | 149/7958 | 236/18723 | 1.11e-10 | 3.87e-09 | 149 |
| GO:19016052 | Liver | HCC | alpha-amino acid metabolic process | 124/7958 | 195/18723 | 2.07e-09 | 5.79e-08 | 124 |
| GO:000657521 | Liver | HCC | cellular modified amino acid metabolic process | 119/7958 | 188/18723 | 6.47e-09 | 1.67e-07 | 119 |
| GO:00065202 | Liver | HCC | cellular amino acid metabolic process | 167/7958 | 284/18723 | 1.91e-08 | 4.56e-07 | 167 |
| GO:000963622 | Liver | HCC | response to toxic substance | 153/7958 | 262/18723 | 1.37e-07 | 2.58e-06 | 153 |
| GO:00090632 | Liver | HCC | cellular amino acid catabolic process | 70/7958 | 110/18723 | 6.12e-06 | 7.52e-05 | 70 |
| GO:000674911 | Liver | HCC | glutathione metabolic process | 44/7958 | 64/18723 | 1.95e-05 | 2.09e-04 | 44 |
| GO:199074812 | Liver | HCC | cellular detoxification | 70/7958 | 116/18723 | 7.87e-05 | 7.02e-04 | 70 |
| GO:009723712 | Liver | HCC | cellular response to toxic substance | 74/7958 | 124/18723 | 8.36e-05 | 7.36e-04 | 74 |
| GO:009875412 | Liver | HCC | detoxification | 87/7958 | 152/18723 | 1.70e-04 | 1.35e-03 | 87 |
| GO:19016062 | Liver | HCC | alpha-amino acid catabolic process | 53/7958 | 87/18723 | 4.01e-04 | 2.71e-03 | 53 |
| GO:009886912 | Liver | HCC | cellular oxidant detoxification | 59/7958 | 101/18723 | 9.00e-04 | 5.31e-03 | 59 |
| GO:00090742 | Liver | HCC | aromatic amino acid family catabolic process | 13/7958 | 16/18723 | 1.84e-03 | 9.42e-03 | 13 |
| GO:001943915 | Oral cavity | OSCC | aromatic compound catabolic process | 263/7305 | 467/18723 | 1.49e-14 | 8.84e-13 | 263 |
| GO:190136115 | Oral cavity | OSCC | organic cyclic compound catabolic process | 272/7305 | 495/18723 | 2.73e-13 | 1.36e-11 | 272 |
| GO:000963618 | Oral cavity | OSCC | response to toxic substance | 137/7305 | 262/18723 | 7.94e-06 | 8.52e-05 | 137 |
| GO:00067905 | Oral cavity | OSCC | sulfur compound metabolic process | 168/7305 | 339/18723 | 4.50e-05 | 3.84e-04 | 168 |
| GO:199074818 | Oral cavity | OSCC | cellular detoxification | 63/7305 | 116/18723 | 5.80e-04 | 3.31e-03 | 63 |
| GO:009886918 | Oral cavity | OSCC | cellular oxidant detoxification | 55/7305 | 101/18723 | 1.16e-03 | 5.89e-03 | 55 |
| Page: 1 2 3 |
| Pathway ID | Tissue | Disease Stage | Description | Gene Ratio | Bg Ratio | pvalue | p.adjust | qvalue | Count |
| Page: 1 |
Top |
Cell-cell communication analysis |
| Identification of potential cell-cell interactions between two cell types and their ligand-receptor pairs for different disease states |
| Ligand | Receptor | LRpair | Pathway | Tissue | Disease Stage |
| Page: 1 |
Top |
Single-cell gene regulatory network inference analysis |
| Find out the significant the regulons (TFs) and the target genes of each regulon across cell types for different disease states |
| TF | Cell Type | Tissue | Disease Stage | Target Gene | RSS | Regulon Activity |
| ∗The dot plots of a searched regulon are shown for all cell subpopulations in each disease state of each tissue based on the regulon specific score inferred using pySCENIC and by calculating the average expression. |
| Page: 1 |
Top |
Somatic mutation of malignant transformation related genes |
| Annotation of somatic variants for genes involved in malignant transformation |
| Hugo Symbol | Variant Class | Variant Classification | dbSNP RS | HGVSc | HGVSp | HGVSp Short | SWISSPROT | BIOTYPE | SIFT | PolyPhen | Tumor Sample Barcode | Tissue | Histology | Sex | Age | Stage | Therapy Types | Drugs | Outcome |
| GSTZ1 | SNV | Missense_Mutation | c.148T>A | p.Phe50Ile | p.F50I | protein_coding | deleterious(0) | probably_damaging(0.954) | TCGA-BH-A0WA-01 | Breast | breast invasive carcinoma | Female | >=65 | I/II | Unknown | Unknown | SD | ||
| GSTZ1 | insertion | Frame_Shift_Ins | novel | c.428_429insCC | p.Glu143AspfsTer14 | p.E143Dfs*14 | protein_coding | TCGA-BH-A0AY-01 | Breast | breast invasive carcinoma | Female | <65 | I/II | Chemotherapy | SD | ||||
| GSTZ1 | insertion | Nonsense_Mutation | novel | c.430_431insTGCGTTCCGAGAAGCTCTAGTTTCCA | p.Gln144LeufsTer7 | p.Q144Lfs*7 | protein_coding | TCGA-BH-A0AY-01 | Breast | breast invasive carcinoma | Female | <65 | I/II | Chemotherapy | SD | ||||
| GSTZ1 | SNV | Missense_Mutation | c.607N>T | p.His203Tyr | p.H203Y | protein_coding | deleterious(0) | probably_damaging(0.931) | TCGA-EA-A3QE-01 | Cervix | cervical & endocervical cancer | Female | <65 | I/II | Unknown | Unknown | SD | ||
| GSTZ1 | SNV | Missense_Mutation | rs774523538 | c.298N>T | p.Arg100Cys | p.R100C | protein_coding | deleterious(0) | probably_damaging(0.994) | TCGA-VS-A94Z-01 | Cervix | cervical & endocervical cancer | Female | <65 | I/II | Chemotherapy | cisplatin | CR | |
| GSTZ1 | SNV | Missense_Mutation | c.20N>A | p.Ile7Asn | p.I7N | protein_coding | deleterious(0) | possibly_damaging(0.85) | TCGA-AA-A01R-01 | Colorectum | colon adenocarcinoma | Male | <65 | III/IV | Chemotherapy | 5-fluorouracil | PD | ||
| GSTZ1 | SNV | Missense_Mutation | rs866913315 | c.511N>A | p.Ala171Thr | p.A171T | protein_coding | deleterious(0.02) | benign(0.06) | TCGA-AD-6889-01 | Colorectum | colon adenocarcinoma | Male | >=65 | I/II | Chemotherapy | xeloda | PD | |
| GSTZ1 | SNV | Missense_Mutation | rs750964006 | c.98N>T | p.Thr33Met | p.T33M | protein_coding | tolerated(0.11) | benign(0.011) | TCGA-CM-5863-01 | Colorectum | colon adenocarcinoma | Female | <65 | III/IV | Chemotherapy | oxaliplatin | SD | |
| GSTZ1 | SNV | Missense_Mutation | c.25N>C | p.Tyr9His | p.Y9H | protein_coding | tolerated(0.1) | probably_damaging(0.915) | TCGA-D5-6530-01 | Colorectum | colon adenocarcinoma | Male | <65 | I/II | Unknown | Unknown | SD | ||
| GSTZ1 | SNV | Missense_Mutation | novel | c.604N>C | p.Ser202Pro | p.S202P | protein_coding | deleterious(0) | possibly_damaging(0.779) | TCGA-AG-3742-01 | Colorectum | rectum adenocarcinoma | Female | >=65 | I/II | Unknown | Unknown | SD |
| Page: 1 2 3 |
Top |
Related drugs of malignant transformation related genes |
| Identification of chemicals and drugs interact with genes involved in malignant transfromation |
| (DGIdb 4.0) |
| Entrez ID | Symbol | Category | Interaction Types | Drug Claim Name | Drug Name | PMIDs |
| 2954 | GSTZ1 | ENZYME, DRUGGABLE GENOME | dichloroacetic acid | 27143230 |
| Page: 1 |

Copyright 2023-Present -The University of Texas Health Science Center at Houston |