Schematic overview of the cellular and molecular mechanisms involved in the cancer progression, including the proposed cellular and molecular mechanisms in cancer cells trajectory. AT1: alveolar type 1 cells; AT2: alveolar type 2 cells; AAH: atypical adenomatous hyperplasia; AIS: adenocarcinoma in situ; MIA: minimally invasive adenocarcinoma; IA: invasive adenocarcinoma; EMT: epithelial-mesenchymal transition

Home

Download

Statistics

Help

Contact

Center for Computational Systems Medicine
leaf

Gene summary

leaf

Malignant transformation analysis

leaf

Malignant transformation related pathway analysis

leaf

Cell-cell communication analysis

leaf

Single-cell gene regulatory network inference analysis

leaf

Somatic mutation of malignant transformation related genes

leaf

Related drugs of malignant transformation related genes

Gene: GPSM2

Gene summary for GPSM2

check button Gene summary.

Gene informationSpeciesHuman
Gene symbol

GPSM2

Gene ID

29899

Gene nameG protein signaling modulator 2
Gene AliasCMCS
Cytomap1p13.3
Gene Typeprotein-coding
GO ID

GO:0000132

UniProtAcc

A0A024R0F8


Top

Malignant transformation analysis

check button Identification of the aberrant gene expression in precancerous and cancerous lesions by comparing the gene expression of stem-like cells in diseased tissues with normal stem cells
check button Malignant transformation involving gene list.
Entrez IDSymbolReplicatesSpeciesOrganTissueAdj P-valueLog2FCMalignancy
29899GPSM2CA_HPV_3HumanCervixCC1.23e-052.70e-010.0414
29899GPSM2CCI_1HumanCervixCC3.07e-024.69e-010.528
29899GPSM2CCI_2HumanCervixCC2.41e-036.30e-010.5249
29899GPSM2CCI_3HumanCervixCC3.70e-025.02e-010.516
29899GPSM2LZE22THumanEsophagusESCC2.93e-033.12e-010.068
29899GPSM2P2T-EHumanEsophagusESCC7.79e-042.63e-010.1177
29899GPSM2P4T-EHumanEsophagusESCC1.53e-092.46e-010.1323
29899GPSM2P5T-EHumanEsophagusESCC1.33e-112.47e-010.1327
29899GPSM2P8T-EHumanEsophagusESCC1.71e-021.11e-020.0889
29899GPSM2P9T-EHumanEsophagusESCC1.14e-021.49e-010.1131
29899GPSM2P10T-EHumanEsophagusESCC3.49e-052.99e-010.116
29899GPSM2P11T-EHumanEsophagusESCC5.91e-092.34e-010.1426
29899GPSM2P12T-EHumanEsophagusESCC2.86e-031.88e-010.1122
29899GPSM2P15T-EHumanEsophagusESCC2.78e-021.50e-010.1149
29899GPSM2P17T-EHumanEsophagusESCC4.31e-035.52e-010.1278
29899GPSM2P19T-EHumanEsophagusESCC3.01e-045.69e-010.1662
29899GPSM2P20T-EHumanEsophagusESCC6.85e-226.69e-010.1124
29899GPSM2P21T-EHumanEsophagusESCC1.72e-113.01e-010.1617
29899GPSM2P23T-EHumanEsophagusESCC1.28e-106.15e-010.108
29899GPSM2P24T-EHumanEsophagusESCC3.54e-062.85e-010.1287
Page: 1 2 3 4 5 

check button Transcriptomic changes along malignancy continuum.
TissueExpression DynamicsAbbreviation
CervixThe image shows the transcriptomic changes along malignancy continuum.log2FC in expression of this searched gene in stem-like cells from each diseased tissue sample relative to stem-like cells in normal samples in each tissue plotted against the malignancy continuum. Samples are colored based on if they are from different disease stage.CC: Cervix cancer
HSIL_HPV: HPV-infected high-grade squamous intraepithelial lesions
N_HPV: HPV-infected normal cervix
EsophagusThe image shows the transcriptomic changes along malignancy continuum.log2FC in expression of this searched gene in stem-like cells from each diseased tissue sample relative to stem-like cells in normal samples in each tissue plotted against the malignancy continuum. Samples are colored based on if they are from different disease stage.
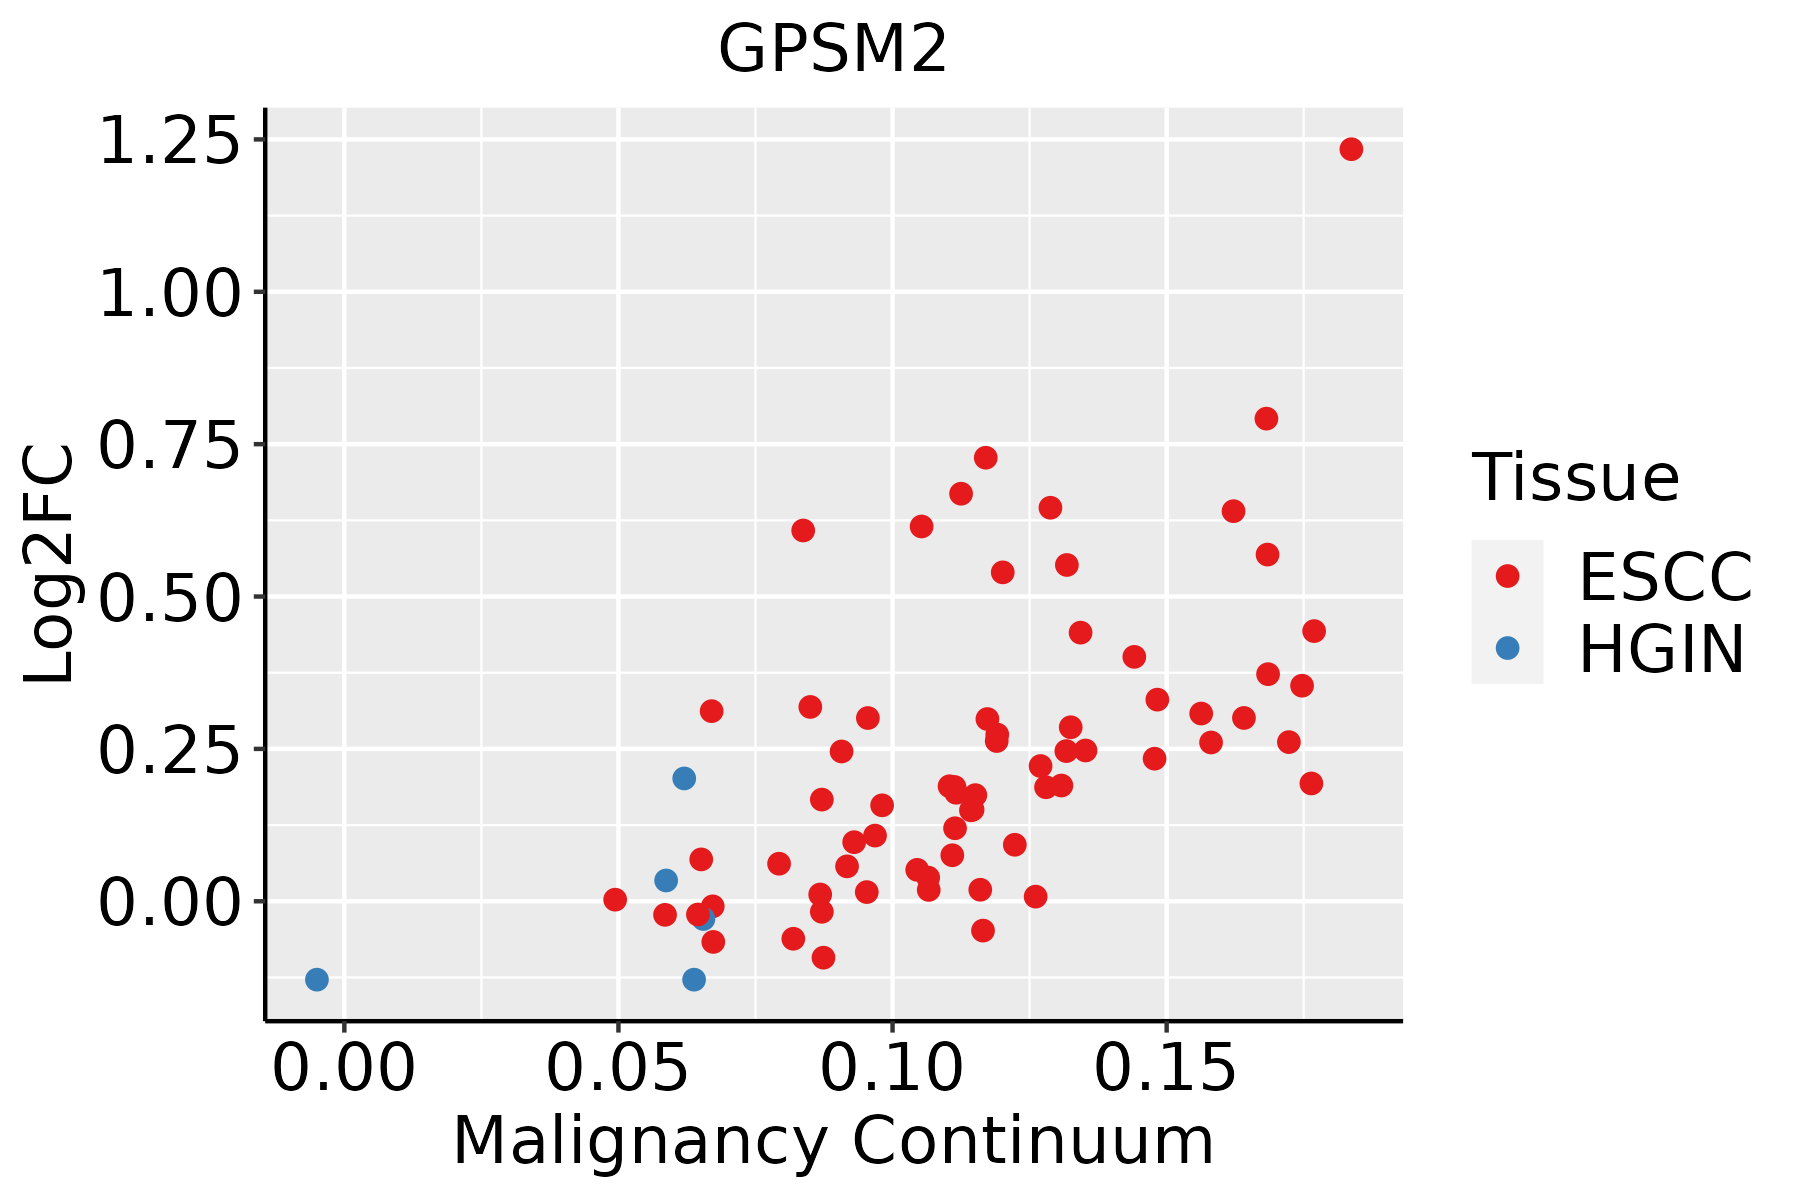
ESCC: Esophageal squamous cell carcinoma
HGIN: High-grade intraepithelial neoplasias
LGIN: Low-grade intraepithelial neoplasias
LiverThe image shows the transcriptomic changes along malignancy continuum.log2FC in expression of this searched gene in stem-like cells from each diseased tissue sample relative to stem-like cells in normal samples in each tissue plotted against the malignancy continuum. Samples are colored based on if they are from different disease stage.
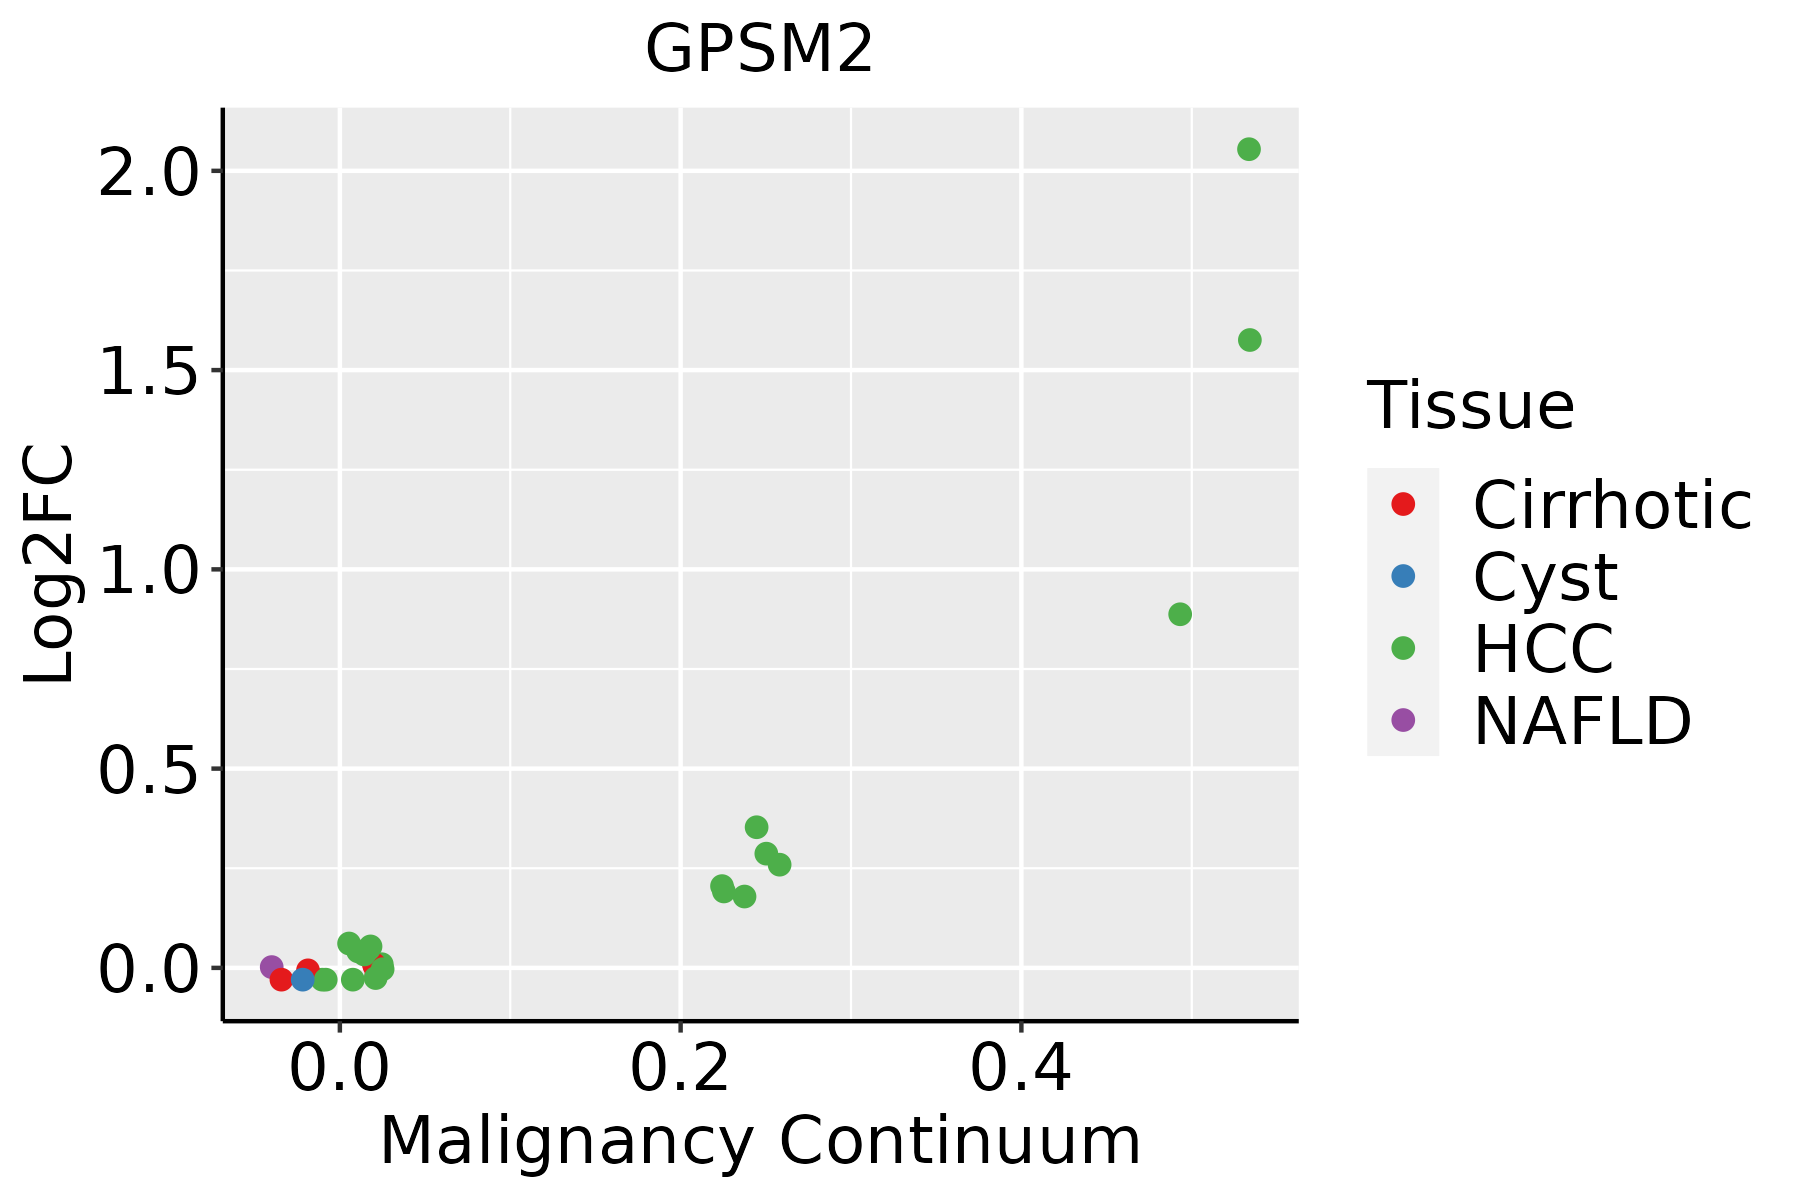
HCC: Hepatocellular carcinoma
NAFLD: Non-alcoholic fatty liver disease
Oral CavityThe image shows the transcriptomic changes along malignancy continuum.log2FC in expression of this searched gene in stem-like cells from each diseased tissue sample relative to stem-like cells in normal samples in each tissue plotted against the malignancy continuum. Samples are colored based on if they are from different disease stage.EOLP: Erosive Oral lichen planus
LP: leukoplakia
NEOLP: Non-erosive oral lichen planus
OSCC: Oral squamous cell carcinoma
SkinThe image shows the transcriptomic changes along malignancy continuum.log2FC in expression of this searched gene in stem-like cells from each diseased tissue sample relative to stem-like cells in normal samples in each tissue plotted against the malignancy continuum. Samples are colored based on if they are from different disease stage.
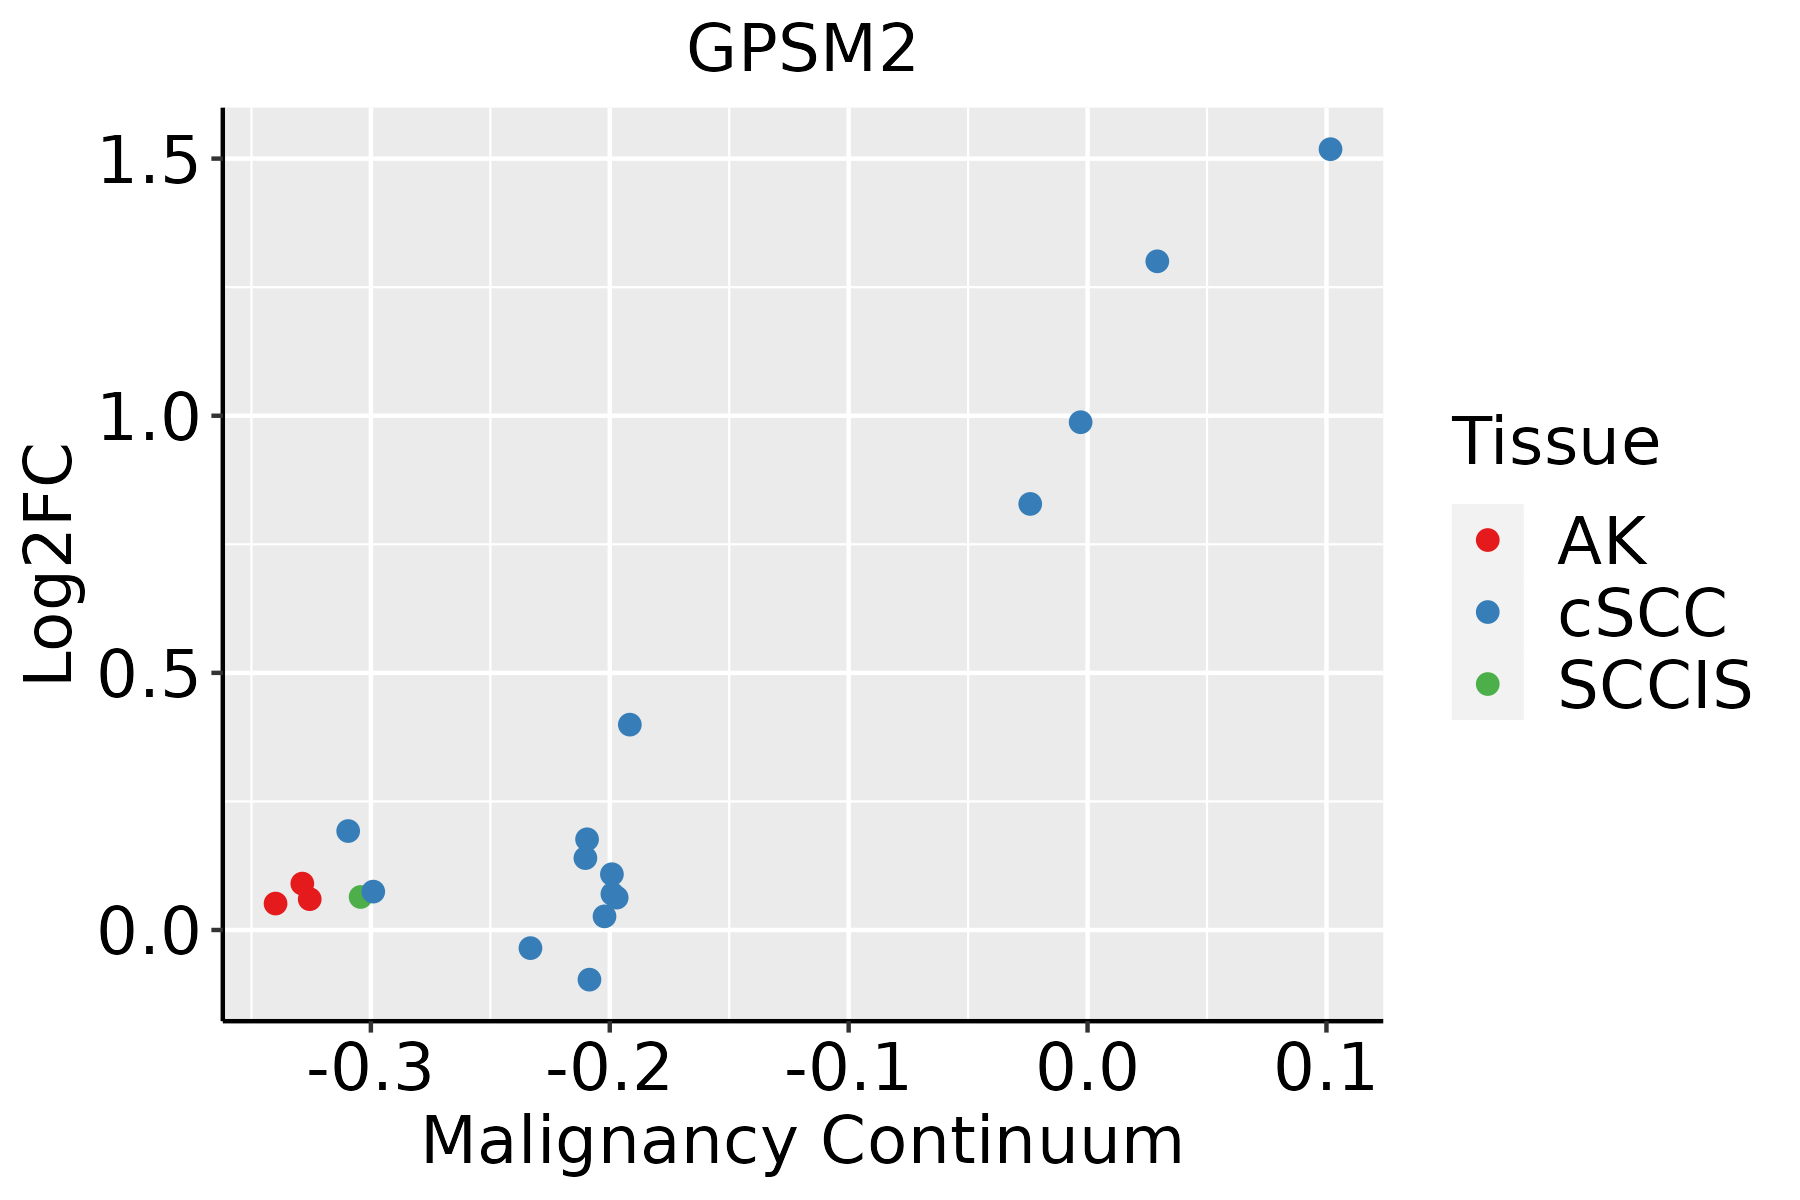
AK: Actinic keratosis
cSCC: Cutaneous squamous cell carcinoma
SCCIS:squamous cell carcinoma in situ
ThyroidThe image shows the transcriptomic changes along malignancy continuum.log2FC in expression of this searched gene in stem-like cells from each diseased tissue sample relative to stem-like cells in normal samples in each tissue plotted against the malignancy continuum. Samples are colored based on if they are from different disease stage.
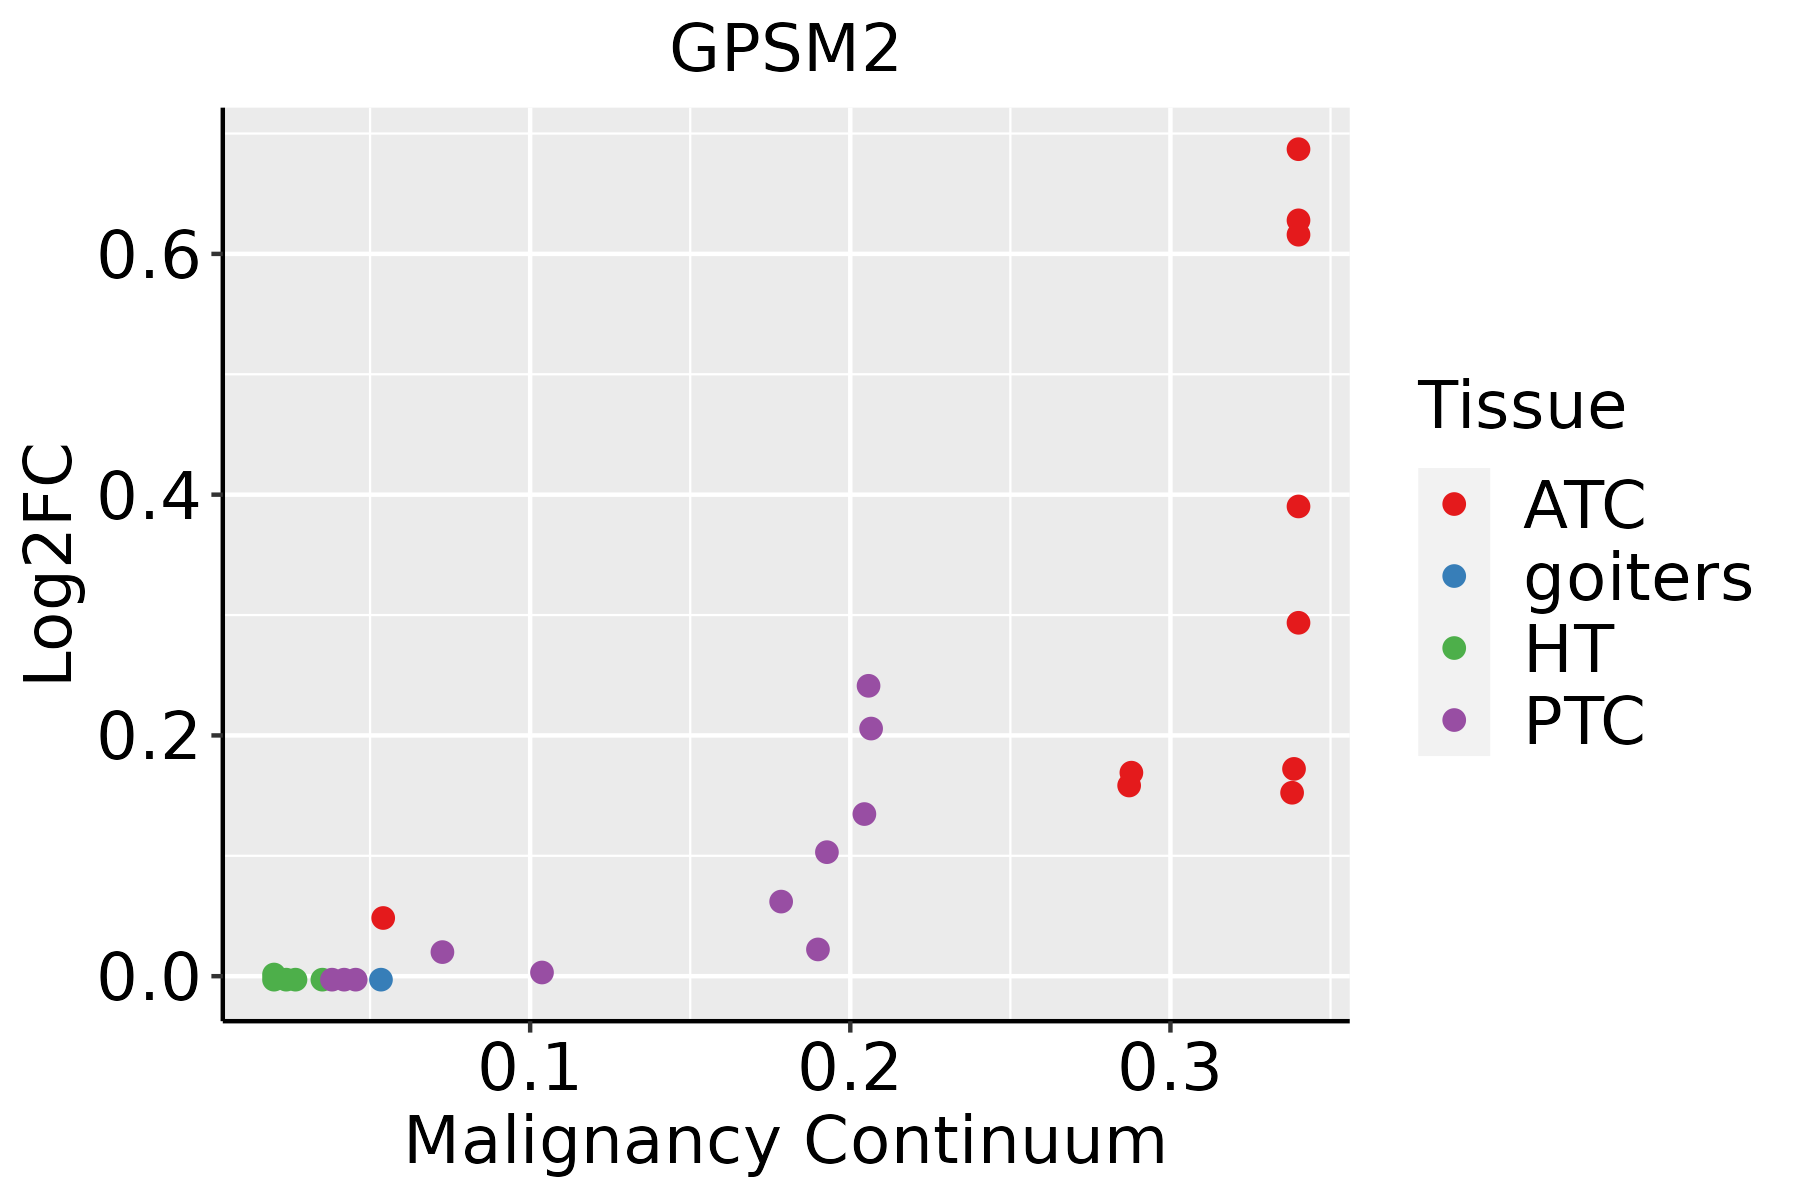
ATC: Anaplastic thyroid cancer
HT: Hashimoto's thyroiditis
PTC: Papillary thyroid cancer
∗log2FC in expression of this searched gene in stem-like cells from each diseased tissue sample relative to stem-like cells in normal samples in each tissue plotted against the malignancy continuum. Samples are colored based on if they are from different disease stage.

Top

Malignant transformation related pathway analysis

check buttonFind out the enriched GO biological processes and KEGG pathways involved in transition from healthy to precancer to cancer
check button Figure of enriched GO biological processes.
TissueDisease StageEnriched GO biological Processes
ColorectumADGO analysis - Figure of enriched GO biological processes: Top 15 enriched GO BP terms are showed in the bar plot of each disease state in each tissue. Each row represents a significant GO biological process which is colored according to the -log10(p.adjust).
ColorectumSERGO analysis - Figure of enriched GO biological processes: Top 15 enriched GO BP terms are showed in the bar plot of each disease state in each tissue. Each row represents a significant GO biological process which is colored according to the -log10(p.adjust).
ColorectumMSSGO analysis - Figure of enriched GO biological processes: Top 15 enriched GO BP terms are showed in the bar plot of each disease state in each tissue. Each row represents a significant GO biological process which is colored according to the -log10(p.adjust).
ColorectumMSI-HGO analysis - Figure of enriched GO biological processes: Top 15 enriched GO BP terms are showed in the bar plot of each disease state in each tissue. Each row represents a significant GO biological process which is colored according to the -log10(p.adjust).
ColorectumFAPGO analysis - Figure of enriched GO biological processes: Top 15 enriched GO BP terms are showed in the bar plot of each disease state in each tissue. Each row represents a significant GO biological process which is colored according to the -log10(p.adjust).
∗Top 15 enriched GO BP terms are showed in the bar plot of each disease state in each tissue. Each row represents a significant GO biological process which is colored according to the -log10(p.adjust).
Page: 1 2 3 4 5 6 7 8 9 

check button Enriched GO biological processes.
GO IDTissueDisease StageDescriptionGene RatioBg Ratiopvaluep.adjustCount
GO:1903829111EsophagusESCCpositive regulation of cellular protein localization199/8552276/187232.99e-193.45e-17199
GO:190285015EsophagusESCCmicrotubule cytoskeleton organization involved in mitosis116/8552147/187231.25e-169.91e-15116
GO:000705214EsophagusESCCmitotic spindle organization97/8552120/187232.17e-151.33e-1397
GO:000705114EsophagusESCCspindle organization134/8552184/187235.70e-142.87e-12134
GO:199077819EsophagusESCCprotein localization to cell periphery217/8552333/187234.08e-131.88e-11217
GO:004578710EsophagusESCCpositive regulation of cell cycle196/8552313/187239.27e-102.24e-08196
GO:000716320EsophagusESCCestablishment or maintenance of cell polarity143/8552218/187232.05e-094.65e-08143
GO:00512256EsophagusESCCspindle assembly85/8552117/187232.72e-095.98e-0885
GO:005149520EsophagusESCCpositive regulation of cytoskeleton organization147/8552226/187232.93e-096.38e-08147
GO:0051235110EsophagusESCCmaintenance of location200/8552327/187231.01e-082.02e-07200
GO:00705078EsophagusESCCregulation of microtubule cytoskeleton organization99/8552148/187231.43e-072.29e-0699
GO:000726510EsophagusESCCRas protein signal transduction201/8552337/187231.44e-072.30e-06201
GO:003001018EsophagusESCCestablishment of cell polarity96/8552143/187231.69e-072.67e-0696
GO:190437519EsophagusESCCregulation of protein localization to cell periphery85/8552125/187233.63e-075.06e-0685
GO:190211514EsophagusESCCregulation of organelle assembly116/8552186/187233.15e-063.53e-05116
GO:009022413EsophagusESCCregulation of spindle organization32/855239/187233.27e-063.65e-0532
GO:00618428EsophagusESCCmicrotubule organizing center localization28/855233/187233.80e-064.12e-0528
GO:00900689EsophagusESCCpositive regulation of cell cycle process142/8552236/187234.79e-065.08e-05142
GO:006023614EsophagusESCCregulation of mitotic spindle organization29/855235/187236.61e-066.75e-0529
GO:00516428EsophagusESCCcentrosome localization27/855232/187237.10e-067.12e-0527
Page: 1 2 3 4 5 6 7 8 9 10 11 

check button Enriched KEGG pathways.
Pathway IDTissueDisease StageDescriptionGene RatioBg Ratiopvaluep.adjustqvalueCount
Page: 1 

Top

Cell-cell communication analysis

check buttonIdentification of potential cell-cell interactions between two cell types and their ligand-receptor pairs for different disease states
LigandReceptorLRpairPathwayTissueDisease Stage
Page: 1 

Top

Single-cell gene regulatory network inference analysis

check buttonFind out the significant the regulons (TFs) and the target genes of each regulon across cell types for different disease states
TFCell TypeTissueDisease StageTarget GeneRSSRegulon Activity
∗The dot plots of a searched regulon are shown for all cell subpopulations in each disease state of each tissue based on the regulon specific score inferred using pySCENIC and by calculating the average expression.
Page: 1 

Top

Somatic mutation of malignant transformation related genes

check buttonAnnotation of somatic variants for genes involved in malignant transformation
Hugo SymbolVariant ClassVariant ClassificationdbSNP RSHGVScHGVSpHGVSp ShortSWISSPROTBIOTYPESIFTPolyPhenTumor Sample BarcodeTissueHistologySexAgeStageTherapy TypesDrugsOutcome
GPSM2SNVMissense_Mutationc.1114C>Gp.Gln372Glup.Q372EP81274protein_codingtolerated(0.15)benign(0)TCGA-AC-A23H-01Breastbreast invasive carcinomaFemale>=65I/IIUnknownUnknownPD
GPSM2SNVMissense_Mutationc.1463G>Cp.Gly488Alap.G488AP81274protein_codingtolerated(0.14)benign(0.011)TCGA-AO-A0J3-01Breastbreast invasive carcinomaFemale>=65I/IIChemotherapycyclophosphamideSD
GPSM2SNVMissense_Mutationc.1629C>Ap.Asn543Lysp.N543KP81274protein_codingtolerated(0.49)benign(0.015)TCGA-AR-A0TX-01Breastbreast invasive carcinomaFemale<65I/IIUnknownUnknownSD
GPSM2SNVMissense_Mutationrs867670266c.815N>Tp.Ala272Valp.A272VP81274protein_codingtolerated(0.06)probably_damaging(0.948)TCGA-B6-A0IA-01Breastbreast invasive carcinomaFemale<65I/IIUnknownUnknownSD
GPSM2SNVMissense_Mutationc.1672N>Ap.Arg558Serp.R558SP81274protein_codingdeleterious(0)probably_damaging(1)TCGA-BH-A1FC-01Breastbreast invasive carcinomaFemale>=65I/IIUnknownUnknownSD
GPSM2SNVMissense_Mutationc.1258N>Ap.Glu420Lysp.E420KP81274protein_codingtolerated(0.1)benign(0.08)TCGA-D8-A27G-01Breastbreast invasive carcinomaFemale>=65I/IIUnknownUnknownSD
GPSM2SNVMissense_Mutationc.970N>Ap.Ala324Thrp.A324TP81274protein_codingdeleterious(0.02)benign(0.241)TCGA-E2-A152-01Breastbreast invasive carcinomaFemale<65I/IITargeted Molecular therapytrastuzumabPD
GPSM2SNVMissense_Mutationc.1778C>Ap.Ala593Aspp.A593DP81274protein_codingdeleterious(0.03)benign(0.078)TCGA-E2-A15L-01Breastbreast invasive carcinomaFemale>=65I/IIHormone TherapyarimidexSD
GPSM2SNVMissense_Mutationnovelc.1525T>Cp.Cys509Argp.C509RP81274protein_codingdeleterious(0)possibly_damaging(0.677)TCGA-2W-A8YY-01Cervixcervical & endocervical cancerFemale<65I/IIChemotherapycisplatinCR
GPSM2SNVMissense_Mutationnovelc.1673G>Cp.Arg558Prop.R558PP81274protein_codingdeleterious(0)probably_damaging(1)TCGA-DS-A1OC-01Cervixcervical & endocervical cancerFemale<65I/IIChemotherapygemcitabineSD
Page: 1 2 3 4 5 6 7 8 

Top

Related drugs of malignant transformation related genes

check buttonIdentification of chemicals and drugs interact with genes involved in malignant transfromation
(DGIdb 4.0)
Entrez IDSymbolCategoryInteraction TypesDrug Claim NameDrug NamePMIDs
Page: 1