
|
|||||
|
 | |
| |
| |
| |
| |
| |
|
Gene: GPR68 |
Gene summary for GPR68 |
| Gene information | Species | Human | Gene symbol | GPR68 | Gene ID | 8111 |
| Gene name | G protein-coupled receptor 68 | |
| Gene Alias | AI2A6 | |
| Cytomap | 14q32.11 | |
| Gene Type | protein-coding | GO ID | GO:0001501 | UniProtAcc | A1A5B2 |
Top |
Malignant transformation analysis |
| Identification of the aberrant gene expression in precancerous and cancerous lesions by comparing the gene expression of stem-like cells in diseased tissues with normal stem cells |
| Entrez ID | Symbol | Replicates | Species | Organ | Tissue | Adj P-value | Log2FC | Malignancy |
| 8111 | GPR68 | P11T-E | Human | Esophagus | ESCC | 1.16e-09 | 4.29e-01 | 0.1426 |
| 8111 | GPR68 | P21T-E | Human | Esophagus | ESCC | 3.97e-04 | 1.12e-01 | 0.1617 |
| 8111 | GPR68 | P32T-E | Human | Esophagus | ESCC | 1.88e-04 | 1.57e-01 | 0.1666 |
| 8111 | GPR68 | P37T-E | Human | Esophagus | ESCC | 5.34e-06 | 2.26e-01 | 0.1371 |
| 8111 | GPR68 | P52T-E | Human | Esophagus | ESCC | 9.44e-07 | 1.56e-01 | 0.1555 |
| 8111 | GPR68 | P62T-E | Human | Esophagus | ESCC | 8.23e-07 | 2.18e-01 | 0.1302 |
| 8111 | GPR68 | P89T-E | Human | Esophagus | ESCC | 9.70e-15 | 8.95e-01 | 0.1752 |
| 8111 | GPR68 | P91T-E | Human | Esophagus | ESCC | 3.88e-10 | 8.25e-01 | 0.1828 |
| 8111 | GPR68 | P130T-E | Human | Esophagus | ESCC | 1.78e-03 | 9.33e-02 | 0.1676 |
| 8111 | GPR68 | C04 | Human | Oral cavity | OSCC | 2.16e-06 | 4.55e-01 | 0.2633 |
| 8111 | GPR68 | C21 | Human | Oral cavity | OSCC | 1.33e-20 | 6.33e-01 | 0.2678 |
| 8111 | GPR68 | C30 | Human | Oral cavity | OSCC | 1.18e-37 | 1.87e+00 | 0.3055 |
| 8111 | GPR68 | C43 | Human | Oral cavity | OSCC | 1.19e-07 | 2.51e-01 | 0.1704 |
| 8111 | GPR68 | C51 | Human | Oral cavity | OSCC | 7.11e-08 | 4.95e-01 | 0.2674 |
| 8111 | GPR68 | C06 | Human | Oral cavity | OSCC | 5.57e-12 | 1.39e+00 | 0.2699 |
| 8111 | GPR68 | LP15 | Human | Oral cavity | LP | 3.77e-04 | 9.30e-01 | 0.2174 |
| Page: 1 |
| Tissue | Expression Dynamics | Abbreviation |
| Esophagus | 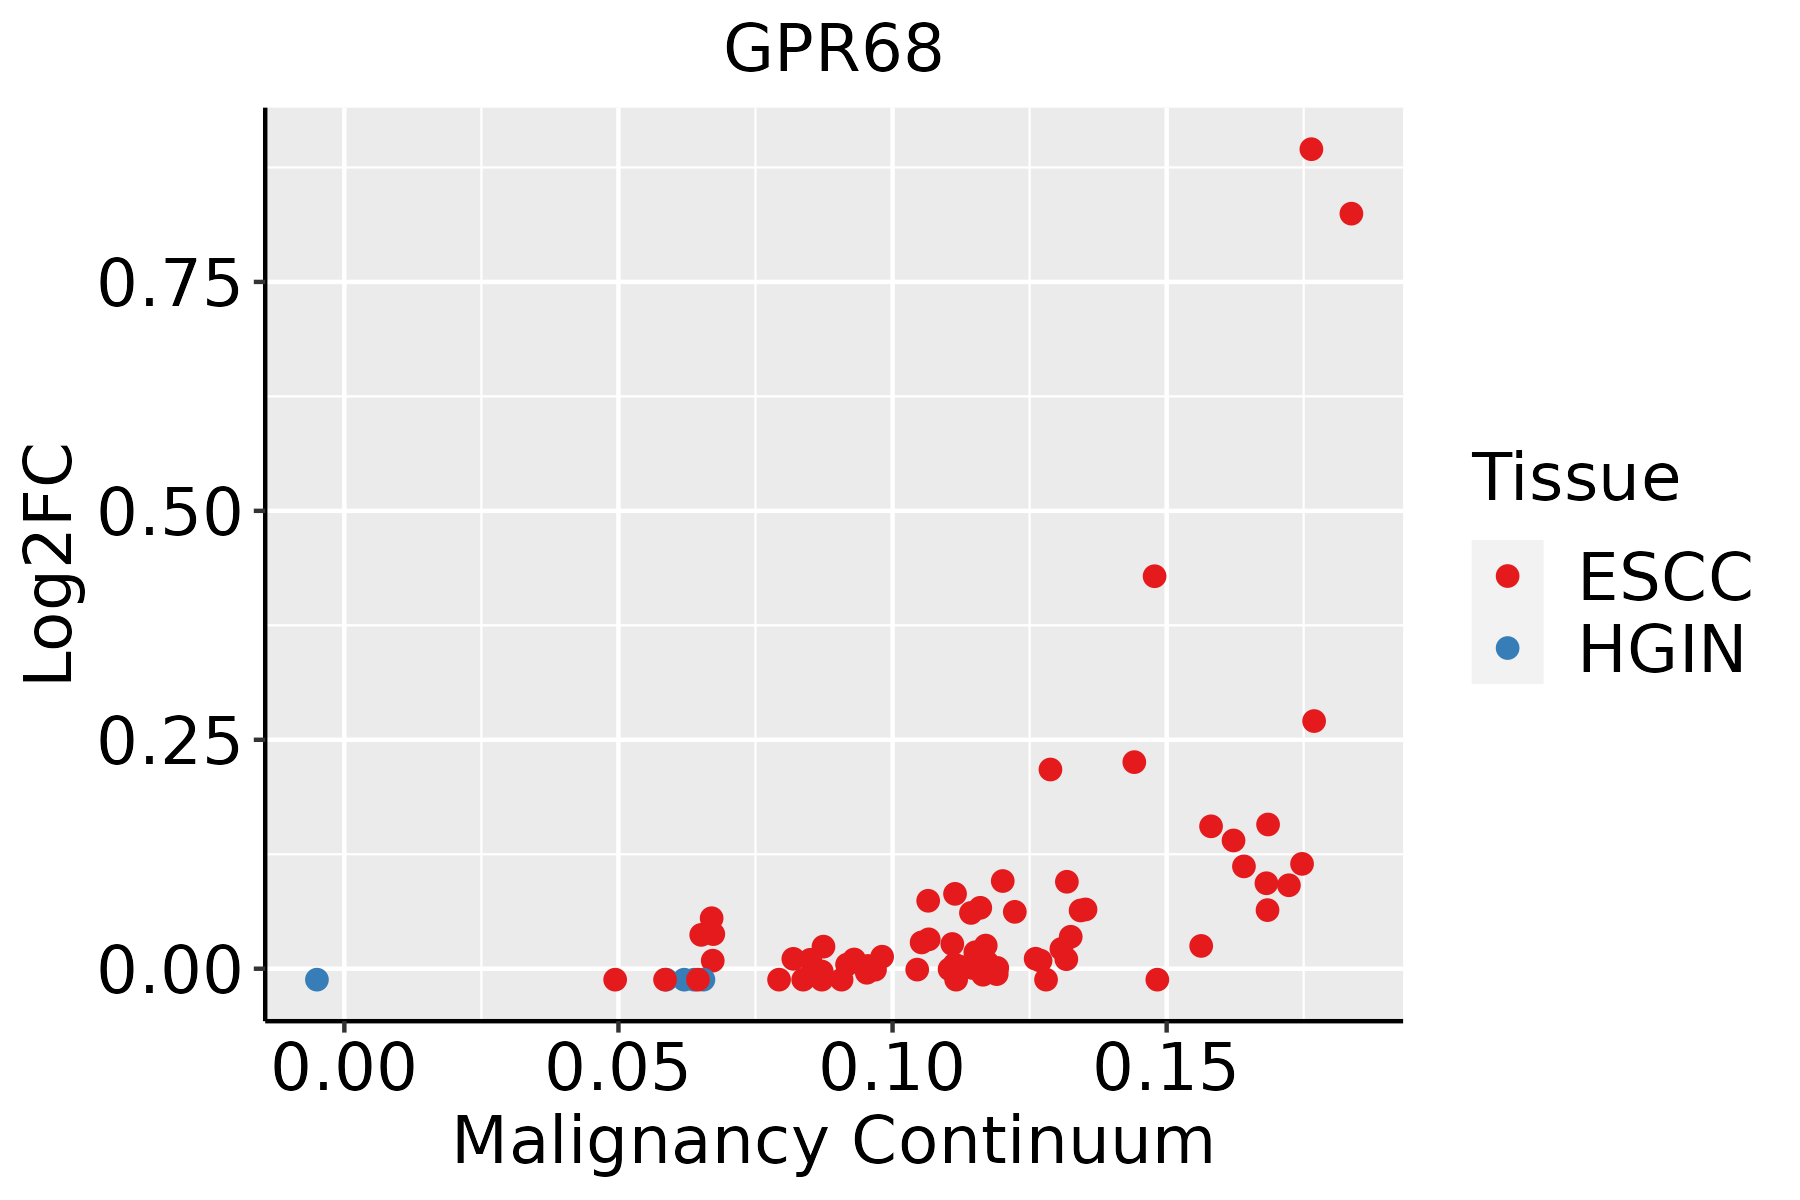 | ESCC: Esophageal squamous cell carcinoma |
| HGIN: High-grade intraepithelial neoplasias | ||
| LGIN: Low-grade intraepithelial neoplasias | ||
| Oral Cavity |  | EOLP: Erosive Oral lichen planus |
| LP: leukoplakia | ||
| NEOLP: Non-erosive oral lichen planus | ||
| OSCC: Oral squamous cell carcinoma |
| ∗log2FC in expression of this searched gene in stem-like cells from each diseased tissue sample relative to stem-like cells in normal samples in each tissue plotted against the malignancy continuum. Samples are colored based on if they are from different disease stage. |
Top |
Malignant transformation related pathway analysis |
| Find out the enriched GO biological processes and KEGG pathways involved in transition from healthy to precancer to cancer |
| Tissue | Disease Stage | Enriched GO biological Processes |
| Colorectum | AD |  |
| Colorectum | SER |  |
| Colorectum | MSS |  |
| Colorectum | MSI-H |  |
| Colorectum | FAP |  |
| ∗Top 15 enriched GO BP terms are showed in the bar plot of each disease state in each tissue. Each row represents a significant GO biological process which is colored according to the -log10(p.adjust). |
| Page: 1 2 3 4 5 6 7 8 9 |
| GO ID | Tissue | Disease Stage | Description | Gene Ratio | Bg Ratio | pvalue | p.adjust | Count |
| GO:007169210 | Esophagus | ESCC | protein localization to extracellular region | 193/8552 | 368/18723 | 5.01e-03 | 1.92e-02 | 193 |
| GO:000276115 | Esophagus | ESCC | regulation of myeloid leukocyte differentiation | 69/8552 | 120/18723 | 6.00e-03 | 2.21e-02 | 69 |
| GO:0009743111 | Esophagus | ESCC | response to carbohydrate | 135/8552 | 253/18723 | 8.16e-03 | 2.89e-02 | 135 |
| GO:005070810 | Esophagus | ESCC | regulation of protein secretion | 142/8552 | 268/18723 | 9.31e-03 | 3.24e-02 | 142 |
| GO:005071416 | Esophagus | ESCC | positive regulation of protein secretion | 76/8552 | 137/18723 | 1.32e-02 | 4.31e-02 | 76 |
| GO:00303165 | Esophagus | ESCC | osteoclast differentiation | 54/8552 | 94/18723 | 1.43e-02 | 4.65e-02 | 54 |
| GO:190495119 | Oral cavity | OSCC | positive regulation of establishment of protein localization | 196/7305 | 319/18723 | 2.89e-16 | 2.20e-14 | 196 |
| GO:005122219 | Oral cavity | OSCC | positive regulation of protein transport | 187/7305 | 303/18723 | 7.37e-16 | 5.49e-14 | 187 |
| GO:003009920 | Oral cavity | OSCC | myeloid cell differentiation | 213/7305 | 381/18723 | 1.24e-11 | 4.42e-10 | 213 |
| GO:007121416 | Oral cavity | OSCC | cellular response to abiotic stimulus | 186/7305 | 331/18723 | 1.38e-10 | 4.10e-09 | 186 |
| GO:010400416 | Oral cavity | OSCC | cellular response to environmental stimulus | 186/7305 | 331/18723 | 1.38e-10 | 4.10e-09 | 186 |
| GO:000257310 | Oral cavity | OSCC | myeloid leukocyte differentiation | 119/7305 | 208/18723 | 7.29e-08 | 1.29e-06 | 119 |
| GO:00107209 | Oral cavity | OSCC | positive regulation of cell development | 159/7305 | 298/18723 | 3.06e-07 | 4.66e-06 | 159 |
| GO:19031316 | Oral cavity | OSCC | mononuclear cell differentiation | 210/7305 | 426/18723 | 8.44e-06 | 9.02e-05 | 210 |
| GO:190370618 | Oral cavity | OSCC | regulation of hemopoiesis | 180/7305 | 367/18723 | 5.16e-05 | 4.30e-04 | 180 |
| GO:000974320 | Oral cavity | OSCC | response to carbohydrate | 128/7305 | 253/18723 | 1.11e-04 | 8.16e-04 | 128 |
| GO:003428420 | Oral cavity | OSCC | response to monosaccharide | 114/7305 | 225/18723 | 2.37e-04 | 1.54e-03 | 114 |
| GO:000268310 | Oral cavity | OSCC | negative regulation of immune system process | 204/7305 | 434/18723 | 3.72e-04 | 2.27e-03 | 204 |
| GO:004563720 | Oral cavity | OSCC | regulation of myeloid cell differentiation | 106/7305 | 210/18723 | 4.58e-04 | 2.76e-03 | 106 |
| GO:19021059 | Oral cavity | OSCC | regulation of leukocyte differentiation | 136/7305 | 279/18723 | 5.53e-04 | 3.21e-03 | 136 |
| Page: 1 2 3 4 |
| Pathway ID | Tissue | Disease Stage | Description | Gene Ratio | Bg Ratio | pvalue | p.adjust | qvalue | Count |
| Page: 1 |
Top |
Cell-cell communication analysis |
| Identification of potential cell-cell interactions between two cell types and their ligand-receptor pairs for different disease states |
| Ligand | Receptor | LRpair | Pathway | Tissue | Disease Stage |
| Page: 1 |
Top |
Single-cell gene regulatory network inference analysis |
| Find out the significant the regulons (TFs) and the target genes of each regulon across cell types for different disease states |
| TF | Cell Type | Tissue | Disease Stage | Target Gene | RSS | Regulon Activity |
| ∗The dot plots of a searched regulon are shown for all cell subpopulations in each disease state of each tissue based on the regulon specific score inferred using pySCENIC and by calculating the average expression. |
| Page: 1 |
Top |
Somatic mutation of malignant transformation related genes |
| Annotation of somatic variants for genes involved in malignant transformation |
| Hugo Symbol | Variant Class | Variant Classification | dbSNP RS | HGVSc | HGVSp | HGVSp Short | SWISSPROT | BIOTYPE | SIFT | PolyPhen | Tumor Sample Barcode | Tissue | Histology | Sex | Age | Stage | Therapy Types | Drugs | Outcome |
| GPR68 | SNV | Missense_Mutation | novel | c.904N>A | p.Gly302Arg | p.G302R | Q15743 | protein_coding | tolerated(0.75) | benign(0.003) | TCGA-2W-A8YY-01 | Cervix | cervical & endocervical cancer | Female | <65 | I/II | Chemotherapy | cisplatin | CR |
| GPR68 | SNV | Missense_Mutation | novel | c.110N>T | p.Pro37Leu | p.P37L | Q15743 | protein_coding | deleterious(0) | probably_damaging(1) | TCGA-DS-A7WH-01 | Cervix | cervical & endocervical cancer | Female | <65 | I/II | Chemotherapy | cisplatin | CR |
| GPR68 | SNV | Missense_Mutation | novel | c.157N>T | p.Arg53Trp | p.R53W | Q15743 | protein_coding | deleterious(0) | probably_damaging(0.958) | TCGA-AA-A010-01 | Colorectum | colon adenocarcinoma | Female | <65 | I/II | Chemotherapy | folinic | CR |
| GPR68 | SNV | Missense_Mutation | c.191C>T | p.Thr64Met | p.T64M | Q15743 | protein_coding | deleterious(0) | probably_damaging(0.997) | TCGA-AY-A54L-01 | Colorectum | colon adenocarcinoma | Female | >=65 | I/II | Unknown | Unknown | PD | |
| GPR68 | SNV | Missense_Mutation | c.896G>A | p.Arg299His | p.R299H | Q15743 | protein_coding | deleterious(0.03) | probably_damaging(0.935) | TCGA-AZ-6601-01 | Colorectum | colon adenocarcinoma | Male | >=65 | I/II | Unknown | Unknown | PD | |
| GPR68 | SNV | Missense_Mutation | rs149975079 | c.547N>T | p.Arg183Cys | p.R183C | Q15743 | protein_coding | tolerated(0.14) | probably_damaging(0.947) | TCGA-CK-4950-01 | Colorectum | colon adenocarcinoma | Female | >=65 | III/IV | Chemotherapy | folfox | SD |
| GPR68 | SNV | Missense_Mutation | c.664C>T | p.Arg222Cys | p.R222C | Q15743 | protein_coding | deleterious(0) | probably_damaging(0.947) | TCGA-CM-6171-01 | Colorectum | colon adenocarcinoma | Female | >=65 | I/II | Unknown | Unknown | SD | |
| GPR68 | SNV | Missense_Mutation | c.1039N>A | p.Ala347Thr | p.A347T | Q15743 | protein_coding | tolerated_low_confidence(0.45) | benign(0) | TCGA-D5-6930-01 | Colorectum | colon adenocarcinoma | Male | >=65 | I/II | Unknown | Unknown | SD | |
| GPR68 | SNV | Missense_Mutation | novel | c.415G>A | p.Val139Ile | p.V139I | Q15743 | protein_coding | tolerated(0.23) | benign(0.035) | TCGA-A5-A0G1-01 | Endometrium | uterine corpus endometrioid carcinoma | Female | >=65 | I/II | Unknown | Unknown | SD |
| GPR68 | SNV | Missense_Mutation | novel | c.238N>C | p.Tyr80His | p.Y80H | Q15743 | protein_coding | deleterious(0) | probably_damaging(0.999) | TCGA-AP-A05O-01 | Endometrium | uterine corpus endometrioid carcinoma | Female | >=65 | I/II | Chemotherapy | carboplatin | PD |
| Page: 1 2 3 4 |
Top |
Related drugs of malignant transformation related genes |
| Identification of chemicals and drugs interact with genes involved in malignant transfromation |
| (DGIdb 4.0) |
| Entrez ID | Symbol | Category | Interaction Types | Drug Claim Name | Drug Name | PMIDs |
| 8111 | GPR68 | G PROTEIN COUPLED RECEPTOR, DRUGGABLE GENOME | agonist | 404859017 | ||
| 8111 | GPR68 | G PROTEIN COUPLED RECEPTOR, DRUGGABLE GENOME | allosteric modulator | 178102508 | LORAZEPAM | |
| 8111 | GPR68 | G PROTEIN COUPLED RECEPTOR, DRUGGABLE GENOME | agonist | 404859018 | ||
| 8111 | GPR68 | G PROTEIN COUPLED RECEPTOR, DRUGGABLE GENOME | agonist | 404859019 | ||
| 8111 | GPR68 | G PROTEIN COUPLED RECEPTOR, DRUGGABLE GENOME | allosteric modulator | 374883820 | ||
| 8111 | GPR68 | G PROTEIN COUPLED RECEPTOR, DRUGGABLE GENOME | allosteric modulator | 385612200 |
| Page: 1 |

Copyright 2023-Present -The University of Texas Health Science Center at Houston |