
|
|||||
|
 | |
| |
| |
| |
| |
| |
|
Gene: GPR137 |
Gene summary for GPR137 |
| Gene information | Species | Human | Gene symbol | GPR137 | Gene ID | 56834 |
| Gene name | G protein-coupled receptor 137 | |
| Gene Alias | C11orf4 | |
| Cytomap | 11q13.1 | |
| Gene Type | protein-coding | GO ID | GO:0001894 | UniProtAcc | Q96N19 |
Top |
Malignant transformation analysis |
| Identification of the aberrant gene expression in precancerous and cancerous lesions by comparing the gene expression of stem-like cells in diseased tissues with normal stem cells |
| Entrez ID | Symbol | Replicates | Species | Organ | Tissue | Adj P-value | Log2FC | Malignancy |
| 56834 | GPR137 | LZE7T | Human | Esophagus | ESCC | 8.16e-05 | 3.41e-01 | 0.0667 |
| 56834 | GPR137 | LZE8T | Human | Esophagus | ESCC | 1.29e-03 | 1.52e-01 | 0.067 |
| 56834 | GPR137 | LZE22T | Human | Esophagus | ESCC | 8.72e-04 | 3.10e-01 | 0.068 |
| 56834 | GPR137 | LZE24T | Human | Esophagus | ESCC | 2.02e-25 | 5.77e-01 | 0.0596 |
| 56834 | GPR137 | LZE22D3 | Human | Esophagus | HGIN | 3.83e-04 | 4.89e-01 | 0.0653 |
| 56834 | GPR137 | LZE21T | Human | Esophagus | ESCC | 2.20e-04 | 2.28e-01 | 0.0655 |
| 56834 | GPR137 | LZE6T | Human | Esophagus | ESCC | 7.63e-03 | 2.25e-01 | 0.0845 |
| 56834 | GPR137 | P1T-E | Human | Esophagus | ESCC | 1.37e-15 | 4.84e-01 | 0.0875 |
| 56834 | GPR137 | P2T-E | Human | Esophagus | ESCC | 1.14e-35 | 5.84e-01 | 0.1177 |
| 56834 | GPR137 | P4T-E | Human | Esophagus | ESCC | 4.92e-28 | 4.98e-01 | 0.1323 |
| 56834 | GPR137 | P5T-E | Human | Esophagus | ESCC | 9.15e-13 | 2.20e-01 | 0.1327 |
| 56834 | GPR137 | P8T-E | Human | Esophagus | ESCC | 3.99e-19 | 3.35e-01 | 0.0889 |
| 56834 | GPR137 | P9T-E | Human | Esophagus | ESCC | 7.38e-13 | 3.00e-01 | 0.1131 |
| 56834 | GPR137 | P10T-E | Human | Esophagus | ESCC | 2.40e-18 | 2.82e-01 | 0.116 |
| 56834 | GPR137 | P11T-E | Human | Esophagus | ESCC | 5.39e-09 | 3.50e-01 | 0.1426 |
| 56834 | GPR137 | P12T-E | Human | Esophagus | ESCC | 7.72e-23 | 3.83e-01 | 0.1122 |
| 56834 | GPR137 | P15T-E | Human | Esophagus | ESCC | 1.22e-05 | 1.55e-01 | 0.1149 |
| 56834 | GPR137 | P16T-E | Human | Esophagus | ESCC | 1.51e-17 | 2.90e-01 | 0.1153 |
| 56834 | GPR137 | P17T-E | Human | Esophagus | ESCC | 6.01e-08 | 2.74e-01 | 0.1278 |
| 56834 | GPR137 | P19T-E | Human | Esophagus | ESCC | 1.08e-09 | 5.19e-01 | 0.1662 |
| Page: 1 2 3 4 5 |
| Tissue | Expression Dynamics | Abbreviation |
| Esophagus | 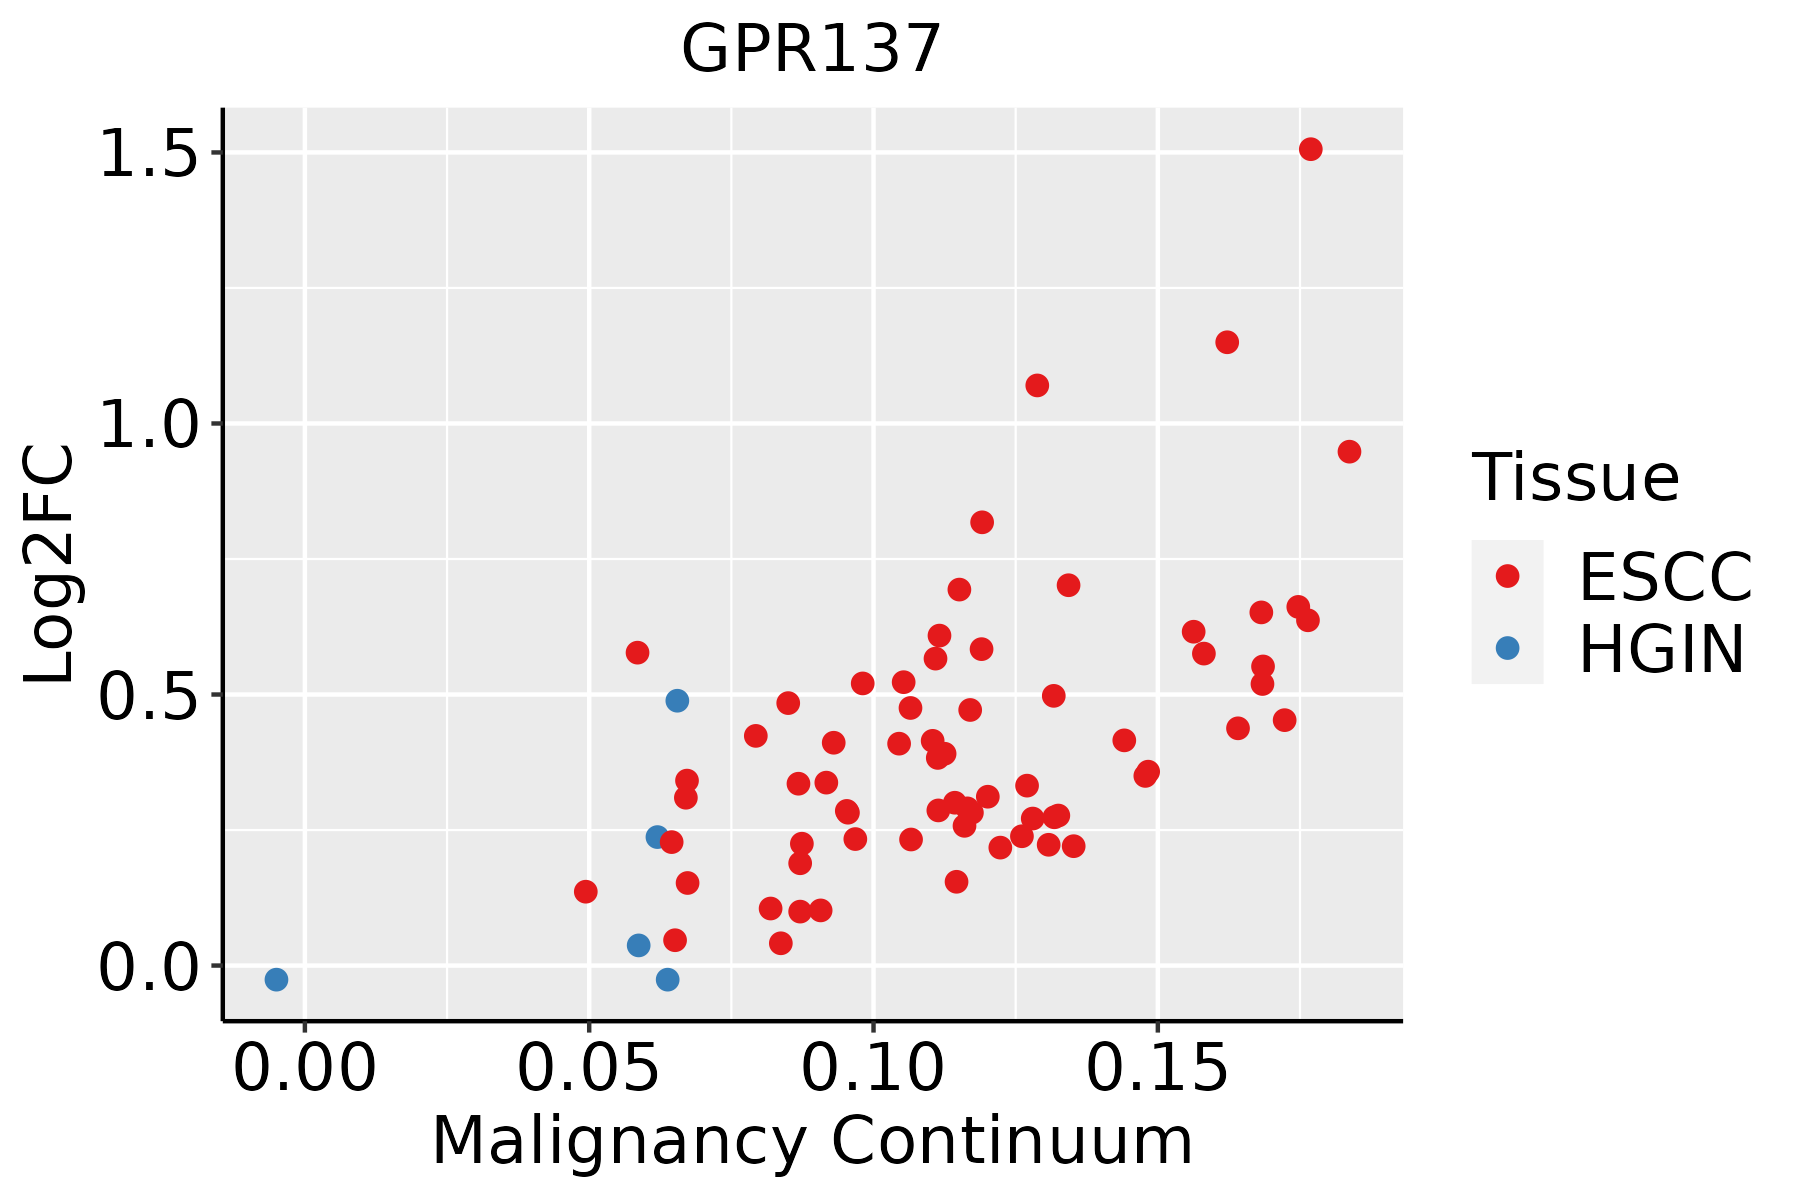 | ESCC: Esophageal squamous cell carcinoma |
| HGIN: High-grade intraepithelial neoplasias | ||
| LGIN: Low-grade intraepithelial neoplasias | ||
| Liver | 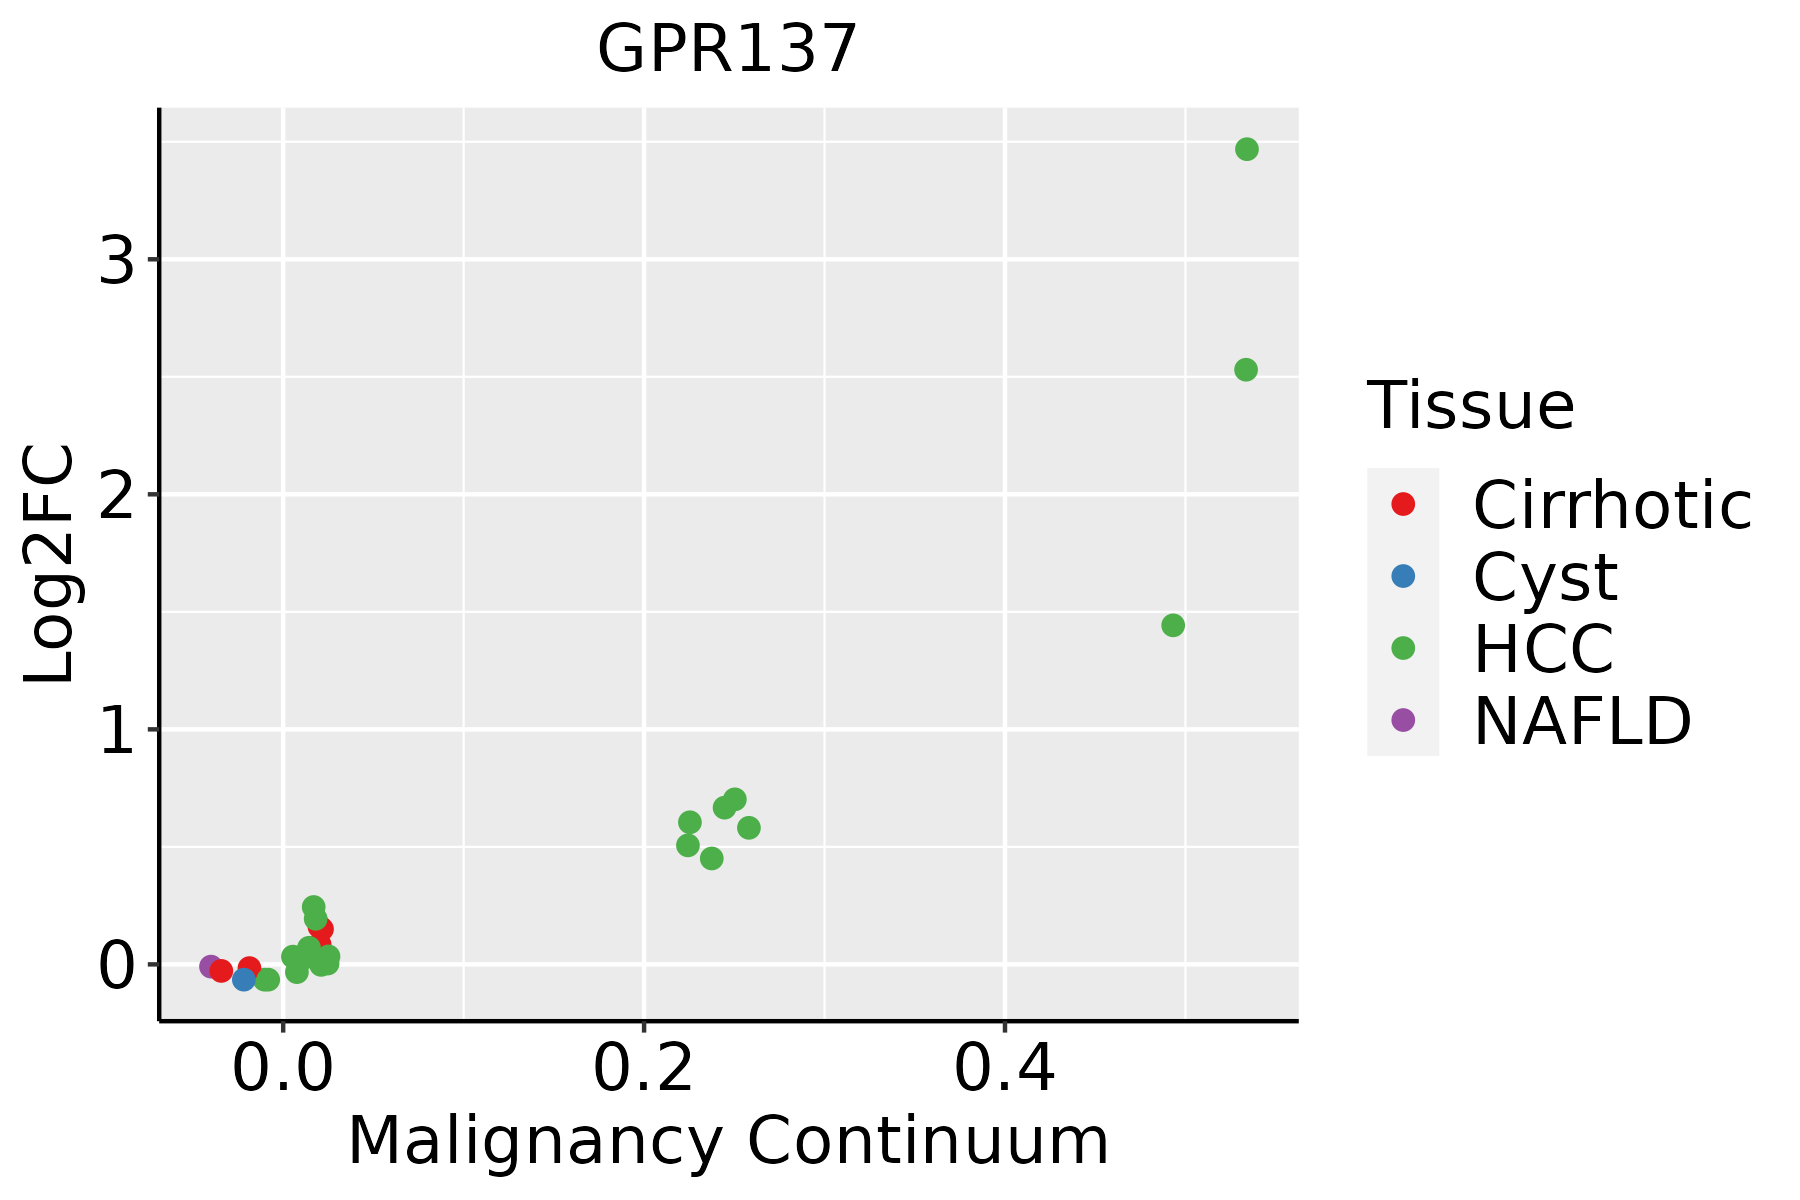 | HCC: Hepatocellular carcinoma |
| NAFLD: Non-alcoholic fatty liver disease | ||
| Oral Cavity |  | EOLP: Erosive Oral lichen planus |
| LP: leukoplakia | ||
| NEOLP: Non-erosive oral lichen planus | ||
| OSCC: Oral squamous cell carcinoma |
| ∗log2FC in expression of this searched gene in stem-like cells from each diseased tissue sample relative to stem-like cells in normal samples in each tissue plotted against the malignancy continuum. Samples are colored based on if they are from different disease stage. |
Top |
Malignant transformation related pathway analysis |
| Find out the enriched GO biological processes and KEGG pathways involved in transition from healthy to precancer to cancer |
| Tissue | Disease Stage | Enriched GO biological Processes |
| Colorectum | AD |  |
| Colorectum | SER |  |
| Colorectum | MSS |  |
| Colorectum | MSI-H |  |
| Colorectum | FAP |  |
| ∗Top 15 enriched GO BP terms are showed in the bar plot of each disease state in each tissue. Each row represents a significant GO biological process which is colored according to the -log10(p.adjust). |
| Page: 1 2 3 4 5 6 7 8 9 |
| GO ID | Tissue | Disease Stage | Description | Gene Ratio | Bg Ratio | pvalue | p.adjust | Count |
| GO:000276115 | Esophagus | ESCC | regulation of myeloid leukocyte differentiation | 69/8552 | 120/18723 | 6.00e-03 | 2.21e-02 | 69 |
| GO:00303165 | Esophagus | ESCC | osteoclast differentiation | 54/8552 | 94/18723 | 1.43e-02 | 4.65e-02 | 54 |
| GO:001050611 | Liver | Cirrhotic | regulation of autophagy | 132/4634 | 317/18723 | 2.17e-11 | 1.33e-09 | 132 |
| GO:003009912 | Liver | Cirrhotic | myeloid cell differentiation | 135/4634 | 381/18723 | 1.69e-06 | 3.22e-05 | 135 |
| GO:00025735 | Liver | Cirrhotic | myeloid leukocyte differentiation | 70/4634 | 208/18723 | 2.34e-03 | 1.42e-02 | 70 |
| GO:00487711 | Liver | Cirrhotic | tissue remodeling | 60/4634 | 175/18723 | 2.86e-03 | 1.65e-02 | 60 |
| GO:00319292 | Liver | Cirrhotic | TOR signaling | 44/4634 | 126/18723 | 6.69e-03 | 3.30e-02 | 44 |
| GO:00456377 | Liver | Cirrhotic | regulation of myeloid cell differentiation | 68/4634 | 210/18723 | 7.40e-03 | 3.53e-02 | 68 |
| GO:190382922 | Liver | HCC | positive regulation of cellular protein localization | 199/7958 | 276/18723 | 1.15e-23 | 2.62e-21 | 199 |
| GO:001050621 | Liver | HCC | regulation of autophagy | 210/7958 | 317/18723 | 7.59e-18 | 8.45e-16 | 210 |
| GO:007266521 | Liver | HCC | protein localization to vacuole | 48/7958 | 67/18723 | 1.27e-06 | 1.85e-05 | 48 |
| GO:00319291 | Liver | HCC | TOR signaling | 78/7958 | 126/18723 | 8.49e-06 | 9.97e-05 | 78 |
| GO:003009922 | Liver | HCC | myeloid cell differentiation | 200/7958 | 381/18723 | 4.64e-05 | 4.49e-04 | 200 |
| GO:00614621 | Liver | HCC | protein localization to lysosome | 33/7958 | 46/18723 | 5.63e-05 | 5.26e-04 | 33 |
| GO:0032006 | Liver | HCC | regulation of TOR signaling | 63/7958 | 104/18723 | 1.50e-04 | 1.20e-03 | 63 |
| GO:0032008 | Liver | HCC | positive regulation of TOR signaling | 31/7958 | 47/18723 | 9.90e-04 | 5.71e-03 | 31 |
| GO:1904263 | Liver | HCC | positive regulation of TORC1 signaling | 14/7958 | 20/18723 | 1.21e-02 | 4.41e-02 | 14 |
| GO:190382920 | Oral cavity | OSCC | positive regulation of cellular protein localization | 179/7305 | 276/18723 | 2.20e-18 | 2.41e-16 | 179 |
| GO:001050610 | Oral cavity | OSCC | regulation of autophagy | 198/7305 | 317/18723 | 1.63e-17 | 1.51e-15 | 198 |
| GO:003009920 | Oral cavity | OSCC | myeloid cell differentiation | 213/7305 | 381/18723 | 1.24e-11 | 4.42e-10 | 213 |
| Page: 1 2 3 4 |
| Pathway ID | Tissue | Disease Stage | Description | Gene Ratio | Bg Ratio | pvalue | p.adjust | qvalue | Count |
| Page: 1 |
Top |
Cell-cell communication analysis |
| Identification of potential cell-cell interactions between two cell types and their ligand-receptor pairs for different disease states |
| Ligand | Receptor | LRpair | Pathway | Tissue | Disease Stage |
| Page: 1 |
Top |
Single-cell gene regulatory network inference analysis |
| Find out the significant the regulons (TFs) and the target genes of each regulon across cell types for different disease states |
| TF | Cell Type | Tissue | Disease Stage | Target Gene | RSS | Regulon Activity |
| ∗The dot plots of a searched regulon are shown for all cell subpopulations in each disease state of each tissue based on the regulon specific score inferred using pySCENIC and by calculating the average expression. |
| Page: 1 |
Top |
Somatic mutation of malignant transformation related genes |
| Annotation of somatic variants for genes involved in malignant transformation |
| Hugo Symbol | Variant Class | Variant Classification | dbSNP RS | HGVSc | HGVSp | HGVSp Short | SWISSPROT | BIOTYPE | SIFT | PolyPhen | Tumor Sample Barcode | Tissue | Histology | Sex | Age | Stage | Therapy Types | Drugs | Outcome |
| GPR137 | SNV | Missense_Mutation | c.364N>C | p.Ala122Pro | p.A122P | Q96N19 | protein_coding | deleterious(0.03) | benign(0.057) | TCGA-EW-A1OV-01 | Breast | breast invasive carcinoma | Female | <65 | I/II | Chemotherapy | epirubicin | SD | |
| GPR137 | SNV | Missense_Mutation | rs754996541 | c.614N>T | p.Ser205Leu | p.S205L | Q96N19 | protein_coding | deleterious(0.04) | probably_damaging(0.992) | TCGA-C5-A1MF-01 | Cervix | cervical & endocervical cancer | Female | <65 | I/II | Unknown | Unknown | SD |
| GPR137 | SNV | Missense_Mutation | rs141699719 | c.763G>A | p.Val255Ile | p.V255I | Q96N19 | protein_coding | tolerated(0.8) | benign(0.127) | TCGA-MY-A5BE-01 | Cervix | cervical & endocervical cancer | Female | <65 | I/II | Unknown | Unknown | SD |
| GPR137 | SNV | Missense_Mutation | c.928G>A | p.Asp310Asn | p.D310N | Q96N19 | protein_coding | tolerated(0.46) | benign(0.364) | TCGA-A6-6141-01 | Colorectum | colon adenocarcinoma | Male | <65 | I/II | Chemotherapy | 5-fu | SD | |
| GPR137 | SNV | Missense_Mutation | novel | c.514N>C | p.Asn172His | p.N172H | Q96N19 | protein_coding | deleterious(0) | probably_damaging(0.999) | TCGA-CA-6717-01 | Colorectum | colon adenocarcinoma | Male | <65 | I/II | Chemotherapy | oxaliplatin | CR |
| GPR137 | SNV | Missense_Mutation | c.391N>T | p.Arg131Cys | p.R131C | Q96N19 | protein_coding | deleterious(0) | probably_damaging(0.997) | TCGA-CK-5916-01 | Colorectum | colon adenocarcinoma | Female | >=65 | I/II | Unknown | Unknown | PD | |
| GPR137 | SNV | Missense_Mutation | rs761684438 | c.1382N>T | p.Pro461Leu | p.P461L | Q96N19 | protein_coding | deleterious_low_confidence(0) | benign(0) | TCGA-CM-5348-01 | Colorectum | colon adenocarcinoma | Male | >=65 | III/IV | Unknown | Unknown | SD |
| GPR137 | SNV | Missense_Mutation | c.647N>T | p.Ala216Val | p.A216V | Q96N19 | protein_coding | deleterious(0.04) | probably_damaging(0.917) | TCGA-G4-6302-01 | Colorectum | colon adenocarcinoma | Female | >=65 | I/II | Unknown | Unknown | SD | |
| GPR137 | SNV | Missense_Mutation | novel | c.949T>C | p.Ser317Pro | p.S317P | Q96N19 | protein_coding | deleterious(0) | probably_damaging(0.998) | TCGA-F5-6814-01 | Colorectum | rectum adenocarcinoma | Male | <65 | I/II | Unknown | Unknown | SD |
| GPR137 | SNV | Missense_Mutation | rs778003446 | c.1255N>T | p.Arg419Cys | p.R419C | Q96N19 | protein_coding | deleterious_low_confidence(0.01) | benign(0.005) | TCGA-F5-6864-01 | Colorectum | rectum adenocarcinoma | Female | >=65 | III/IV | Chemotherapy | 5-fluorouracil | CR |
| Page: 1 2 3 4 |
Top |
Related drugs of malignant transformation related genes |
| Identification of chemicals and drugs interact with genes involved in malignant transfromation |
| (DGIdb 4.0) |
| Entrez ID | Symbol | Category | Interaction Types | Drug Claim Name | Drug Name | PMIDs |
| Page: 1 |

Copyright 2023-Present -The University of Texas Health Science Center at Houston |