
|
|||||
|
 | |
| |
| |
| |
| |
| |
|
Gene: GPC4 |
Gene summary for GPC4 |
| Gene information | Species | Human | Gene symbol | GPC4 | Gene ID | 2239 |
| Gene name | glypican 4 | |
| Gene Alias | K-glypican | |
| Cytomap | Xq26.2 | |
| Gene Type | protein-coding | GO ID | GO:0001736 | UniProtAcc | O75487 |
Top |
Malignant transformation analysis |
| Identification of the aberrant gene expression in precancerous and cancerous lesions by comparing the gene expression of stem-like cells in diseased tissues with normal stem cells |
| Entrez ID | Symbol | Replicates | Species | Organ | Tissue | Adj P-value | Log2FC | Malignancy |
| 2239 | GPC4 | LZE7T | Human | Esophagus | ESCC | 3.28e-02 | 3.18e-01 | 0.0667 |
| 2239 | GPC4 | LZE24T | Human | Esophagus | ESCC | 1.89e-11 | 3.78e-01 | 0.0596 |
| 2239 | GPC4 | P2T-E | Human | Esophagus | ESCC | 7.16e-25 | 5.93e-01 | 0.1177 |
| 2239 | GPC4 | P4T-E | Human | Esophagus | ESCC | 6.24e-11 | 3.38e-01 | 0.1323 |
| 2239 | GPC4 | P5T-E | Human | Esophagus | ESCC | 1.16e-09 | 6.81e-02 | 0.1327 |
| 2239 | GPC4 | P8T-E | Human | Esophagus | ESCC | 2.02e-09 | 3.56e-01 | 0.0889 |
| 2239 | GPC4 | P10T-E | Human | Esophagus | ESCC | 1.14e-94 | 2.31e+00 | 0.116 |
| 2239 | GPC4 | P12T-E | Human | Esophagus | ESCC | 5.92e-40 | 9.57e-01 | 0.1122 |
| 2239 | GPC4 | P15T-E | Human | Esophagus | ESCC | 5.18e-15 | 4.59e-01 | 0.1149 |
| 2239 | GPC4 | P16T-E | Human | Esophagus | ESCC | 5.62e-13 | 2.02e-01 | 0.1153 |
| 2239 | GPC4 | P20T-E | Human | Esophagus | ESCC | 1.37e-06 | 1.54e-01 | 0.1124 |
| 2239 | GPC4 | P22T-E | Human | Esophagus | ESCC | 8.34e-17 | 3.19e-01 | 0.1236 |
| 2239 | GPC4 | P23T-E | Human | Esophagus | ESCC | 1.32e-14 | 3.14e-01 | 0.108 |
| 2239 | GPC4 | P24T-E | Human | Esophagus | ESCC | 3.99e-08 | 2.33e-01 | 0.1287 |
| 2239 | GPC4 | P26T-E | Human | Esophagus | ESCC | 5.01e-49 | 1.03e+00 | 0.1276 |
| 2239 | GPC4 | P27T-E | Human | Esophagus | ESCC | 3.23e-14 | 3.16e-01 | 0.1055 |
| 2239 | GPC4 | P28T-E | Human | Esophagus | ESCC | 1.72e-02 | 8.33e-02 | 0.1149 |
| 2239 | GPC4 | P31T-E | Human | Esophagus | ESCC | 7.04e-23 | 5.12e-01 | 0.1251 |
| 2239 | GPC4 | P32T-E | Human | Esophagus | ESCC | 8.58e-09 | 2.83e-01 | 0.1666 |
| 2239 | GPC4 | P36T-E | Human | Esophagus | ESCC | 1.89e-12 | 6.68e-01 | 0.1187 |
| Page: 1 2 3 |
| Tissue | Expression Dynamics | Abbreviation |
| Esophagus | 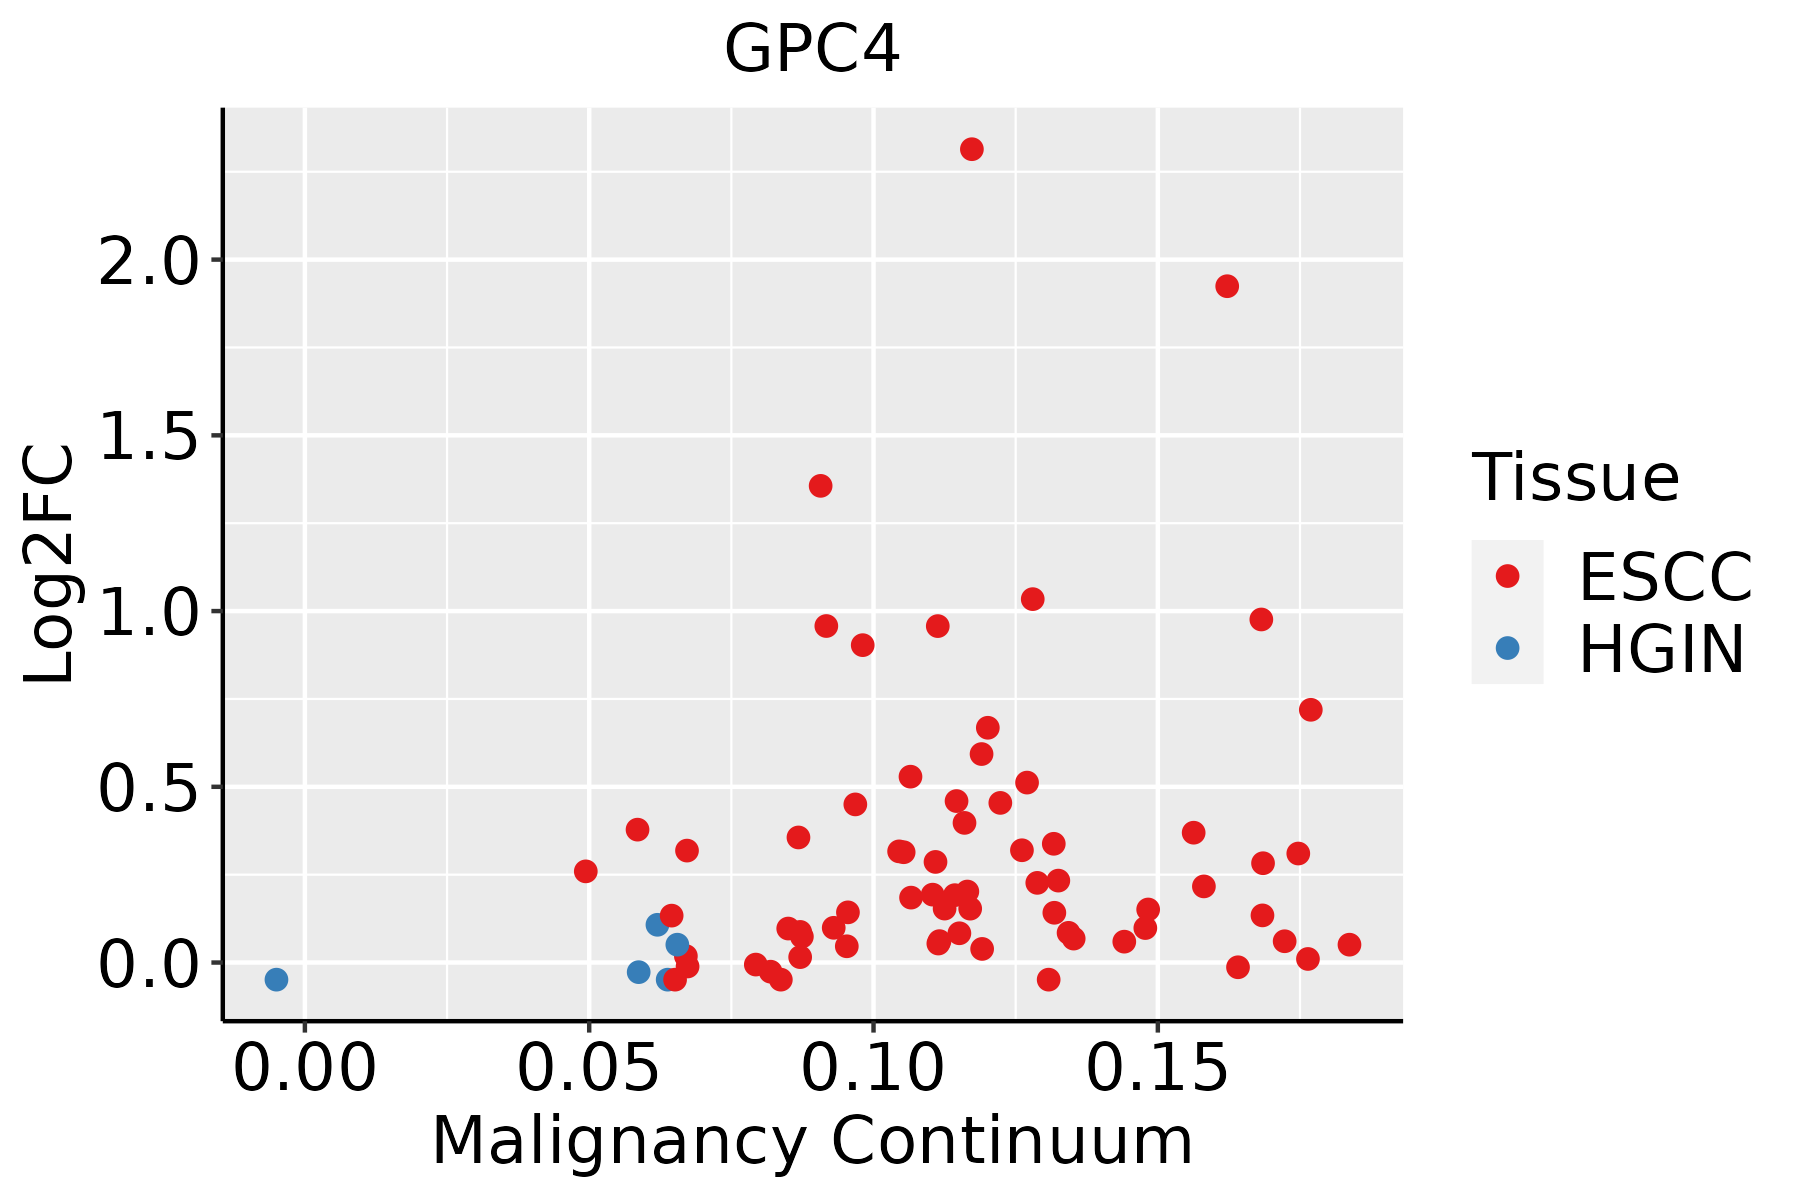 | ESCC: Esophageal squamous cell carcinoma |
| HGIN: High-grade intraepithelial neoplasias | ||
| LGIN: Low-grade intraepithelial neoplasias | ||
| Lung | 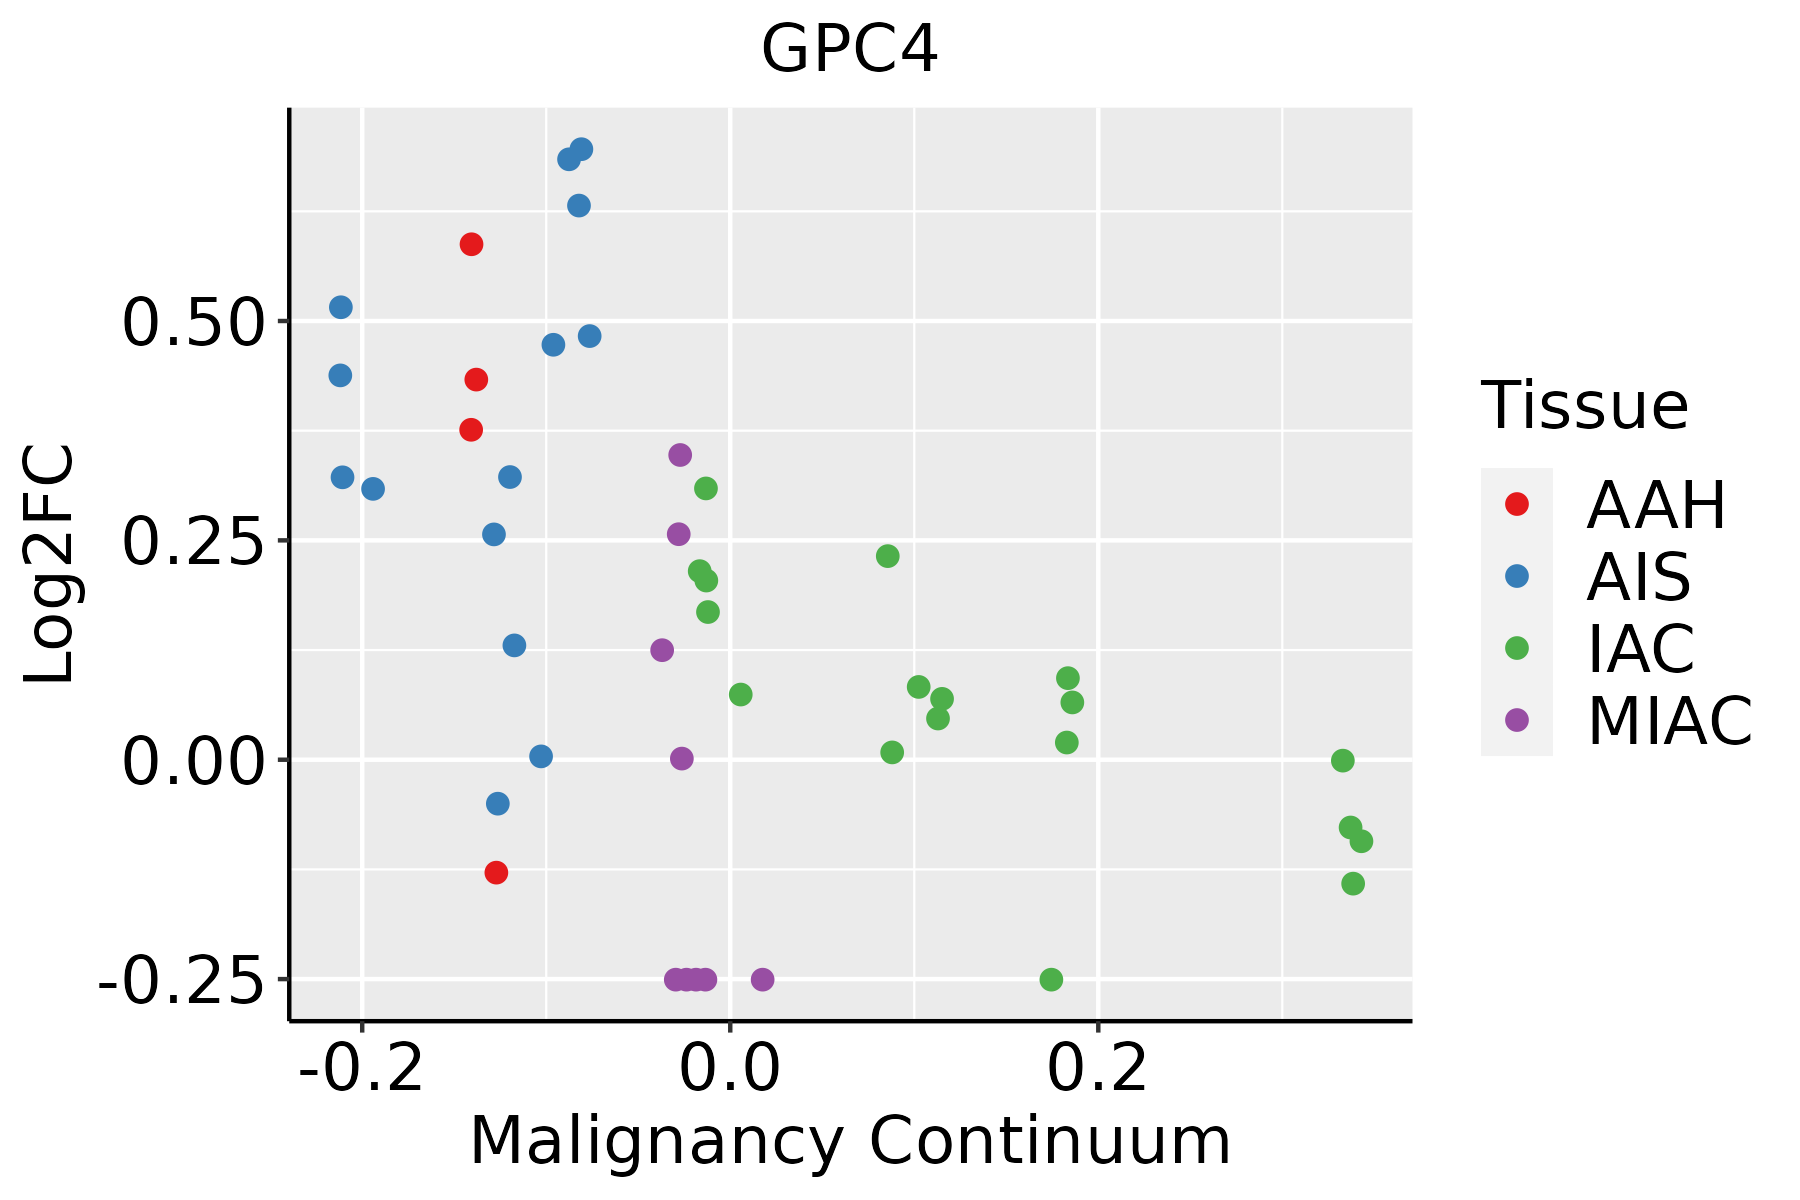 | AAH: Atypical adenomatous hyperplasia |
| AIS: Adenocarcinoma in situ | ||
| IAC: Invasive lung adenocarcinoma | ||
| MIA: Minimally invasive adenocarcinoma |
| ∗log2FC in expression of this searched gene in stem-like cells from each diseased tissue sample relative to stem-like cells in normal samples in each tissue plotted against the malignancy continuum. Samples are colored based on if they are from different disease stage. |
Top |
Malignant transformation related pathway analysis |
| Find out the enriched GO biological processes and KEGG pathways involved in transition from healthy to precancer to cancer |
| Tissue | Disease Stage | Enriched GO biological Processes |
| Colorectum | AD |  |
| Colorectum | SER |  |
| Colorectum | MSS |  |
| Colorectum | MSI-H |  |
| Colorectum | FAP |  |
| ∗Top 15 enriched GO BP terms are showed in the bar plot of each disease state in each tissue. Each row represents a significant GO biological process which is colored according to the -log10(p.adjust). |
| Page: 1 2 3 4 5 6 7 8 9 |
| GO ID | Tissue | Disease Stage | Description | Gene Ratio | Bg Ratio | pvalue | p.adjust | Count |
| GO:00990724 | Lung | IAC | regulation of postsynaptic membrane neurotransmitter receptor levels | 18/2061 | 62/18723 | 8.26e-05 | 1.69e-03 | 18 |
| GO:19054756 | Lung | IAC | regulation of protein localization to membrane | 36/2061 | 175/18723 | 1.54e-04 | 2.81e-03 | 36 |
| GO:00315032 | Lung | IAC | protein-containing complex localization | 42/2061 | 220/18723 | 2.60e-04 | 4.32e-03 | 42 |
| GO:00017383 | Lung | IAC | morphogenesis of a polarized epithelium | 21/2061 | 94/18723 | 1.15e-03 | 1.35e-02 | 21 |
| GO:19043756 | Lung | IAC | regulation of protein localization to cell periphery | 25/2061 | 125/18723 | 2.21e-03 | 2.16e-02 | 25 |
| GO:19024142 | Lung | IAC | protein localization to cell junction | 20/2061 | 94/18723 | 2.77e-03 | 2.52e-02 | 20 |
| GO:0060071 | Lung | IAC | Wnt signaling pathway, planar cell polarity pathway | 13/2061 | 52/18723 | 3.45e-03 | 2.94e-02 | 13 |
| GO:00508085 | Lung | IAC | synapse organization | 65/2061 | 426/18723 | 4.05e-03 | 3.31e-02 | 65 |
| GO:20000272 | Lung | IAC | regulation of animal organ morphogenesis | 24/2061 | 125/18723 | 4.62e-03 | 3.65e-02 | 24 |
| GO:0090175 | Lung | IAC | regulation of establishment of planar polarity | 13/2061 | 56/18723 | 6.78e-03 | 4.73e-02 | 13 |
| GO:001605512 | Lung | AIS | Wnt signaling pathway | 91/1849 | 444/18723 | 9.38e-12 | 5.47e-09 | 91 |
| GO:019873812 | Lung | AIS | cell-cell signaling by wnt | 91/1849 | 446/18723 | 1.22e-11 | 6.13e-09 | 91 |
| GO:003432912 | Lung | AIS | cell junction assembly | 84/1849 | 420/18723 | 2.16e-10 | 5.71e-08 | 84 |
| GO:199077812 | Lung | AIS | protein localization to cell periphery | 64/1849 | 333/18723 | 1.42e-07 | 1.48e-05 | 64 |
| GO:190547512 | Lung | AIS | regulation of protein localization to membrane | 37/1849 | 175/18723 | 6.36e-06 | 2.89e-04 | 37 |
| GO:190188811 | Lung | AIS | regulation of cell junction assembly | 41/1849 | 204/18723 | 7.76e-06 | 3.35e-04 | 41 |
| GO:000173811 | Lung | AIS | morphogenesis of a polarized epithelium | 24/1849 | 94/18723 | 1.00e-05 | 4.18e-04 | 24 |
| GO:009907211 | Lung | AIS | regulation of postsynaptic membrane neurotransmitter receptor levels | 18/1849 | 62/18723 | 1.94e-05 | 6.70e-04 | 18 |
| GO:003150311 | Lung | AIS | protein-containing complex localization | 39/1849 | 220/18723 | 2.24e-04 | 4.51e-03 | 39 |
| GO:00600711 | Lung | AIS | Wnt signaling pathway, planar cell polarity pathway | 14/1849 | 52/18723 | 3.82e-04 | 6.66e-03 | 14 |
| Page: 1 2 3 |
| Pathway ID | Tissue | Disease Stage | Description | Gene Ratio | Bg Ratio | pvalue | p.adjust | qvalue | Count |
| hsa043108 | Lung | IAC | Wnt signaling pathway | 40/1053 | 171/8465 | 4.56e-05 | 7.06e-04 | 4.69e-04 | 40 |
| hsa0431011 | Lung | IAC | Wnt signaling pathway | 40/1053 | 171/8465 | 4.56e-05 | 7.06e-04 | 4.69e-04 | 40 |
| hsa0431021 | Lung | AIS | Wnt signaling pathway | 39/961 | 171/8465 | 1.29e-05 | 3.32e-04 | 2.12e-04 | 39 |
| hsa0431031 | Lung | AIS | Wnt signaling pathway | 39/961 | 171/8465 | 1.29e-05 | 3.32e-04 | 2.12e-04 | 39 |
| Page: 1 |
Top |
Cell-cell communication analysis |
| Identification of potential cell-cell interactions between two cell types and their ligand-receptor pairs for different disease states |
| Ligand | Receptor | LRpair | Pathway | Tissue | Disease Stage |
| Page: 1 |
Top |
Single-cell gene regulatory network inference analysis |
| Find out the significant the regulons (TFs) and the target genes of each regulon across cell types for different disease states |
| TF | Cell Type | Tissue | Disease Stage | Target Gene | RSS | Regulon Activity |
| ∗The dot plots of a searched regulon are shown for all cell subpopulations in each disease state of each tissue based on the regulon specific score inferred using pySCENIC and by calculating the average expression. |
| Page: 1 |
Top |
Somatic mutation of malignant transformation related genes |
| Annotation of somatic variants for genes involved in malignant transformation |
| Hugo Symbol | Variant Class | Variant Classification | dbSNP RS | HGVSc | HGVSp | HGVSp Short | SWISSPROT | BIOTYPE | SIFT | PolyPhen | Tumor Sample Barcode | Tissue | Histology | Sex | Age | Stage | Therapy Types | Drugs | Outcome |
| GPC4 | SNV | Missense_Mutation | rs746676957 | c.19N>T | p.Pro7Ser | p.P7S | O75487 | protein_coding | tolerated(0.77) | benign(0.239) | TCGA-AC-A23H-01 | Breast | breast invasive carcinoma | Female | >=65 | I/II | Unknown | Unknown | PD |
| GPC4 | insertion | Nonsense_Mutation | novel | c.940_941insTCTGAAAGTGCCTTCAGTGCTCGCTTCAGACCACATCACCCCGAGG | p.Pro314LeufsTer2 | p.P314Lfs*2 | O75487 | protein_coding | TCGA-A7-A0CJ-01 | Breast | breast invasive carcinoma | Female | <65 | I/II | Chemotherapy | cytoxan | SD | ||
| GPC4 | insertion | In_Frame_Ins | novel | c.273_274insTTGAGCCCAGGAGTT | p.Cys91_Asn92insLeuSerProGlyVal | p.C91_N92insLSPGV | O75487 | protein_coding | TCGA-A8-A0A4-01 | Breast | breast invasive carcinoma | Female | >=65 | I/II | Hormone Therapy | tamoxiphen | CR | ||
| GPC4 | deletion | Frame_Shift_Del | novel | c.1590delT | p.Gly531ValfsTer56 | p.G531Vfs*56 | O75487 | protein_coding | TCGA-D8-A27V-01 | Breast | breast invasive carcinoma | Female | <65 | I/II | Hormone Therapy | tamoxiphen | SD | ||
| GPC4 | SNV | Missense_Mutation | c.13N>A | p.Gly5Ser | p.G5S | O75487 | protein_coding | tolerated(0.28) | benign(0) | TCGA-DG-A2KH-01 | Cervix | cervical & endocervical cancer | Female | <65 | I/II | Unknown | Unknown | SD | |
| GPC4 | SNV | Missense_Mutation | novel | c.1471N>A | p.Asp491Asn | p.D491N | O75487 | protein_coding | deleterious(0) | probably_damaging(0.932) | TCGA-DS-A1OB-01 | Cervix | cervical & endocervical cancer | Female | <65 | I/II | Chemotherapy | carboplatin | PD |
| GPC4 | SNV | Missense_Mutation | novel | c.454N>A | p.Val152Met | p.V152M | O75487 | protein_coding | deleterious(0) | benign(0.389) | TCGA-EA-A3HS-01 | Cervix | cervical & endocervical cancer | Female | <65 | I/II | Unknown | Unknown | SD |
| GPC4 | SNV | Missense_Mutation | c.1543N>A | p.Ala515Thr | p.A515T | O75487 | protein_coding | tolerated(0.63) | benign(0) | TCGA-AA-3672-01 | Colorectum | colon adenocarcinoma | Female | >=65 | III/IV | Unknown | Unknown | SD | |
| GPC4 | SNV | Missense_Mutation | rs773140565 | c.1388N>A | p.Arg463His | p.R463H | O75487 | protein_coding | deleterious(0) | possibly_damaging(0.671) | TCGA-AA-3672-01 | Colorectum | colon adenocarcinoma | Female | >=65 | III/IV | Unknown | Unknown | SD |
| GPC4 | SNV | Missense_Mutation | novel | c.970N>G | p.Met324Val | p.M324V | O75487 | protein_coding | tolerated(0.26) | possibly_damaging(0.479) | TCGA-AA-3877-01 | Colorectum | colon adenocarcinoma | Female | >=65 | I/II | Unknown | Unknown | SD |
| Page: 1 2 3 4 5 6 7 8 9 |
Top |
Related drugs of malignant transformation related genes |
| Identification of chemicals and drugs interact with genes involved in malignant transfromation |
| (DGIdb 4.0) |
| Entrez ID | Symbol | Category | Interaction Types | Drug Claim Name | Drug Name | PMIDs |
| Page: 1 |

Copyright 2023-Present -The University of Texas Health Science Center at Houston |