
|
|||||
|
 | |
| |
| |
| |
| |
| |
|
Gene: GIT1 |
Gene summary for GIT1 |
| Gene information | Species | Human | Gene symbol | GIT1 | Gene ID | 28964 |
| Gene name | GIT ArfGAP 1 | |
| Gene Alias | p95-APP1 | |
| Cytomap | 17q11.2 | |
| Gene Type | protein-coding | GO ID | GO:0000226 | UniProtAcc | Q59FC3 |
Top |
Malignant transformation analysis |
| Identification of the aberrant gene expression in precancerous and cancerous lesions by comparing the gene expression of stem-like cells in diseased tissues with normal stem cells |
| Entrez ID | Symbol | Replicates | Species | Organ | Tissue | Adj P-value | Log2FC | Malignancy |
| 28964 | GIT1 | LZE7T | Human | Esophagus | ESCC | 1.86e-06 | 3.19e-01 | 0.0667 |
| 28964 | GIT1 | LZE24T | Human | Esophagus | ESCC | 3.64e-07 | 2.90e-01 | 0.0596 |
| 28964 | GIT1 | LZE21T | Human | Esophagus | ESCC | 3.82e-02 | 2.58e-01 | 0.0655 |
| 28964 | GIT1 | P1T-E | Human | Esophagus | ESCC | 1.92e-07 | 2.49e-01 | 0.0875 |
| 28964 | GIT1 | P2T-E | Human | Esophagus | ESCC | 1.29e-07 | 5.70e-02 | 0.1177 |
| 28964 | GIT1 | P4T-E | Human | Esophagus | ESCC | 1.64e-09 | 1.58e-01 | 0.1323 |
| 28964 | GIT1 | P5T-E | Human | Esophagus | ESCC | 1.47e-04 | 6.24e-02 | 0.1327 |
| 28964 | GIT1 | P8T-E | Human | Esophagus | ESCC | 1.13e-11 | 1.40e-01 | 0.0889 |
| 28964 | GIT1 | P9T-E | Human | Esophagus | ESCC | 2.43e-11 | 1.57e-01 | 0.1131 |
| 28964 | GIT1 | P10T-E | Human | Esophagus | ESCC | 6.38e-04 | 1.06e-01 | 0.116 |
| 28964 | GIT1 | P12T-E | Human | Esophagus | ESCC | 5.62e-14 | 1.07e-01 | 0.1122 |
| 28964 | GIT1 | P15T-E | Human | Esophagus | ESCC | 1.05e-10 | 2.51e-01 | 0.1149 |
| 28964 | GIT1 | P16T-E | Human | Esophagus | ESCC | 2.91e-03 | 3.38e-02 | 0.1153 |
| 28964 | GIT1 | P17T-E | Human | Esophagus | ESCC | 1.55e-05 | 2.20e-01 | 0.1278 |
| 28964 | GIT1 | P20T-E | Human | Esophagus | ESCC | 1.52e-06 | 7.57e-02 | 0.1124 |
| 28964 | GIT1 | P21T-E | Human | Esophagus | ESCC | 1.37e-13 | 2.26e-01 | 0.1617 |
| 28964 | GIT1 | P22T-E | Human | Esophagus | ESCC | 1.12e-17 | 1.89e-01 | 0.1236 |
| 28964 | GIT1 | P23T-E | Human | Esophagus | ESCC | 3.16e-11 | 2.26e-01 | 0.108 |
| 28964 | GIT1 | P24T-E | Human | Esophagus | ESCC | 7.70e-04 | 1.81e-01 | 0.1287 |
| 28964 | GIT1 | P26T-E | Human | Esophagus | ESCC | 1.27e-09 | 4.17e-02 | 0.1276 |
| Page: 1 2 3 4 |
| Tissue | Expression Dynamics | Abbreviation |
| Esophagus | 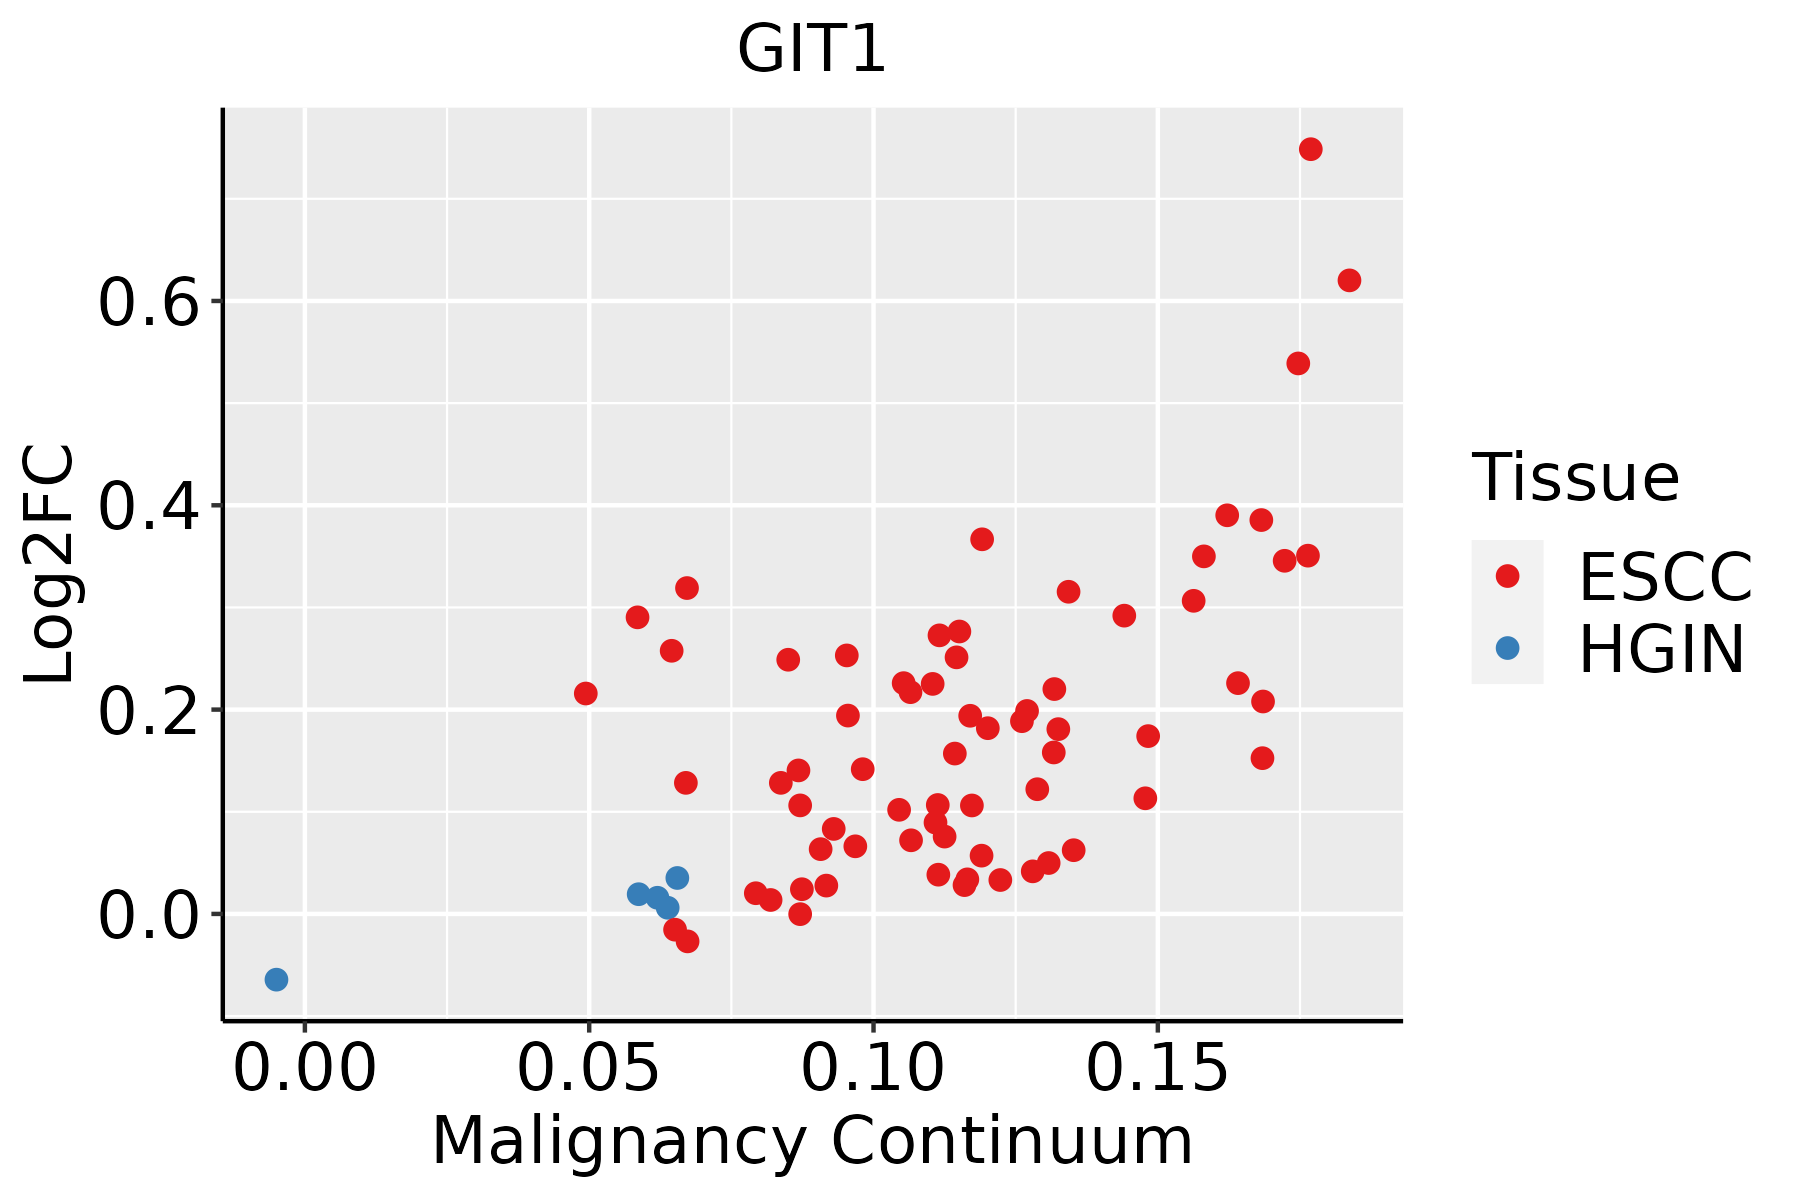 | ESCC: Esophageal squamous cell carcinoma |
| HGIN: High-grade intraepithelial neoplasias | ||
| LGIN: Low-grade intraepithelial neoplasias | ||
| Liver | 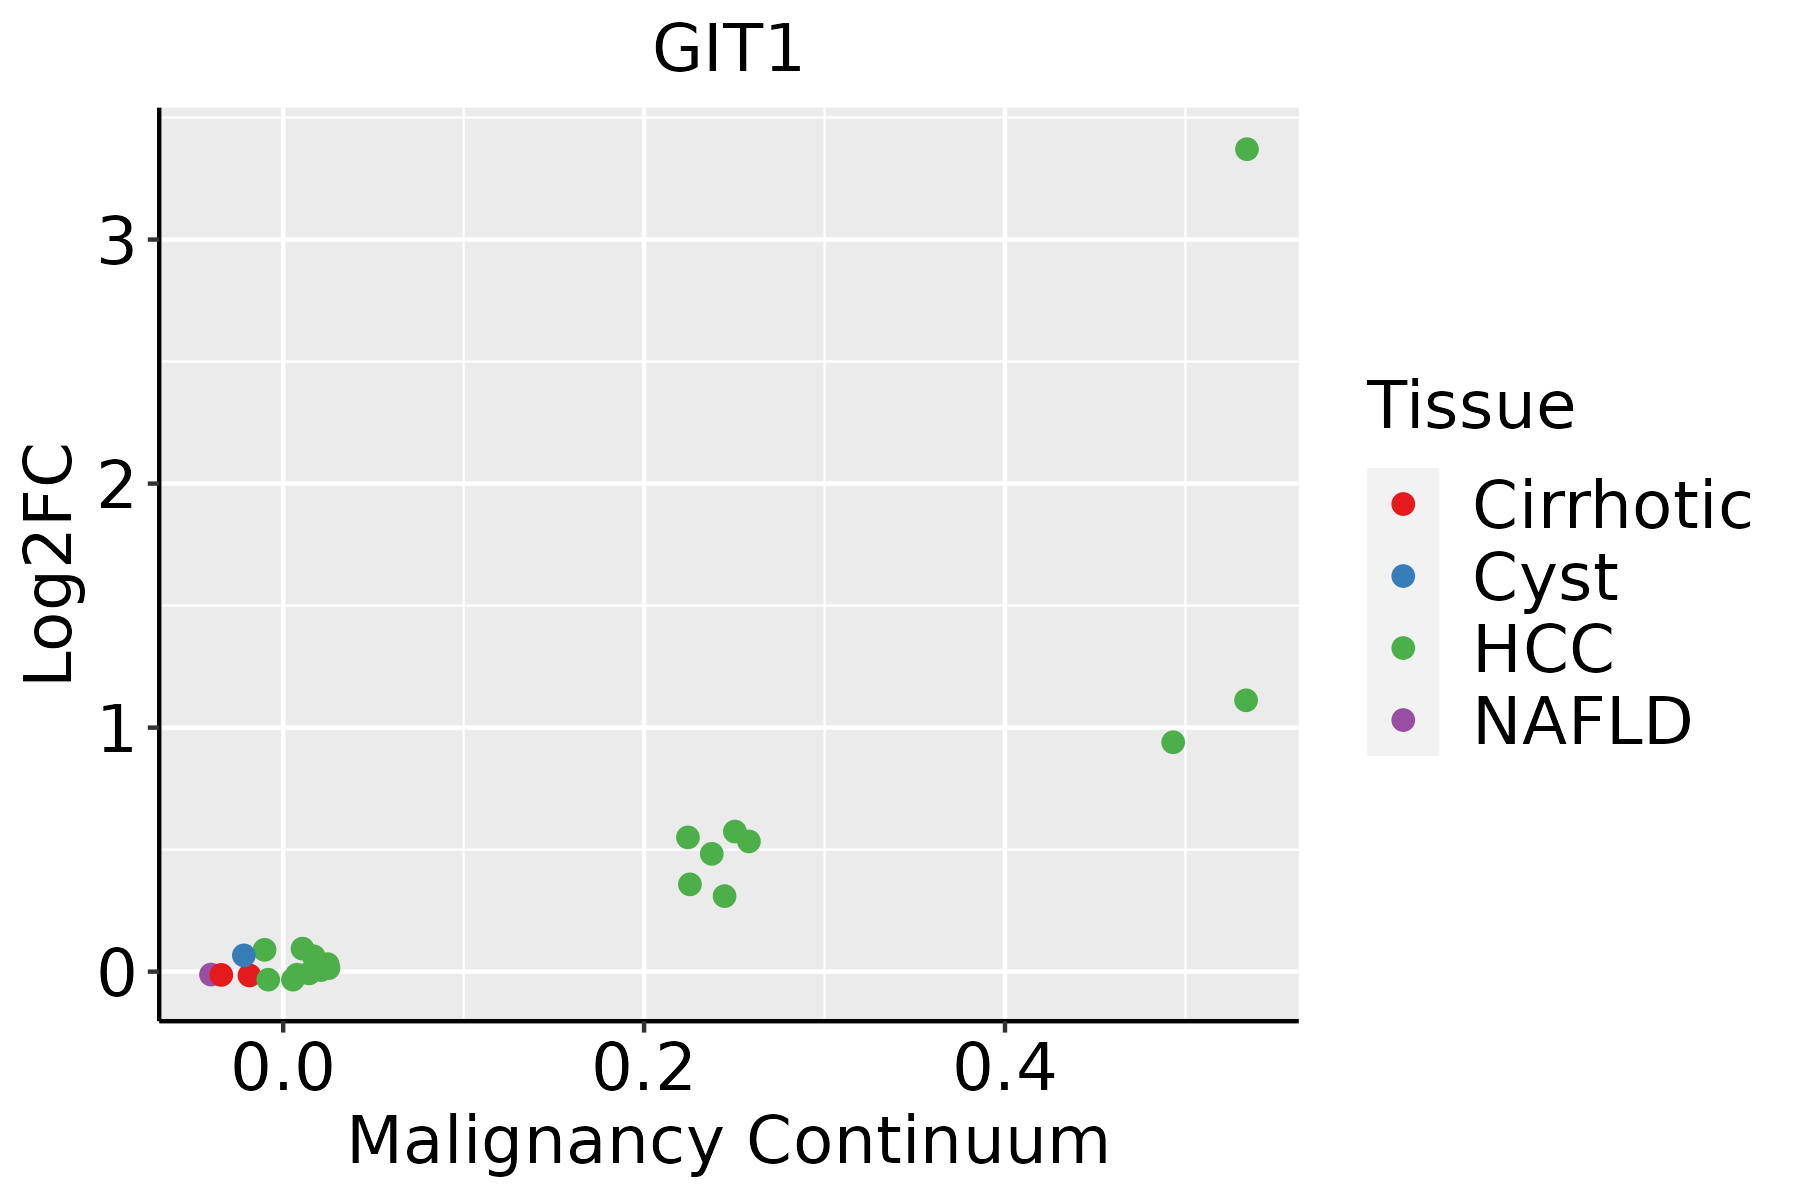 | HCC: Hepatocellular carcinoma |
| NAFLD: Non-alcoholic fatty liver disease | ||
| Oral Cavity | 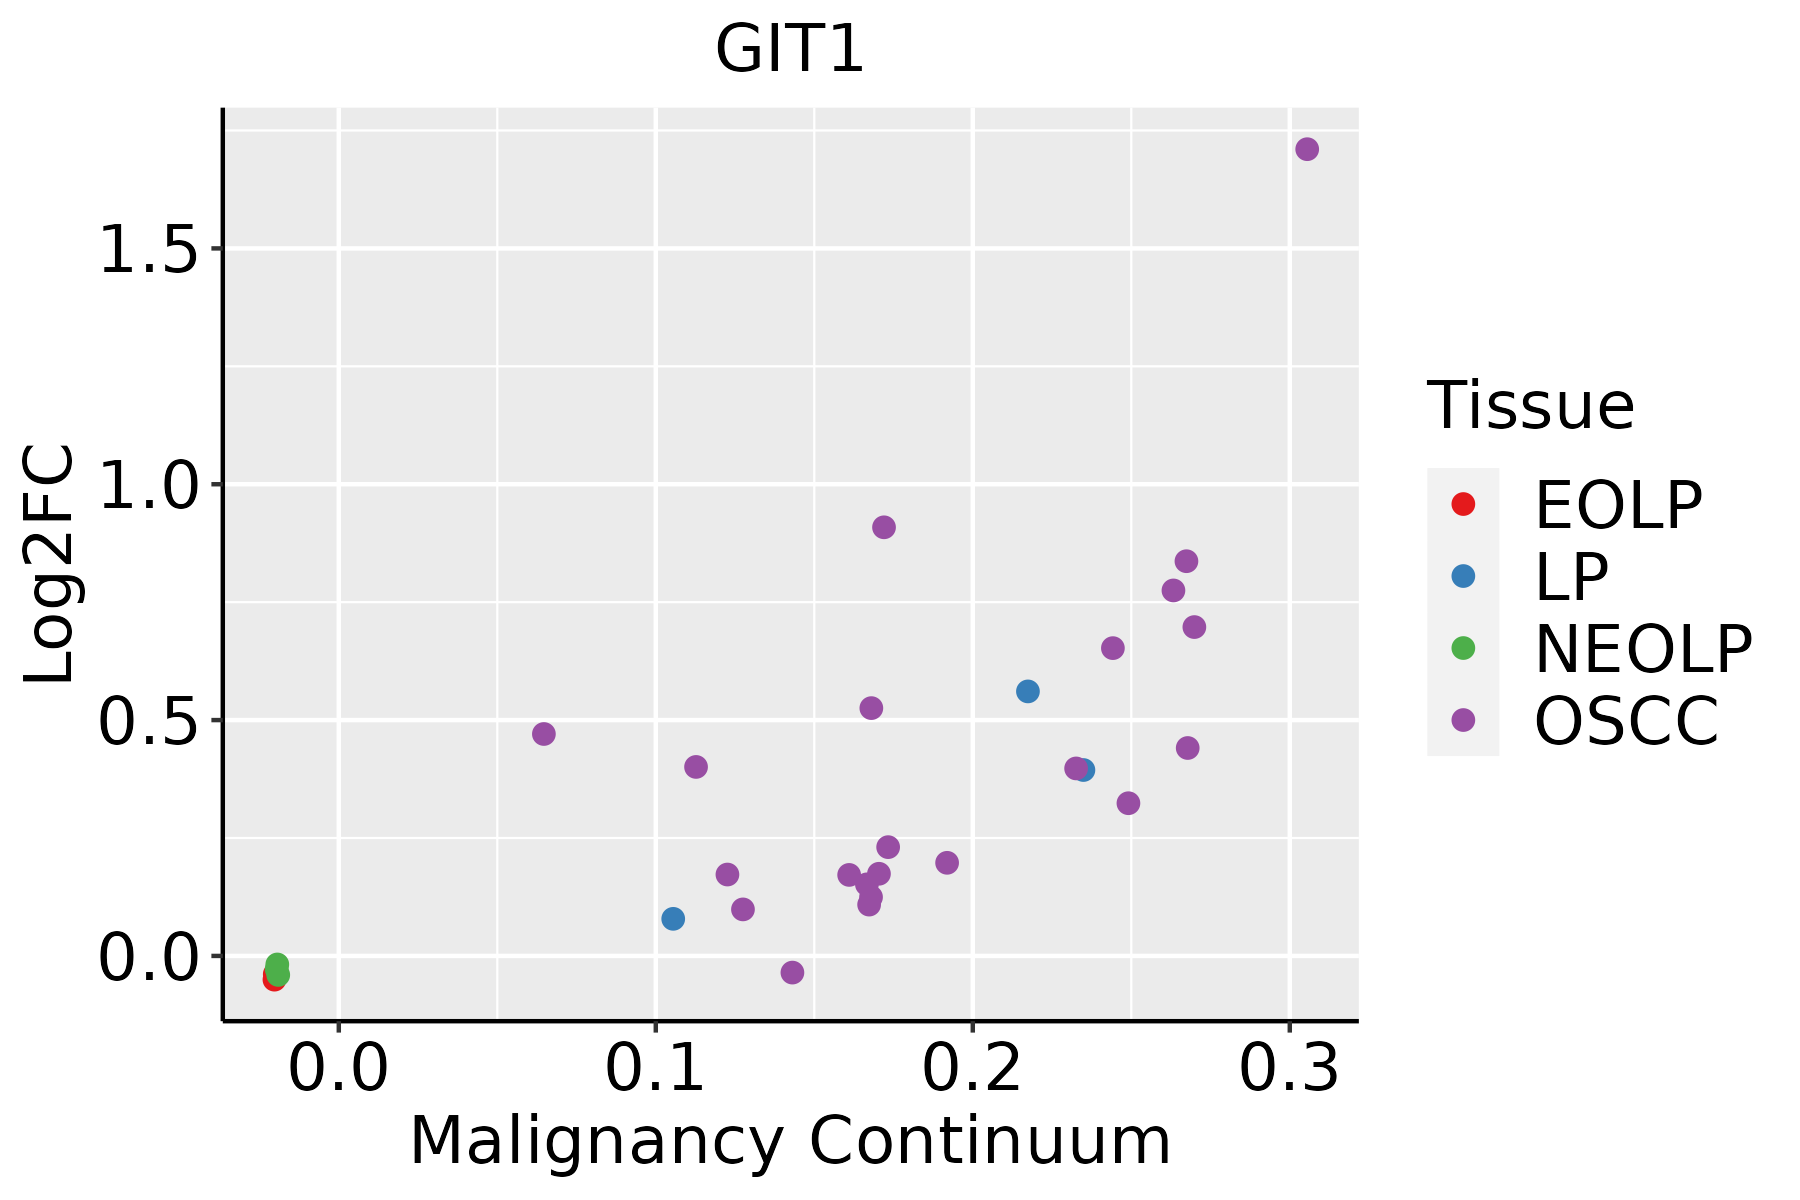 | EOLP: Erosive Oral lichen planus |
| LP: leukoplakia | ||
| NEOLP: Non-erosive oral lichen planus | ||
| OSCC: Oral squamous cell carcinoma |
| ∗log2FC in expression of this searched gene in stem-like cells from each diseased tissue sample relative to stem-like cells in normal samples in each tissue plotted against the malignancy continuum. Samples are colored based on if they are from different disease stage. |
Top |
Malignant transformation related pathway analysis |
| Find out the enriched GO biological processes and KEGG pathways involved in transition from healthy to precancer to cancer |
| Tissue | Disease Stage | Enriched GO biological Processes |
| Colorectum | AD |  |
| Colorectum | SER |  |
| Colorectum | MSS |  |
| Colorectum | MSI-H |  |
| Colorectum | FAP |  |
| ∗Top 15 enriched GO BP terms are showed in the bar plot of each disease state in each tissue. Each row represents a significant GO biological process which is colored according to the -log10(p.adjust). |
| Page: 1 2 3 4 5 6 7 8 9 |
| GO ID | Tissue | Disease Stage | Description | Gene Ratio | Bg Ratio | pvalue | p.adjust | Count |
| GO:0072521111 | Esophagus | ESCC | purine-containing compound metabolic process | 238/8552 | 416/18723 | 1.20e-06 | 1.49e-05 | 238 |
| GO:0009150111 | Esophagus | ESCC | purine ribonucleotide metabolic process | 213/8552 | 368/18723 | 1.40e-06 | 1.69e-05 | 213 |
| GO:0006163111 | Esophagus | ESCC | purine nucleotide metabolic process | 226/8552 | 396/18723 | 2.81e-06 | 3.21e-05 | 226 |
| GO:000150317 | Esophagus | ESCC | ossification | 232/8552 | 408/18723 | 3.00e-06 | 3.40e-05 | 232 |
| GO:004545419 | Esophagus | ESCC | cell redox homeostasis | 29/8552 | 35/18723 | 6.61e-06 | 6.75e-05 | 29 |
| GO:00311128 | Esophagus | ESCC | positive regulation of microtubule polymerization or depolymerization | 29/8552 | 37/18723 | 4.97e-05 | 3.86e-04 | 29 |
| GO:00311094 | Esophagus | ESCC | microtubule polymerization or depolymerization | 77/8552 | 122/18723 | 7.60e-05 | 5.68e-04 | 77 |
| GO:004346719 | Esophagus | ESCC | regulation of generation of precursor metabolites and energy | 81/8552 | 130/18723 | 9.58e-05 | 6.81e-04 | 81 |
| GO:00311168 | Esophagus | ESCC | positive regulation of microtubule polymerization | 26/8552 | 33/18723 | 1.06e-04 | 7.43e-04 | 26 |
| GO:003249619 | Esophagus | ESCC | response to lipopolysaccharide | 191/8552 | 343/18723 | 1.11e-04 | 7.73e-04 | 191 |
| GO:00467856 | Esophagus | ESCC | microtubule polymerization | 55/8552 | 83/18723 | 1.21e-04 | 8.31e-04 | 55 |
| GO:00442626 | Esophagus | ESCC | cellular carbohydrate metabolic process | 160/8552 | 283/18723 | 1.43e-04 | 9.66e-04 | 160 |
| GO:00070205 | Esophagus | ESCC | microtubule nucleation | 27/8552 | 35/18723 | 1.48e-04 | 9.88e-04 | 27 |
| GO:000913219 | Esophagus | ESCC | nucleoside diphosphate metabolic process | 77/8552 | 124/18723 | 1.65e-04 | 1.09e-03 | 77 |
| GO:00311104 | Esophagus | ESCC | regulation of microtubule polymerization or depolymerization | 57/8552 | 88/18723 | 2.32e-04 | 1.44e-03 | 57 |
| GO:00620129 | Esophagus | ESCC | regulation of small molecule metabolic process | 184/8552 | 334/18723 | 3.11e-04 | 1.85e-03 | 184 |
| GO:00109684 | Esophagus | ESCC | regulation of microtubule nucleation | 10/8552 | 10/18723 | 3.94e-04 | 2.26e-03 | 10 |
| GO:000918520 | Esophagus | ESCC | ribonucleoside diphosphate metabolic process | 66/8552 | 106/18723 | 4.21e-04 | 2.39e-03 | 66 |
| GO:001605216 | Esophagus | ESCC | carbohydrate catabolic process | 91/8552 | 154/18723 | 5.39e-04 | 2.97e-03 | 91 |
| GO:00328864 | Esophagus | ESCC | regulation of microtubule-based process | 134/8552 | 240/18723 | 9.44e-04 | 4.80e-03 | 134 |
| Page: 1 2 3 4 5 6 7 8 9 |
| Pathway ID | Tissue | Disease Stage | Description | Gene Ratio | Bg Ratio | pvalue | p.adjust | qvalue | Count |
| hsa04144210 | Esophagus | ESCC | Endocytosis | 186/4205 | 251/8465 | 9.74e-16 | 4.66e-14 | 2.39e-14 | 186 |
| hsa0512018 | Esophagus | ESCC | Epithelial cell signaling in Helicobacter pylori infection | 52/4205 | 70/8465 | 2.17e-05 | 1.07e-04 | 5.47e-05 | 52 |
| hsa0481028 | Esophagus | ESCC | Regulation of actin cytoskeleton | 133/4205 | 229/8465 | 5.94e-03 | 1.48e-02 | 7.56e-03 | 133 |
| hsa0414437 | Esophagus | ESCC | Endocytosis | 186/4205 | 251/8465 | 9.74e-16 | 4.66e-14 | 2.39e-14 | 186 |
| hsa0512019 | Esophagus | ESCC | Epithelial cell signaling in Helicobacter pylori infection | 52/4205 | 70/8465 | 2.17e-05 | 1.07e-04 | 5.47e-05 | 52 |
| hsa04810112 | Esophagus | ESCC | Regulation of actin cytoskeleton | 133/4205 | 229/8465 | 5.94e-03 | 1.48e-02 | 7.56e-03 | 133 |
| hsa0414422 | Liver | HCC | Endocytosis | 178/4020 | 251/8465 | 2.03e-14 | 5.22e-13 | 2.91e-13 | 178 |
| hsa051202 | Liver | HCC | Epithelial cell signaling in Helicobacter pylori infection | 50/4020 | 70/8465 | 3.96e-05 | 2.16e-04 | 1.20e-04 | 50 |
| hsa0481041 | Liver | HCC | Regulation of actin cytoskeleton | 134/4020 | 229/8465 | 4.48e-04 | 1.94e-03 | 1.08e-03 | 134 |
| hsa0414432 | Liver | HCC | Endocytosis | 178/4020 | 251/8465 | 2.03e-14 | 5.22e-13 | 2.91e-13 | 178 |
| hsa051203 | Liver | HCC | Epithelial cell signaling in Helicobacter pylori infection | 50/4020 | 70/8465 | 3.96e-05 | 2.16e-04 | 1.20e-04 | 50 |
| hsa0481051 | Liver | HCC | Regulation of actin cytoskeleton | 134/4020 | 229/8465 | 4.48e-04 | 1.94e-03 | 1.08e-03 | 134 |
| hsa0414427 | Oral cavity | OSCC | Endocytosis | 174/3704 | 251/8465 | 9.42e-17 | 4.51e-15 | 2.29e-15 | 174 |
| hsa0512010 | Oral cavity | OSCC | Epithelial cell signaling in Helicobacter pylori infection | 49/3704 | 70/8465 | 7.57e-06 | 3.59e-05 | 1.83e-05 | 49 |
| hsa0481026 | Oral cavity | OSCC | Regulation of actin cytoskeleton | 129/3704 | 229/8465 | 7.14e-05 | 2.74e-04 | 1.40e-04 | 129 |
| hsa04144112 | Oral cavity | OSCC | Endocytosis | 174/3704 | 251/8465 | 9.42e-17 | 4.51e-15 | 2.29e-15 | 174 |
| hsa0512017 | Oral cavity | OSCC | Epithelial cell signaling in Helicobacter pylori infection | 49/3704 | 70/8465 | 7.57e-06 | 3.59e-05 | 1.83e-05 | 49 |
| hsa04810111 | Oral cavity | OSCC | Regulation of actin cytoskeleton | 129/3704 | 229/8465 | 7.14e-05 | 2.74e-04 | 1.40e-04 | 129 |
| Page: 1 |
Top |
Cell-cell communication analysis |
| Identification of potential cell-cell interactions between two cell types and their ligand-receptor pairs for different disease states |
| Ligand | Receptor | LRpair | Pathway | Tissue | Disease Stage |
| Page: 1 |
Top |
Single-cell gene regulatory network inference analysis |
| Find out the significant the regulons (TFs) and the target genes of each regulon across cell types for different disease states |
| TF | Cell Type | Tissue | Disease Stage | Target Gene | RSS | Regulon Activity |
| ∗The dot plots of a searched regulon are shown for all cell subpopulations in each disease state of each tissue based on the regulon specific score inferred using pySCENIC and by calculating the average expression. |
| Page: 1 |
Top |
Somatic mutation of malignant transformation related genes |
| Annotation of somatic variants for genes involved in malignant transformation |
| Hugo Symbol | Variant Class | Variant Classification | dbSNP RS | HGVSc | HGVSp | HGVSp Short | SWISSPROT | BIOTYPE | SIFT | PolyPhen | Tumor Sample Barcode | Tissue | Histology | Sex | Age | Stage | Therapy Types | Drugs | Outcome |
| GIT1 | SNV | Missense_Mutation | novel | c.1930N>A | p.Leu644Ile | p.L644I | Q9Y2X7 | protein_coding | tolerated_low_confidence(0.27) | benign(0.021) | TCGA-A7-A4SA-01 | Breast | breast invasive carcinoma | Female | <65 | I/II | Chemotherapy | doxorubicin | CR |
| GIT1 | SNV | Missense_Mutation | rs758906145 | c.2146N>A | p.Ala716Thr | p.A716T | Q9Y2X7 | protein_coding | tolerated(0.25) | benign(0.071) | TCGA-AO-A128-01 | Breast | breast invasive carcinoma | Female | <65 | I/II | Chemotherapy | doxorubicin | SD |
| GIT1 | SNV | Missense_Mutation | c.336N>C | p.Gln112His | p.Q112H | Q9Y2X7 | protein_coding | deleterious(0) | probably_damaging(0.984) | TCGA-BH-A18S-01 | Breast | breast invasive carcinoma | Female | >=65 | I/II | Unknown | Unknown | SD | |
| GIT1 | SNV | Missense_Mutation | rs867941189 | c.1141N>T | p.Arg381Trp | p.R381W | Q9Y2X7 | protein_coding | deleterious(0.01) | possibly_damaging(0.676) | TCGA-2W-A8YY-01 | Cervix | cervical & endocervical cancer | Female | <65 | I/II | Chemotherapy | cisplatin | CR |
| GIT1 | SNV | Missense_Mutation | novel | c.898G>C | p.Glu300Gln | p.E300Q | Q9Y2X7 | protein_coding | tolerated(0.07) | probably_damaging(0.995) | TCGA-C5-A1MH-01 | Cervix | cervical & endocervical cancer | Female | >=65 | III/IV | Chemotherapy | cisplatin | PD |
| GIT1 | SNV | Missense_Mutation | novel | c.550N>A | p.Glu184Lys | p.E184K | Q9Y2X7 | protein_coding | deleterious(0) | probably_damaging(0.992) | TCGA-C5-A8XJ-01 | Cervix | cervical & endocervical cancer | Female | >=65 | I/II | Chemotherapy | cisplatin | SD |
| GIT1 | SNV | Missense_Mutation | novel | c.419N>A | p.Ser140Asn | p.S140N | Q9Y2X7 | protein_coding | deleterious(0) | probably_damaging(0.995) | TCGA-VS-A8EJ-01 | Cervix | cervical & endocervical cancer | Female | <65 | I/II | Chemotherapy | cisplatin | PD |
| GIT1 | SNV | Missense_Mutation | rs374985717 | c.1651N>A | p.Asp551Asn | p.D551N | Q9Y2X7 | protein_coding | tolerated(0.16) | benign(0.012) | TCGA-AA-A00N-01 | Colorectum | colon adenocarcinoma | Male | >=65 | I/II | Unknown | Unknown | PD |
| GIT1 | SNV | Missense_Mutation | rs767726313 | c.1129G>A | p.Glu377Lys | p.E377K | Q9Y2X7 | protein_coding | tolerated(0.26) | benign(0.048) | TCGA-AA-A010-01 | Colorectum | colon adenocarcinoma | Female | <65 | I/II | Chemotherapy | folinic | CR |
| GIT1 | SNV | Missense_Mutation | rs763846891 | c.1742N>T | p.Pro581Leu | p.P581L | Q9Y2X7 | protein_coding | tolerated(0.11) | benign(0.005) | TCGA-AA-A03F-01 | Colorectum | colon adenocarcinoma | Female | >=65 | III/IV | Unknown | Unknown | PD |
| Page: 1 2 3 4 5 6 7 |
Top |
Related drugs of malignant transformation related genes |
| Identification of chemicals and drugs interact with genes involved in malignant transfromation |
| (DGIdb 4.0) |
| Entrez ID | Symbol | Category | Interaction Types | Drug Claim Name | Drug Name | PMIDs |
| Page: 1 |

Copyright 2023-Present -The University of Texas Health Science Center at Houston |