
|
|||||
|
 | |
| |
| |
| |
| |
| |
|
Gene: GGCT |
Gene summary for GGCT |
| Gene information | Species | Human | Gene symbol | GGCT | Gene ID | 79017 |
| Gene name | gamma-glutamylcyclotransferase | |
| Gene Alias | C7orf24 | |
| Cytomap | 7p14.3 | |
| Gene Type | protein-coding | GO ID | GO:0001836 | UniProtAcc | O75223 |
Top |
Malignant transformation analysis |
| Identification of the aberrant gene expression in precancerous and cancerous lesions by comparing the gene expression of stem-like cells in diseased tissues with normal stem cells |
| Entrez ID | Symbol | Replicates | Species | Organ | Tissue | Adj P-value | Log2FC | Malignancy |
| 79017 | GGCT | GSM4909282 | Human | Breast | IDC | 4.09e-65 | 9.93e-01 | -0.0288 |
| 79017 | GGCT | GSM4909285 | Human | Breast | IDC | 3.92e-10 | 3.96e-01 | 0.21 |
| 79017 | GGCT | GSM4909288 | Human | Breast | IDC | 4.95e-09 | 4.02e-01 | 0.0988 |
| 79017 | GGCT | GSM4909289 | Human | Breast | IDC | 8.08e-14 | 7.36e-01 | 0.1064 |
| 79017 | GGCT | GSM4909290 | Human | Breast | IDC | 3.53e-27 | 7.31e-01 | 0.2096 |
| 79017 | GGCT | GSM4909293 | Human | Breast | IDC | 2.02e-13 | 4.24e-01 | 0.1581 |
| 79017 | GGCT | GSM4909294 | Human | Breast | IDC | 6.96e-41 | 8.54e-01 | 0.2022 |
| 79017 | GGCT | GSM4909296 | Human | Breast | IDC | 3.96e-26 | 5.70e-01 | 0.1524 |
| 79017 | GGCT | GSM4909297 | Human | Breast | IDC | 2.68e-06 | -6.12e-02 | 0.1517 |
| 79017 | GGCT | GSM4909306 | Human | Breast | IDC | 2.42e-03 | 2.99e-01 | 0.1564 |
| 79017 | GGCT | GSM4909308 | Human | Breast | IDC | 2.14e-18 | 5.35e-01 | 0.158 |
| 79017 | GGCT | GSM4909311 | Human | Breast | IDC | 4.19e-20 | -1.76e-01 | 0.1534 |
| 79017 | GGCT | GSM4909312 | Human | Breast | IDC | 1.33e-09 | 1.78e-01 | 0.1552 |
| 79017 | GGCT | GSM4909313 | Human | Breast | IDC | 3.71e-02 | 1.49e-02 | 0.0391 |
| 79017 | GGCT | GSM4909315 | Human | Breast | IDC | 3.26e-43 | 9.07e-01 | 0.21 |
| 79017 | GGCT | GSM4909316 | Human | Breast | IDC | 4.60e-25 | 8.75e-01 | 0.21 |
| 79017 | GGCT | GSM4909318 | Human | Breast | IDC | 1.88e-05 | 4.46e-01 | 0.2031 |
| 79017 | GGCT | GSM4909319 | Human | Breast | IDC | 1.69e-30 | -5.49e-02 | 0.1563 |
| 79017 | GGCT | GSM4909320 | Human | Breast | IDC | 5.04e-04 | -2.19e-01 | 0.1575 |
| 79017 | GGCT | GSM4909321 | Human | Breast | IDC | 3.23e-09 | 6.04e-03 | 0.1559 |
| Page: 1 2 3 4 5 6 7 8 9 |
| Tissue | Expression Dynamics | Abbreviation |
| Breast |  | IDC: Invasive ductal carcinoma |
| DCIS: Ductal carcinoma in situ | ||
| Precancer(BRCA1-mut): Precancerous lesion from BRCA1 mutation carriers | ||
| Cervix |  | CC: Cervix cancer |
| HSIL_HPV: HPV-infected high-grade squamous intraepithelial lesions | ||
| N_HPV: HPV-infected normal cervix | ||
| Colorectum (GSE201348) |  | FAP: Familial adenomatous polyposis |
| CRC: Colorectal cancer | ||
| Colorectum (HTA11) |  | AD: Adenomas |
| SER: Sessile serrated lesions | ||
| MSI-H: Microsatellite-high colorectal cancer | ||
| MSS: Microsatellite stable colorectal cancer | ||
| Esophagus |  | ESCC: Esophageal squamous cell carcinoma |
| HGIN: High-grade intraepithelial neoplasias | ||
| LGIN: Low-grade intraepithelial neoplasias | ||
| Liver | 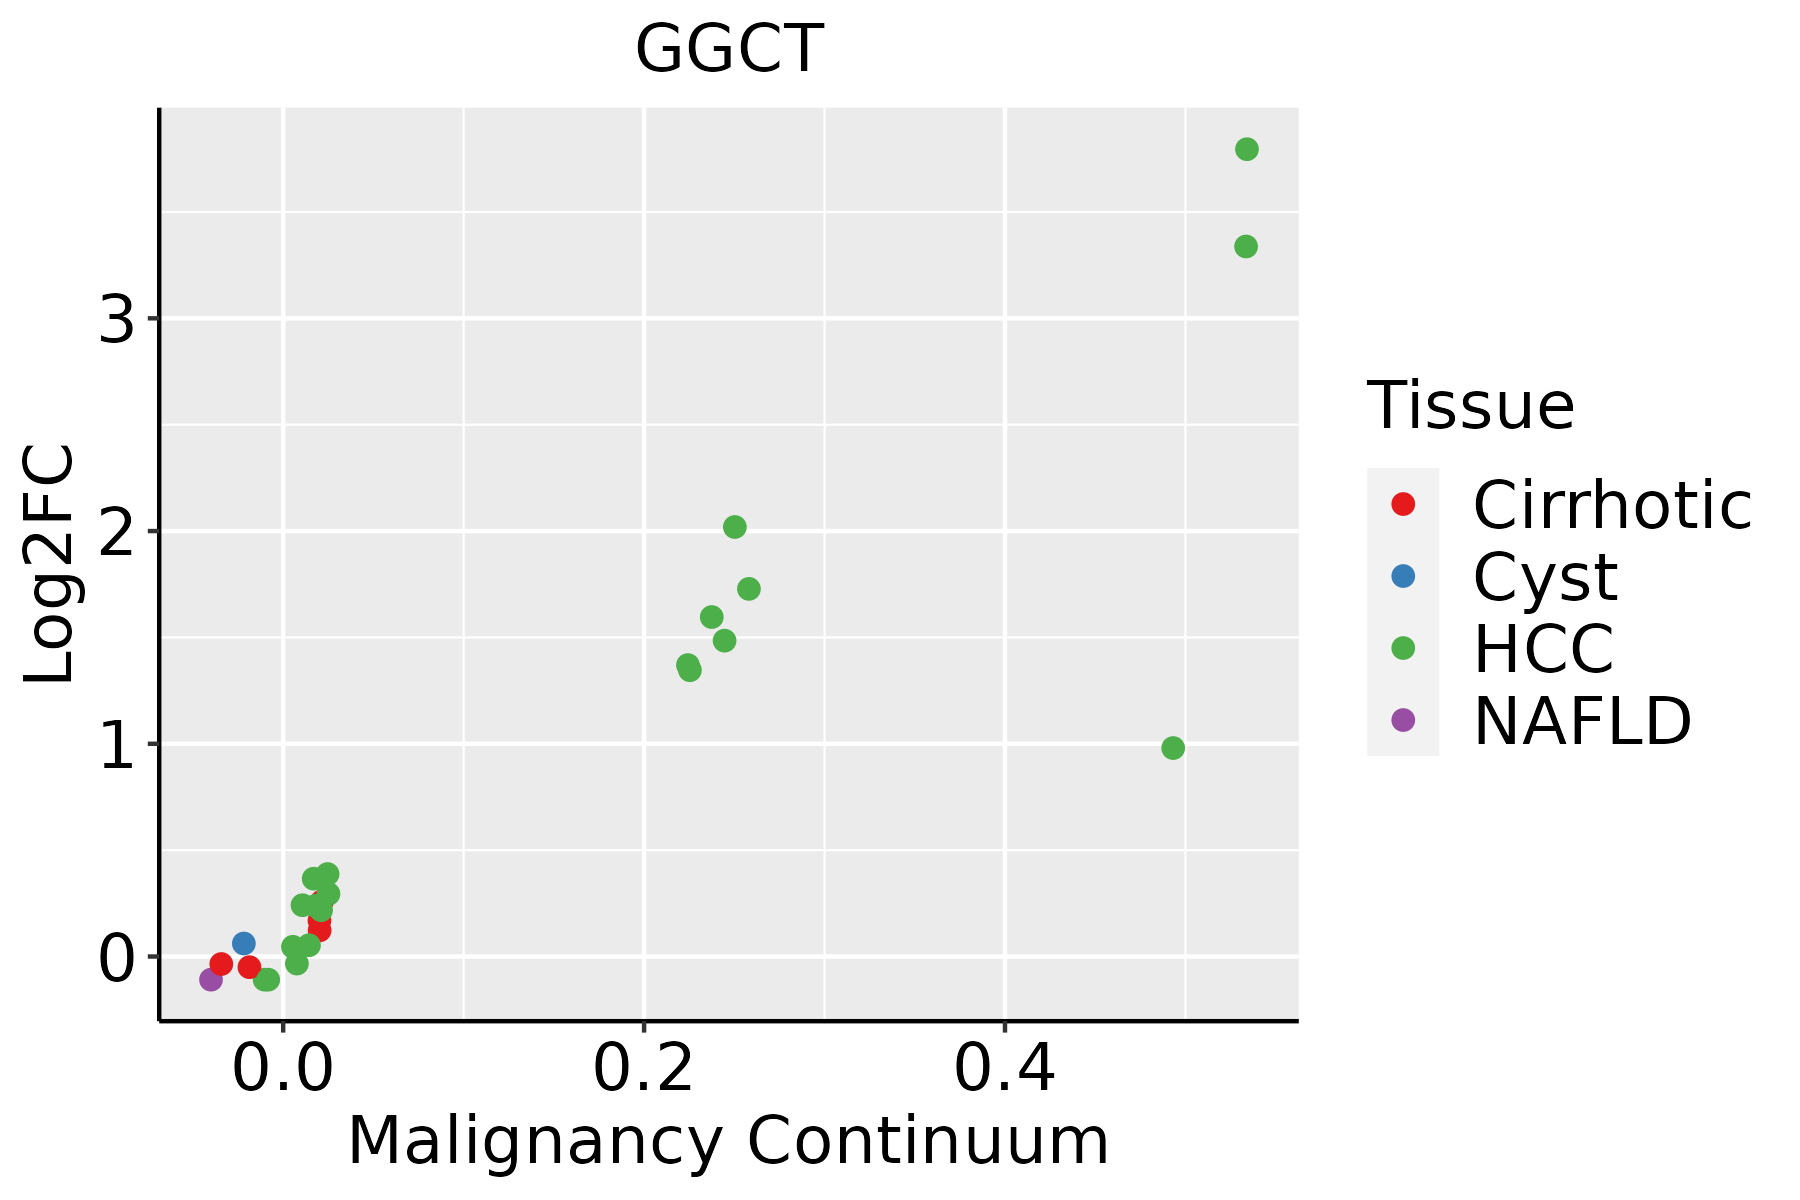 | HCC: Hepatocellular carcinoma |
| NAFLD: Non-alcoholic fatty liver disease | ||
| Oral Cavity | 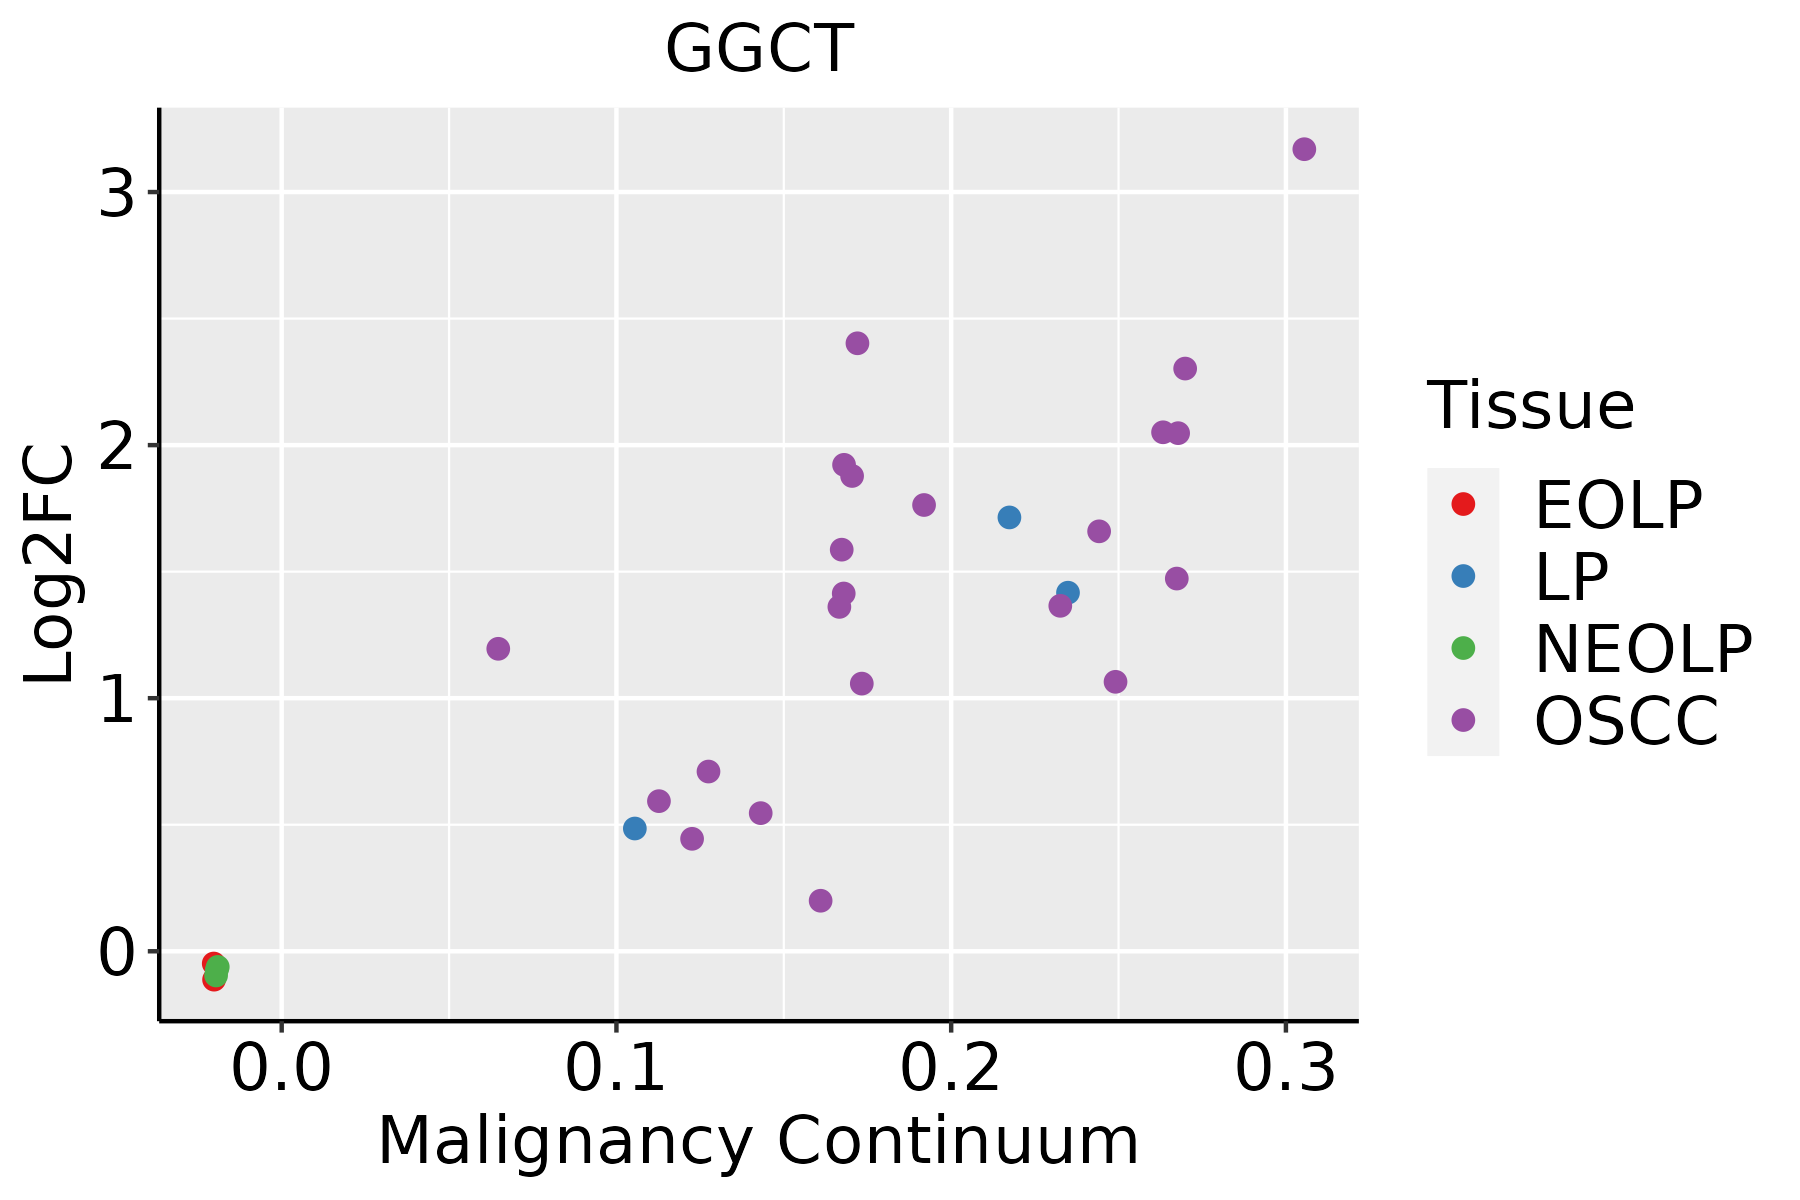 | EOLP: Erosive Oral lichen planus |
| LP: leukoplakia | ||
| NEOLP: Non-erosive oral lichen planus | ||
| OSCC: Oral squamous cell carcinoma | ||
| Prostate |  | BPH: Benign Prostatic Hyperplasia |
| Skin | 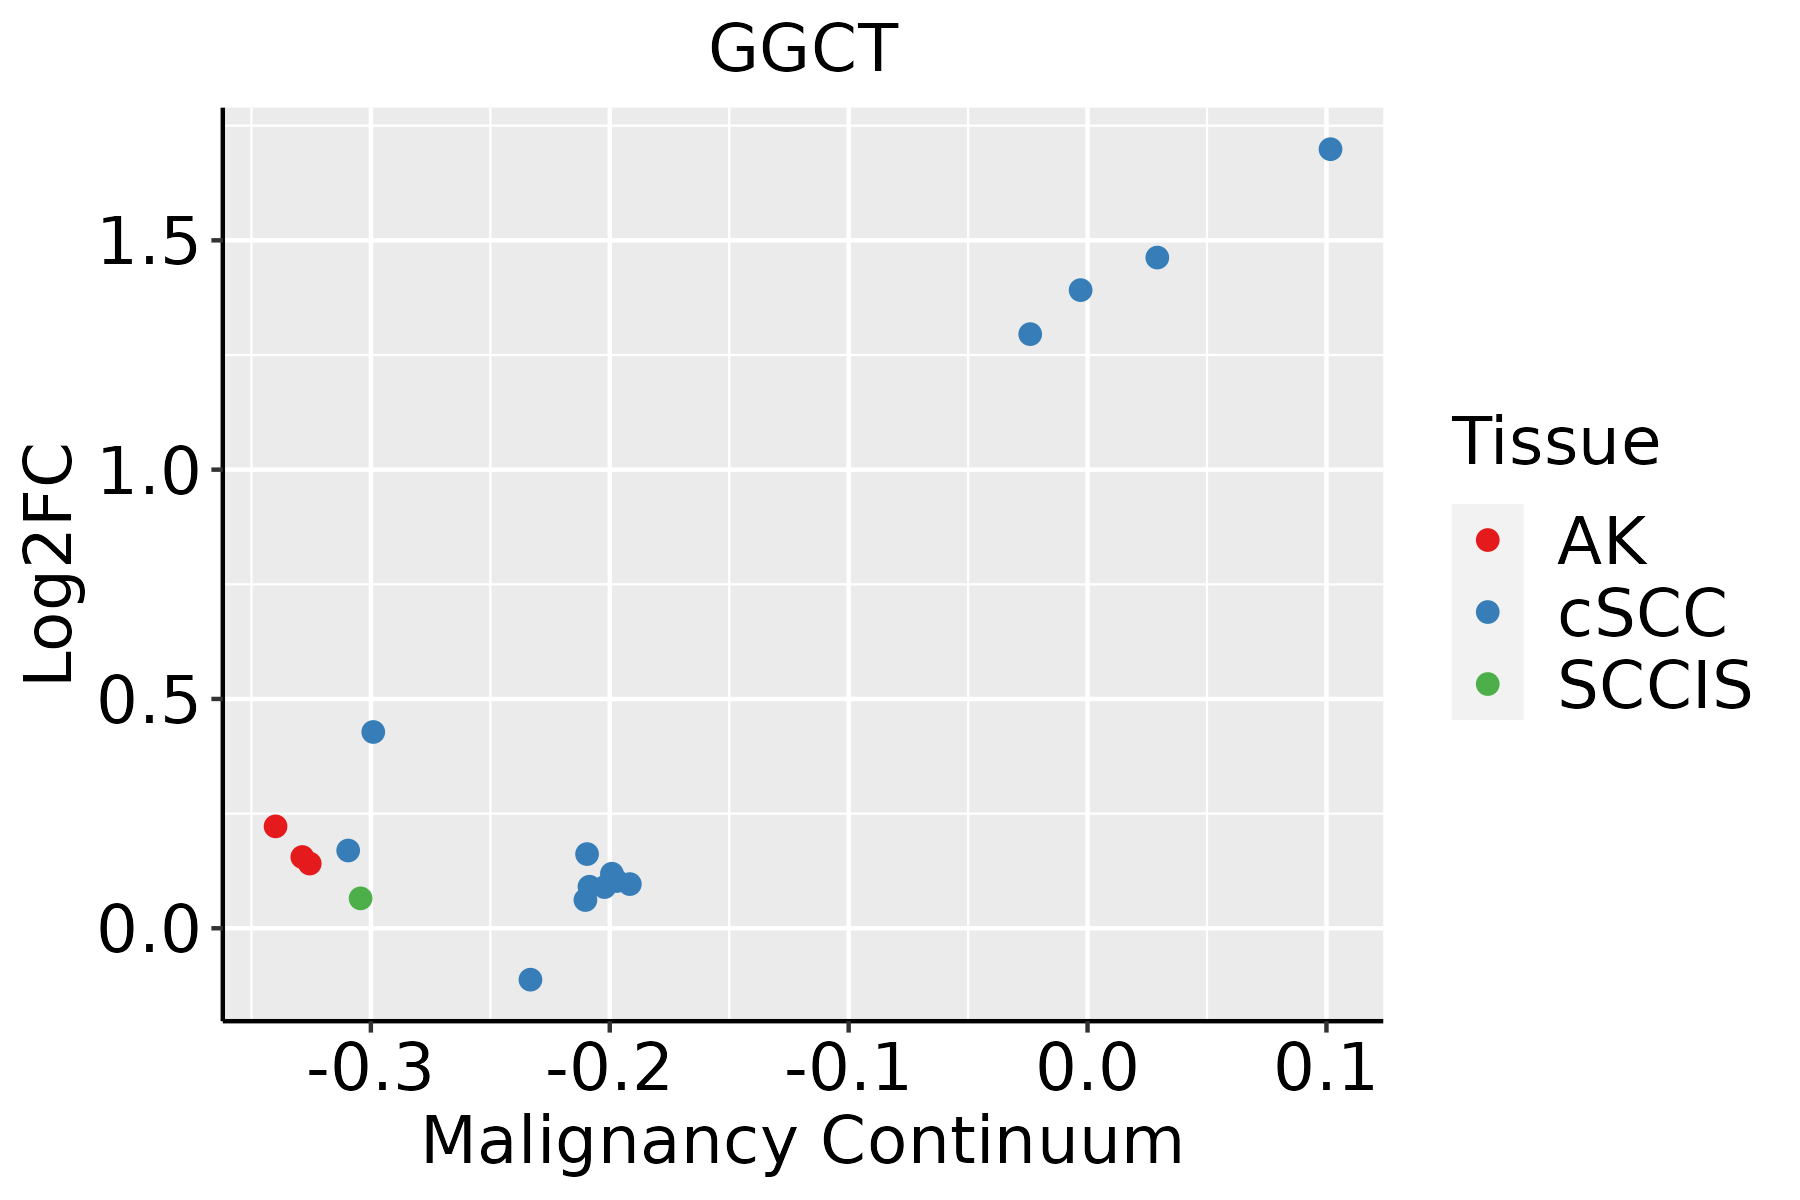 | AK: Actinic keratosis |
| cSCC: Cutaneous squamous cell carcinoma | ||
| SCCIS:squamous cell carcinoma in situ | ||
| Thyroid | 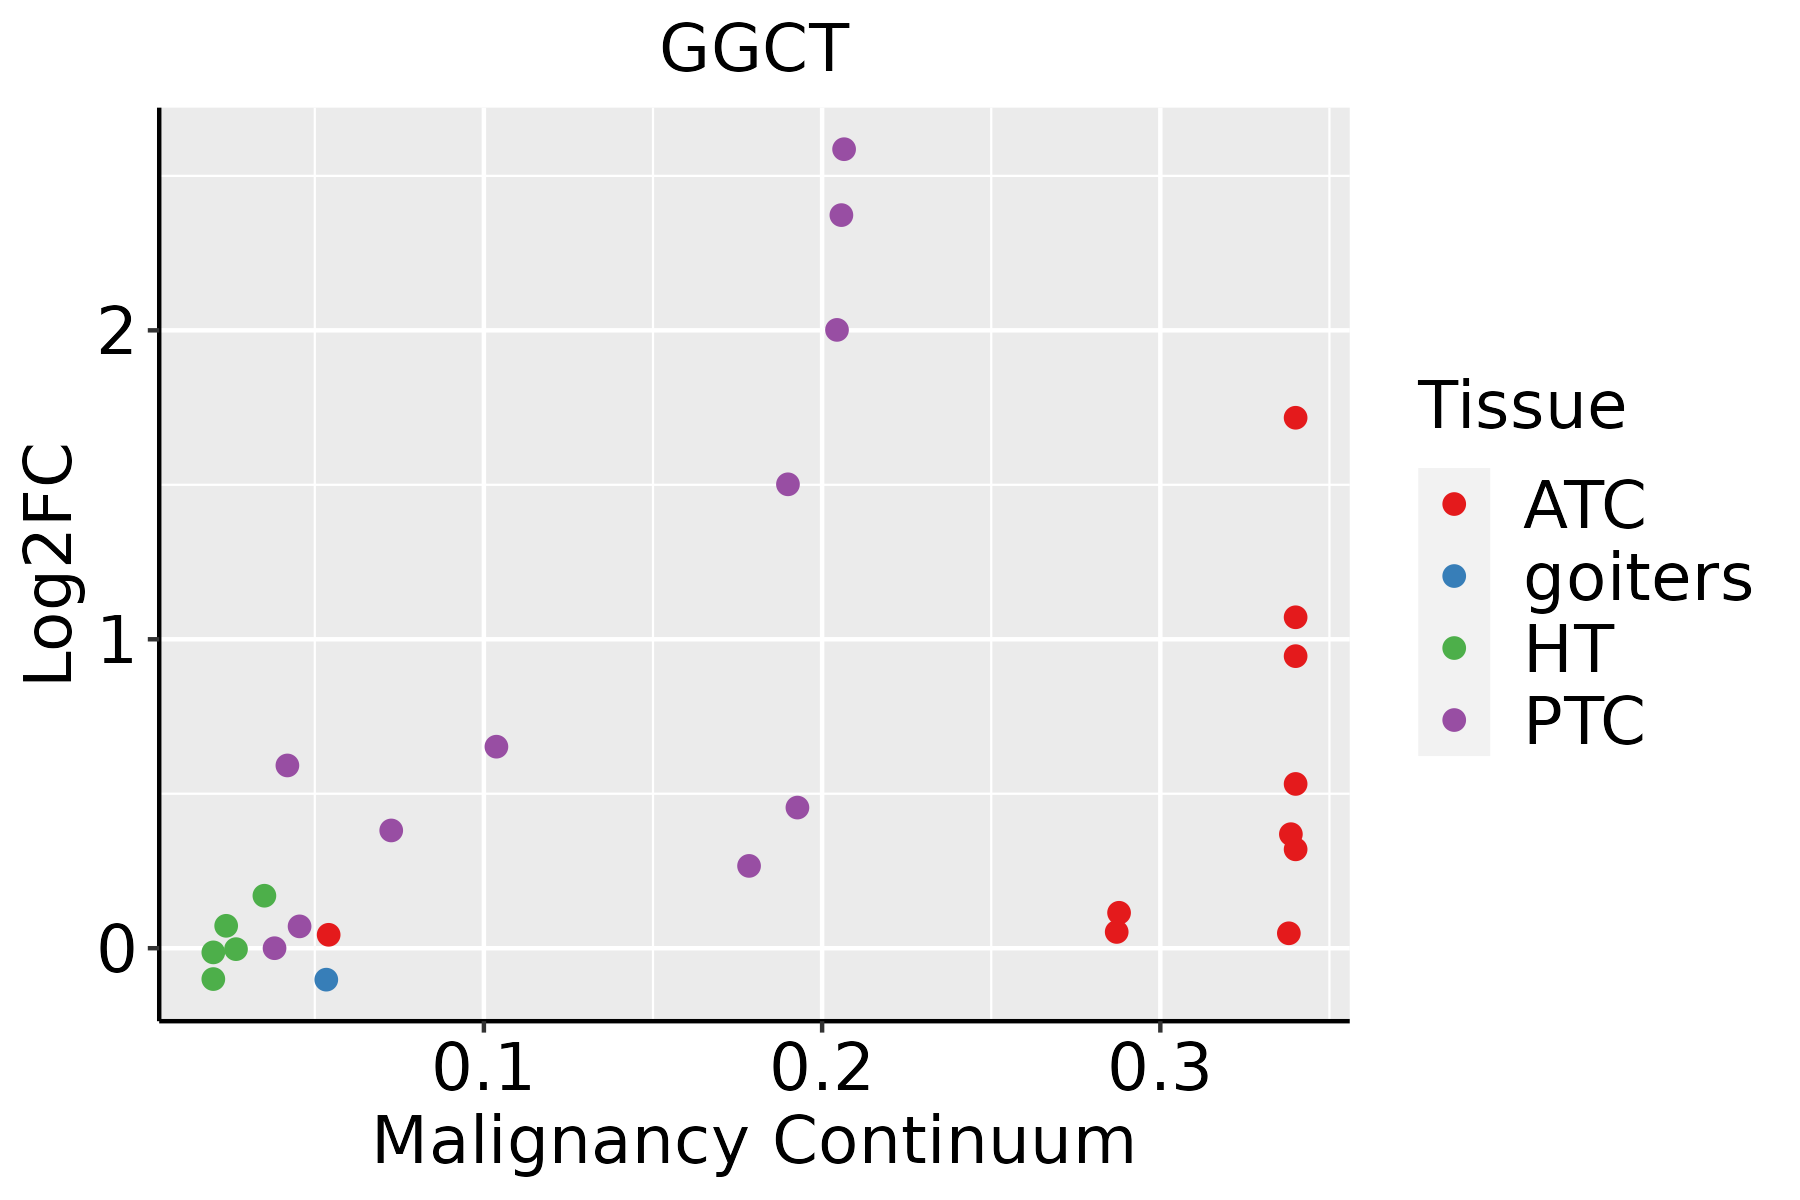 | ATC: Anaplastic thyroid cancer |
| HT: Hashimoto's thyroiditis | ||
| PTC: Papillary thyroid cancer |
| ∗log2FC in expression of this searched gene in stem-like cells from each diseased tissue sample relative to stem-like cells in normal samples in each tissue plotted against the malignancy continuum. Samples are colored based on if they are from different disease stage. |
Top |
Malignant transformation related pathway analysis |
| Find out the enriched GO biological processes and KEGG pathways involved in transition from healthy to precancer to cancer |
| Tissue | Disease Stage | Enriched GO biological Processes |
| Colorectum | AD |  |
| Colorectum | SER |  |
| Colorectum | MSS |  |
| Colorectum | MSI-H |  |
| Colorectum | FAP |  |
| ∗Top 15 enriched GO BP terms are showed in the bar plot of each disease state in each tissue. Each row represents a significant GO biological process which is colored according to the -log10(p.adjust). |
| Page: 1 2 3 4 5 6 7 8 9 |
| GO ID | Tissue | Disease Stage | Description | Gene Ratio | Bg Ratio | pvalue | p.adjust | Count |
| GO:000863718 | Oral cavity | OSCC | apoptotic mitochondrial changes | 78/7305 | 107/18723 | 1.06e-12 | 4.78e-11 | 78 |
| GO:000183616 | Oral cavity | OSCC | release of cytochrome c from mitochondria | 46/7305 | 59/18723 | 1.17e-09 | 2.87e-08 | 46 |
| GO:000183617 | Oral cavity | LP | release of cytochrome c from mitochondria | 34/4623 | 59/18723 | 6.91e-08 | 2.33e-06 | 34 |
| GO:000863719 | Oral cavity | LP | apoptotic mitochondrial changes | 51/4623 | 107/18723 | 2.07e-07 | 6.33e-06 | 51 |
| GO:000863716 | Prostate | BPH | apoptotic mitochondrial changes | 35/3107 | 107/18723 | 3.17e-05 | 3.60e-04 | 35 |
| GO:000183610 | Prostate | BPH | release of cytochrome c from mitochondria | 21/3107 | 59/18723 | 3.20e-04 | 2.43e-03 | 21 |
| GO:000863717 | Prostate | Tumor | apoptotic mitochondrial changes | 36/3246 | 107/18723 | 3.26e-05 | 3.86e-04 | 36 |
| GO:000183615 | Prostate | Tumor | release of cytochrome c from mitochondria | 22/3246 | 59/18723 | 2.05e-04 | 1.79e-03 | 22 |
| GO:000863725 | Skin | AK | apoptotic mitochondrial changes | 24/1910 | 107/18723 | 1.61e-04 | 1.90e-03 | 24 |
| GO:000183620 | Skin | AK | release of cytochrome c from mitochondria | 13/1910 | 59/18723 | 5.70e-03 | 3.12e-02 | 13 |
| GO:000863726 | Skin | cSCC | apoptotic mitochondrial changes | 55/4864 | 107/18723 | 1.63e-08 | 4.91e-07 | 55 |
| GO:0001836110 | Skin | cSCC | release of cytochrome c from mitochondria | 33/4864 | 59/18723 | 9.93e-07 | 1.78e-05 | 33 |
| GO:000863727 | Thyroid | PTC | apoptotic mitochondrial changes | 57/5968 | 107/18723 | 3.54e-06 | 4.55e-05 | 57 |
| GO:000183625 | Thyroid | PTC | release of cytochrome c from mitochondria | 32/5968 | 59/18723 | 3.06e-04 | 2.14e-03 | 32 |
| GO:0008637112 | Thyroid | ATC | apoptotic mitochondrial changes | 59/6293 | 107/18723 | 3.69e-06 | 4.10e-05 | 59 |
| GO:0001836111 | Thyroid | ATC | release of cytochrome c from mitochondria | 34/6293 | 59/18723 | 1.29e-04 | 9.10e-04 | 34 |
| Page: 1 2 |
| Pathway ID | Tissue | Disease Stage | Description | Gene Ratio | Bg Ratio | pvalue | p.adjust | qvalue | Count |
| hsa0048010 | Breast | Precancer | Glutathione metabolism | 12/684 | 57/8465 | 1.68e-03 | 1.08e-02 | 8.30e-03 | 12 |
| hsa0048013 | Breast | Precancer | Glutathione metabolism | 12/684 | 57/8465 | 1.68e-03 | 1.08e-02 | 8.30e-03 | 12 |
| hsa0048023 | Breast | IDC | Glutathione metabolism | 13/867 | 57/8465 | 4.25e-03 | 2.56e-02 | 1.91e-02 | 13 |
| hsa0048033 | Breast | IDC | Glutathione metabolism | 13/867 | 57/8465 | 4.25e-03 | 2.56e-02 | 1.91e-02 | 13 |
| hsa0048041 | Breast | DCIS | Glutathione metabolism | 13/846 | 57/8465 | 3.44e-03 | 1.98e-02 | 1.46e-02 | 13 |
| hsa0048051 | Breast | DCIS | Glutathione metabolism | 13/846 | 57/8465 | 3.44e-03 | 1.98e-02 | 1.46e-02 | 13 |
| hsa00480 | Colorectum | AD | Glutathione metabolism | 23/2092 | 57/8465 | 6.52e-03 | 2.76e-02 | 1.76e-02 | 23 |
| hsa004801 | Colorectum | AD | Glutathione metabolism | 23/2092 | 57/8465 | 6.52e-03 | 2.76e-02 | 1.76e-02 | 23 |
| hsa004802 | Colorectum | MSS | Glutathione metabolism | 22/1875 | 57/8465 | 3.58e-03 | 1.64e-02 | 1.01e-02 | 22 |
| hsa004803 | Colorectum | MSS | Glutathione metabolism | 22/1875 | 57/8465 | 3.58e-03 | 1.64e-02 | 1.01e-02 | 22 |
| hsa0048018 | Esophagus | ESCC | Glutathione metabolism | 44/4205 | 57/8465 | 1.81e-05 | 9.03e-05 | 4.63e-05 | 44 |
| hsa0048019 | Esophagus | ESCC | Glutathione metabolism | 44/4205 | 57/8465 | 1.81e-05 | 9.03e-05 | 4.63e-05 | 44 |
| hsa004809 | Liver | Cirrhotic | Glutathione metabolism | 30/2530 | 57/8465 | 2.63e-04 | 1.72e-03 | 1.06e-03 | 30 |
| hsa0048012 | Liver | Cirrhotic | Glutathione metabolism | 30/2530 | 57/8465 | 2.63e-04 | 1.72e-03 | 1.06e-03 | 30 |
| hsa0048022 | Liver | HCC | Glutathione metabolism | 42/4020 | 57/8465 | 5.00e-05 | 2.62e-04 | 1.46e-04 | 42 |
| hsa0048032 | Liver | HCC | Glutathione metabolism | 42/4020 | 57/8465 | 5.00e-05 | 2.62e-04 | 1.46e-04 | 42 |
| hsa0048016 | Oral cavity | OSCC | Glutathione metabolism | 36/3704 | 57/8465 | 2.41e-03 | 6.41e-03 | 3.26e-03 | 36 |
| hsa0048017 | Oral cavity | OSCC | Glutathione metabolism | 36/3704 | 57/8465 | 2.41e-03 | 6.41e-03 | 3.26e-03 | 36 |
| hsa0048024 | Oral cavity | LP | Glutathione metabolism | 25/2418 | 57/8465 | 9.58e-03 | 3.47e-02 | 2.24e-02 | 25 |
| hsa0048034 | Oral cavity | LP | Glutathione metabolism | 25/2418 | 57/8465 | 9.58e-03 | 3.47e-02 | 2.24e-02 | 25 |
| Page: 1 2 |
Top |
Cell-cell communication analysis |
| Identification of potential cell-cell interactions between two cell types and their ligand-receptor pairs for different disease states |
| Ligand | Receptor | LRpair | Pathway | Tissue | Disease Stage |
| Page: 1 |
Top |
Single-cell gene regulatory network inference analysis |
| Find out the significant the regulons (TFs) and the target genes of each regulon across cell types for different disease states |
| TF | Cell Type | Tissue | Disease Stage | Target Gene | RSS | Regulon Activity |
| ∗The dot plots of a searched regulon are shown for all cell subpopulations in each disease state of each tissue based on the regulon specific score inferred using pySCENIC and by calculating the average expression. |
| Page: 1 |
Top |
Somatic mutation of malignant transformation related genes |
| Annotation of somatic variants for genes involved in malignant transformation |
| Hugo Symbol | Variant Class | Variant Classification | dbSNP RS | HGVSc | HGVSp | HGVSp Short | SWISSPROT | BIOTYPE | SIFT | PolyPhen | Tumor Sample Barcode | Tissue | Histology | Sex | Age | Stage | Therapy Types | Drugs | Outcome |
| GGCT | SNV | Missense_Mutation | c.403N>A | p.Pro135Thr | p.P135T | O75223 | protein_coding | tolerated(0.07) | probably_damaging(0.931) | TCGA-A7-A0DB-01 | Breast | breast invasive carcinoma | Female | <65 | I/II | Hormone Therapy | arimidex | SD | |
| GGCT | SNV | Missense_Mutation | novel | c.67N>T | p.Gly23Cys | p.G23C | O75223 | protein_coding | deleterious(0) | probably_damaging(1) | TCGA-A7-A26I-01 | Breast | breast invasive carcinoma | Female | >=65 | I/II | Chemotherapy | cytoxan | SD |
| GGCT | SNV | Missense_Mutation | c.520G>A | p.Glu174Lys | p.E174K | O75223 | protein_coding | tolerated(0.1) | benign(0.006) | TCGA-AO-A0JC-01 | Breast | breast invasive carcinoma | Female | <65 | I/II | Chemotherapy | fluorouracil | SD | |
| GGCT | SNV | Missense_Mutation | c.474N>T | p.Glu158Asp | p.E158D | O75223 | protein_coding | tolerated(0.12) | benign(0) | TCGA-CA-6718-01 | Colorectum | colon adenocarcinoma | Male | <65 | I/II | Unknown | Unknown | PD | |
| GGCT | SNV | Missense_Mutation | c.338N>A | p.Ala113Glu | p.A113E | O75223 | protein_coding | tolerated(1) | benign(0.007) | TCGA-CM-6172-01 | Colorectum | colon adenocarcinoma | Female | >=65 | III/IV | Ancillary | leucovorin | SD | |
| GGCT | SNV | Missense_Mutation | c.403C>A | p.Pro135Thr | p.P135T | O75223 | protein_coding | tolerated(0.07) | probably_damaging(0.931) | TCGA-G4-6588-01 | Colorectum | colon adenocarcinoma | Female | <65 | I/II | Unknown | Unknown | SD | |
| GGCT | SNV | Missense_Mutation | c.145N>G | p.Phe49Val | p.F49V | O75223 | protein_coding | deleterious(0) | possibly_damaging(0.498) | TCGA-AG-3892-01 | Colorectum | rectum adenocarcinoma | Female | <65 | I/II | Unknown | Unknown | SD | |
| GGCT | SNV | Missense_Mutation | rs776460145 | c.278C>A | p.Ser93Tyr | p.S93Y | O75223 | protein_coding | deleterious(0) | probably_damaging(0.98) | TCGA-F5-6814-01 | Colorectum | rectum adenocarcinoma | Male | <65 | I/II | Unknown | Unknown | SD |
| GGCT | SNV | Missense_Mutation | novel | c.142N>A | p.Asp48Asn | p.D48N | O75223 | protein_coding | tolerated(0.2) | benign(0.125) | TCGA-AP-A1DK-01 | Endometrium | uterine corpus endometrioid carcinoma | Female | <65 | I/II | Unknown | Unknown | SD |
| GGCT | SNV | Missense_Mutation | c.224C>A | p.Pro75His | p.P75H | O75223 | protein_coding | deleterious(0) | benign(0.265) | TCGA-B5-A11E-01 | Endometrium | uterine corpus endometrioid carcinoma | Female | <65 | I/II | Unknown | Unknown | SD |
| Page: 1 2 3 |
Top |
Related drugs of malignant transformation related genes |
| Identification of chemicals and drugs interact with genes involved in malignant transfromation |
| (DGIdb 4.0) |
| Entrez ID | Symbol | Category | Interaction Types | Drug Claim Name | Drug Name | PMIDs |
| 79017 | GGCT | ENZYME | inhibitor | 381744946 |
| Page: 1 |

Copyright 2023-Present -The University of Texas Health Science Center at Houston |