
|
|||||
|
 | |
| |
| |
| |
| |
| |
|
Gene: GEMIN8 |
Gene summary for GEMIN8 |
| Gene information | Species | Human | Gene symbol | GEMIN8 | Gene ID | 54960 |
| Gene name | gem nuclear organelle associated protein 8 | |
| Gene Alias | FAM51A1 | |
| Cytomap | Xp22.2 | |
| Gene Type | protein-coding | GO ID | GO:0000375 | UniProtAcc | A0A024RBX2 |
Top |
Malignant transformation analysis |
| Identification of the aberrant gene expression in precancerous and cancerous lesions by comparing the gene expression of stem-like cells in diseased tissues with normal stem cells |
| Entrez ID | Symbol | Replicates | Species | Organ | Tissue | Adj P-value | Log2FC | Malignancy |
| 54960 | GEMIN8 | LZE4T | Human | Esophagus | ESCC | 2.82e-05 | 1.60e-01 | 0.0811 |
| 54960 | GEMIN8 | LZE8T | Human | Esophagus | ESCC | 3.70e-03 | 1.39e-01 | 0.067 |
| 54960 | GEMIN8 | LZE6T | Human | Esophagus | ESCC | 7.28e-05 | 3.11e-01 | 0.0845 |
| 54960 | GEMIN8 | P1T-E | Human | Esophagus | ESCC | 5.81e-06 | 2.41e-01 | 0.0875 |
| 54960 | GEMIN8 | P2T-E | Human | Esophagus | ESCC | 1.06e-23 | 3.95e-01 | 0.1177 |
| 54960 | GEMIN8 | P4T-E | Human | Esophagus | ESCC | 3.98e-08 | 2.44e-01 | 0.1323 |
| 54960 | GEMIN8 | P5T-E | Human | Esophagus | ESCC | 3.76e-13 | 1.13e-01 | 0.1327 |
| 54960 | GEMIN8 | P8T-E | Human | Esophagus | ESCC | 2.53e-14 | 3.05e-01 | 0.0889 |
| 54960 | GEMIN8 | P9T-E | Human | Esophagus | ESCC | 5.46e-04 | 1.17e-01 | 0.1131 |
| 54960 | GEMIN8 | P10T-E | Human | Esophagus | ESCC | 5.36e-07 | 7.70e-02 | 0.116 |
| 54960 | GEMIN8 | P11T-E | Human | Esophagus | ESCC | 2.39e-11 | 2.91e-01 | 0.1426 |
| 54960 | GEMIN8 | P12T-E | Human | Esophagus | ESCC | 4.30e-05 | 1.05e-01 | 0.1122 |
| 54960 | GEMIN8 | P15T-E | Human | Esophagus | ESCC | 7.82e-10 | 1.96e-01 | 0.1149 |
| 54960 | GEMIN8 | P16T-E | Human | Esophagus | ESCC | 1.12e-23 | 3.15e-01 | 0.1153 |
| 54960 | GEMIN8 | P17T-E | Human | Esophagus | ESCC | 1.14e-04 | 2.28e-01 | 0.1278 |
| 54960 | GEMIN8 | P19T-E | Human | Esophagus | ESCC | 7.08e-05 | 4.19e-01 | 0.1662 |
| 54960 | GEMIN8 | P20T-E | Human | Esophagus | ESCC | 2.59e-06 | 2.36e-01 | 0.1124 |
| 54960 | GEMIN8 | P21T-E | Human | Esophagus | ESCC | 5.68e-15 | 2.14e-01 | 0.1617 |
| 54960 | GEMIN8 | P22T-E | Human | Esophagus | ESCC | 2.68e-11 | 8.50e-02 | 0.1236 |
| 54960 | GEMIN8 | P23T-E | Human | Esophagus | ESCC | 9.03e-13 | 2.91e-01 | 0.108 |
| Page: 1 2 3 4 |
| Tissue | Expression Dynamics | Abbreviation |
| Esophagus | 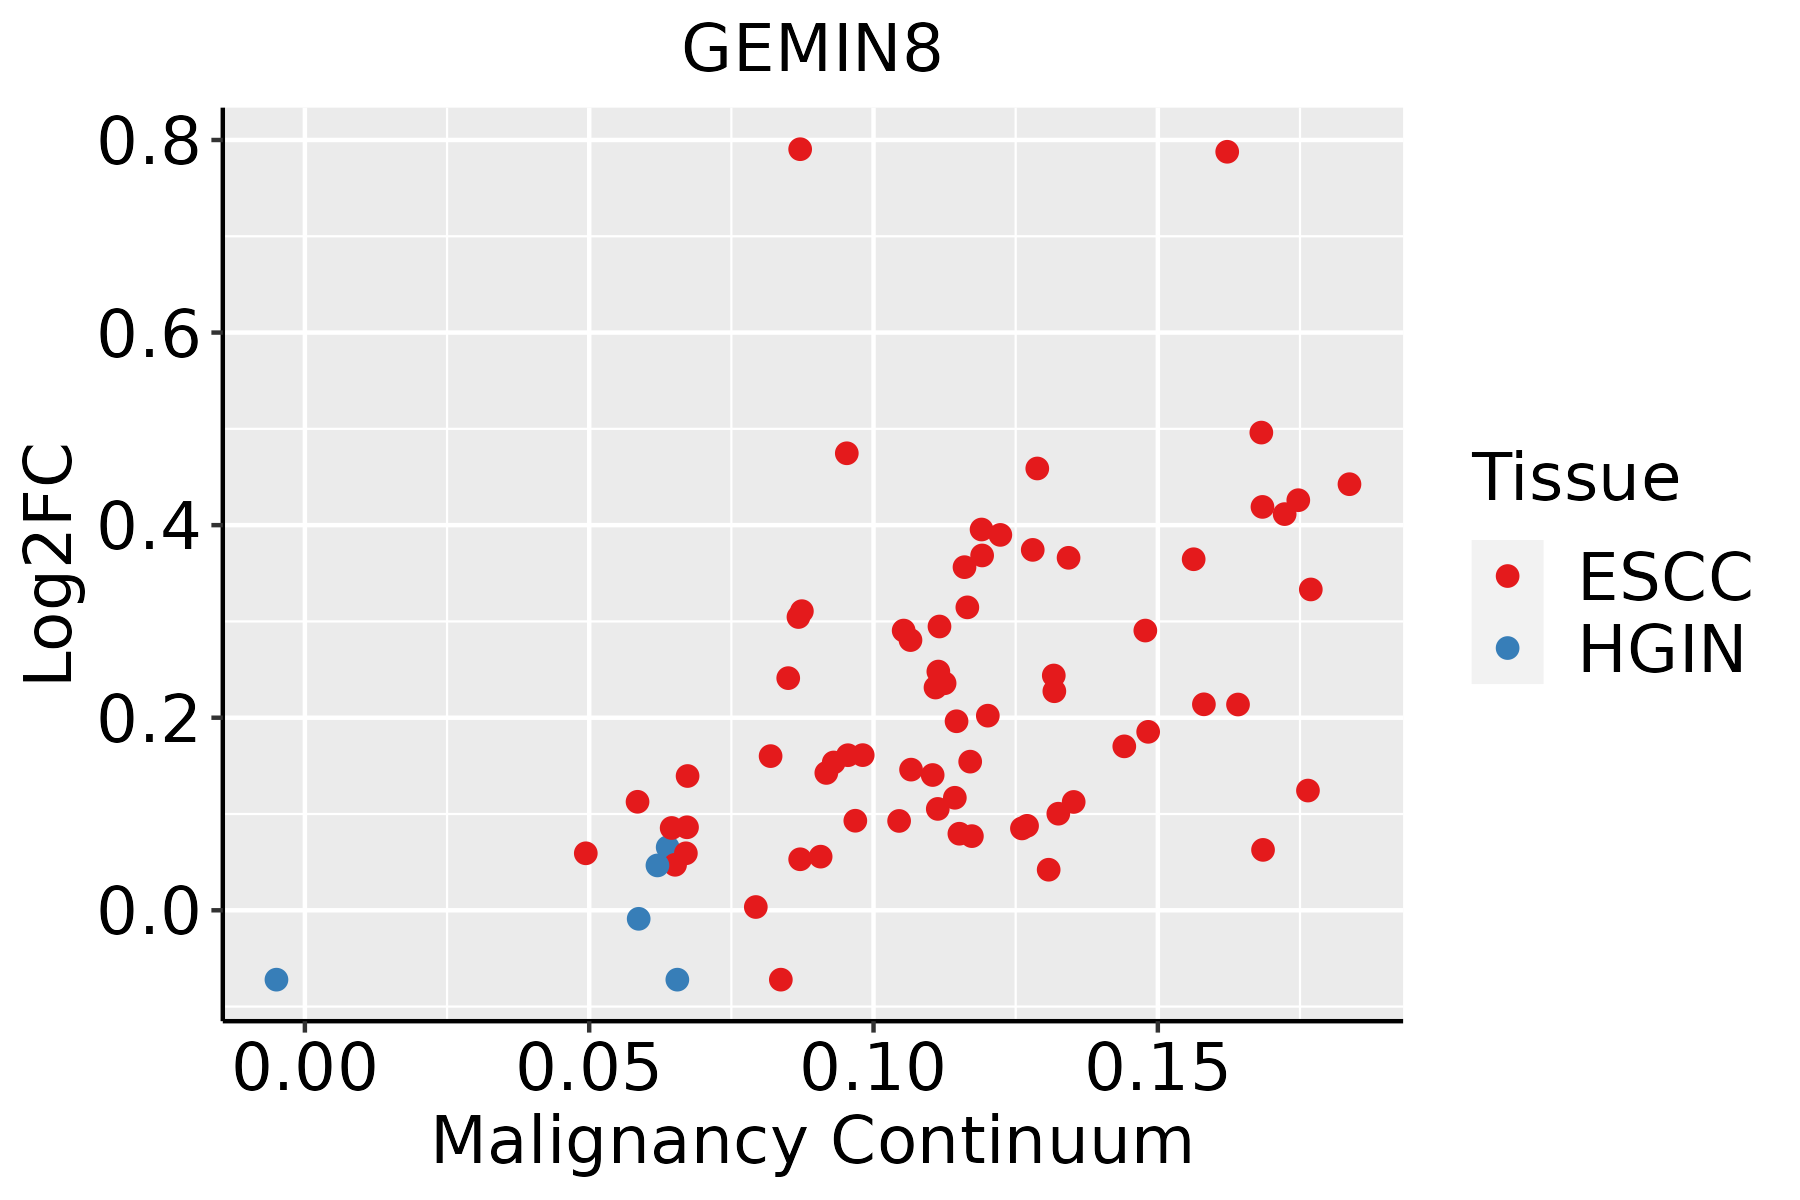 | ESCC: Esophageal squamous cell carcinoma |
| HGIN: High-grade intraepithelial neoplasias | ||
| LGIN: Low-grade intraepithelial neoplasias | ||
| Liver | 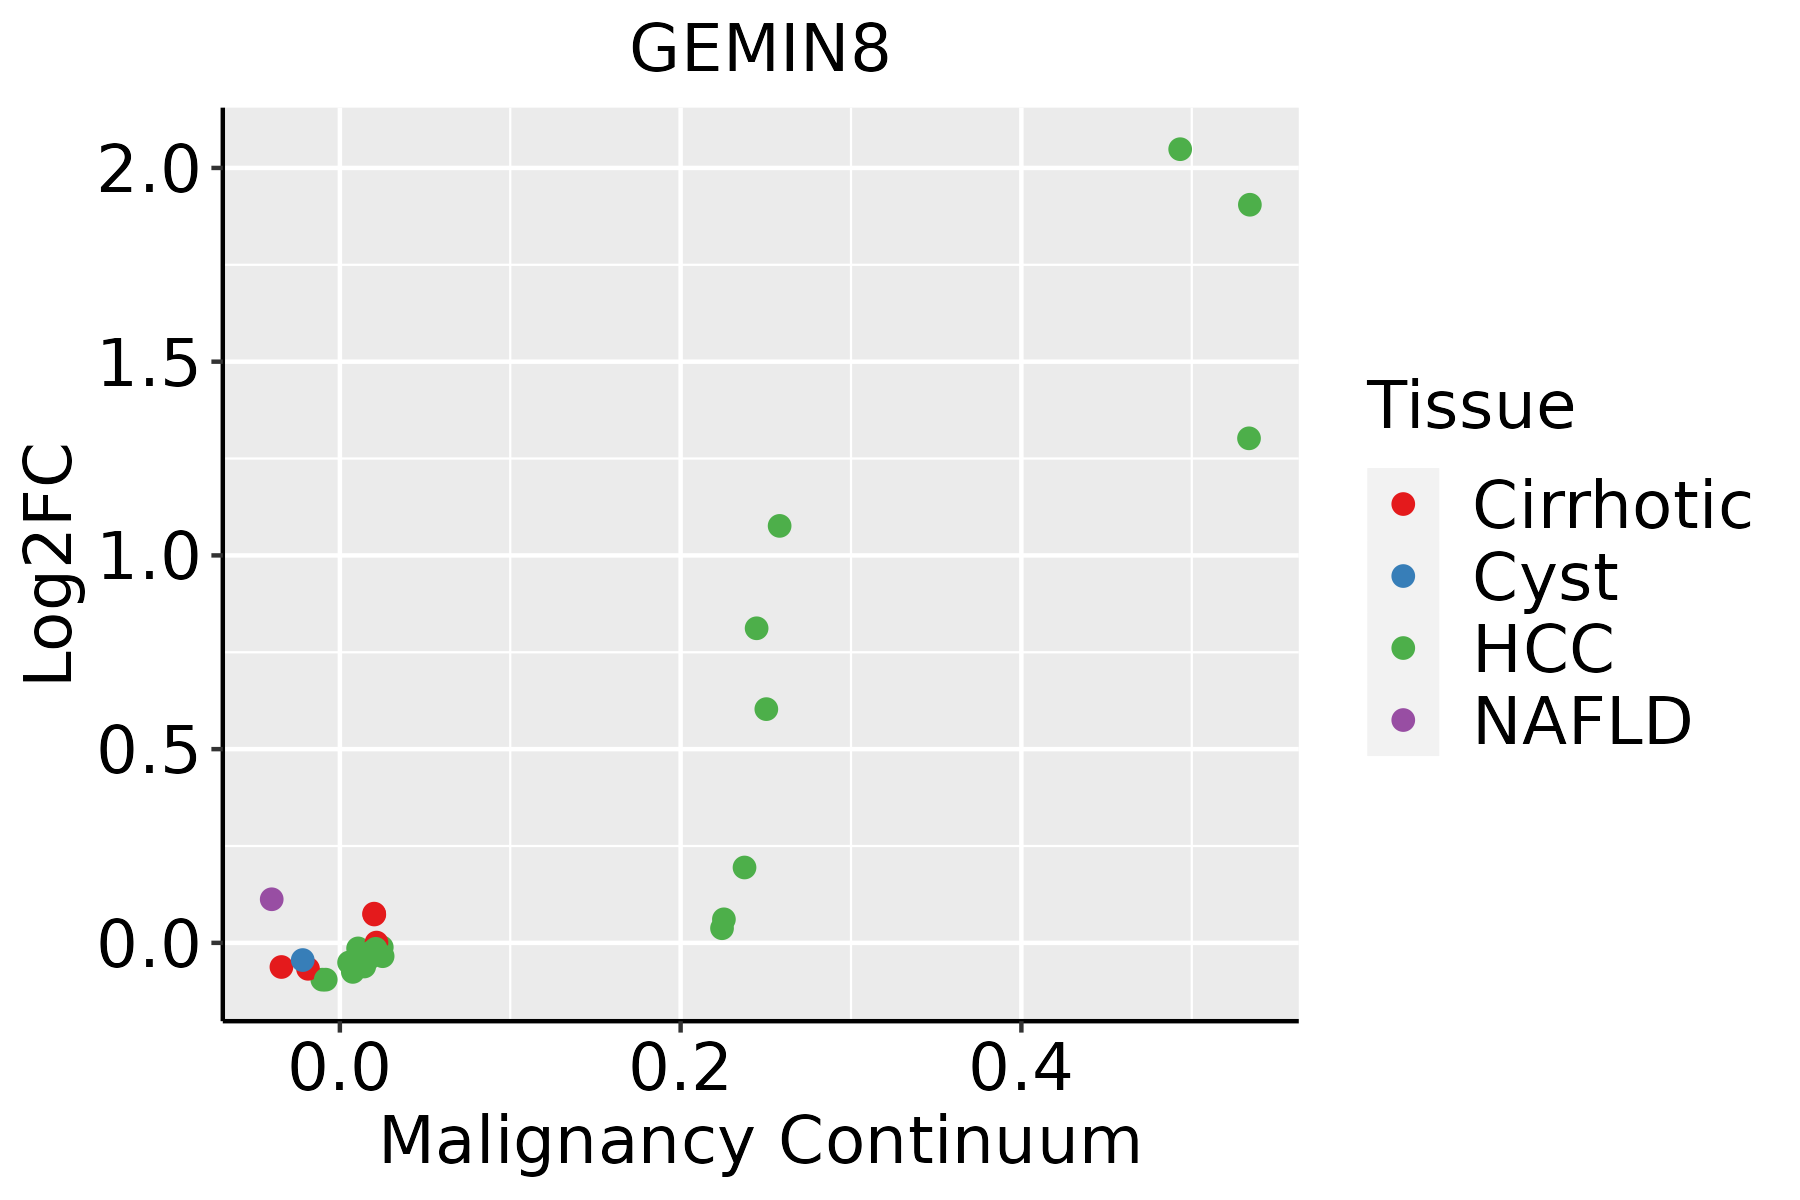 | HCC: Hepatocellular carcinoma |
| NAFLD: Non-alcoholic fatty liver disease | ||
| Oral Cavity |  | EOLP: Erosive Oral lichen planus |
| LP: leukoplakia | ||
| NEOLP: Non-erosive oral lichen planus | ||
| OSCC: Oral squamous cell carcinoma |
| ∗log2FC in expression of this searched gene in stem-like cells from each diseased tissue sample relative to stem-like cells in normal samples in each tissue plotted against the malignancy continuum. Samples are colored based on if they are from different disease stage. |
Top |
Malignant transformation related pathway analysis |
| Find out the enriched GO biological processes and KEGG pathways involved in transition from healthy to precancer to cancer |
| Tissue | Disease Stage | Enriched GO biological Processes |
| Colorectum | AD |  |
| Colorectum | SER |  |
| Colorectum | MSS |  |
| Colorectum | MSI-H |  |
| Colorectum | FAP |  |
| ∗Top 15 enriched GO BP terms are showed in the bar plot of each disease state in each tissue. Each row represents a significant GO biological process which is colored according to the -log10(p.adjust). |
| Page: 1 2 3 4 5 6 7 8 9 |
| GO ID | Tissue | Disease Stage | Description | Gene Ratio | Bg Ratio | pvalue | p.adjust | Count |
| GO:000039819 | Oral cavity | OSCC | mRNA splicing, via spliceosome | 221/7305 | 320/18723 | 5.50e-28 | 2.18e-25 | 221 |
| GO:007182620 | Oral cavity | OSCC | ribonucleoprotein complex subunit organization | 152/7305 | 227/18723 | 1.05e-17 | 1.01e-15 | 152 |
| GO:002261820 | Oral cavity | OSCC | ribonucleoprotein complex assembly | 146/7305 | 220/18723 | 1.53e-16 | 1.23e-14 | 146 |
| GO:00003874 | Oral cavity | OSCC | spliceosomal snRNP assembly | 28/7305 | 50/18723 | 1.10e-02 | 3.72e-02 | 28 |
| GO:0022613110 | Oral cavity | LP | ribonucleoprotein complex biogenesis | 259/4623 | 463/18723 | 7.20e-48 | 2.25e-44 | 259 |
| GO:0008380110 | Oral cavity | LP | RNA splicing | 237/4623 | 434/18723 | 1.82e-41 | 3.79e-38 | 237 |
| GO:0000375110 | Oral cavity | LP | RNA splicing, via transesterification reactions | 181/4623 | 324/18723 | 1.36e-33 | 1.70e-30 | 181 |
| GO:0000377110 | Oral cavity | LP | RNA splicing, via transesterification reactions with bulged adenosine as nucleophile | 179/4623 | 320/18723 | 2.48e-33 | 2.22e-30 | 179 |
| GO:0000398110 | Oral cavity | LP | mRNA splicing, via spliceosome | 179/4623 | 320/18723 | 2.48e-33 | 2.22e-30 | 179 |
| GO:0071826110 | Oral cavity | LP | ribonucleoprotein complex subunit organization | 130/4623 | 227/18723 | 7.54e-26 | 3.63e-23 | 130 |
| GO:0022618110 | Oral cavity | LP | ribonucleoprotein complex assembly | 125/4623 | 220/18723 | 1.76e-24 | 6.91e-22 | 125 |
| GO:000038712 | Oral cavity | LP | spliceosomal snRNP assembly | 25/4623 | 50/18723 | 9.66e-05 | 1.20e-03 | 25 |
| Page: 1 2 |
| Pathway ID | Tissue | Disease Stage | Description | Gene Ratio | Bg Ratio | pvalue | p.adjust | qvalue | Count |
| Page: 1 |
Top |
Cell-cell communication analysis |
| Identification of potential cell-cell interactions between two cell types and their ligand-receptor pairs for different disease states |
| Ligand | Receptor | LRpair | Pathway | Tissue | Disease Stage |
| Page: 1 |
Top |
Single-cell gene regulatory network inference analysis |
| Find out the significant the regulons (TFs) and the target genes of each regulon across cell types for different disease states |
| TF | Cell Type | Tissue | Disease Stage | Target Gene | RSS | Regulon Activity |
| ∗The dot plots of a searched regulon are shown for all cell subpopulations in each disease state of each tissue based on the regulon specific score inferred using pySCENIC and by calculating the average expression. |
| Page: 1 |
Top |
Somatic mutation of malignant transformation related genes |
| Annotation of somatic variants for genes involved in malignant transformation |
| Hugo Symbol | Variant Class | Variant Classification | dbSNP RS | HGVSc | HGVSp | HGVSp Short | SWISSPROT | BIOTYPE | SIFT | PolyPhen | Tumor Sample Barcode | Tissue | Histology | Sex | Age | Stage | Therapy Types | Drugs | Outcome |
| GEMIN8 | SNV | Missense_Mutation | c.451G>A | p.Glu151Lys | p.E151K | Q9NWZ8 | protein_coding | deleterious(0.02) | possibly_damaging(0.731) | TCGA-A2-A0CX-01 | Breast | breast invasive carcinoma | Female | <65 | I/II | Chemotherapy | adriamycin | SD | |
| GEMIN8 | SNV | Missense_Mutation | novel | c.623N>C | p.Ser208Thr | p.S208T | Q9NWZ8 | protein_coding | deleterious(0.04) | possibly_damaging(0.623) | TCGA-A8-A09E-01 | Breast | breast invasive carcinoma | Female | >=65 | III/IV | Hormone Therapy | anastrozole | SD |
| GEMIN8 | SNV | Missense_Mutation | novel | c.628N>A | p.Ala210Thr | p.A210T | Q9NWZ8 | protein_coding | tolerated(0.17) | benign(0.243) | TCGA-AC-A62V-01 | Breast | breast invasive carcinoma | Male | <65 | III/IV | Targeted Molecular therapy | denosumab | PD |
| GEMIN8 | SNV | Missense_Mutation | rs188311510 | c.26C>T | p.Ser9Leu | p.S9L | Q9NWZ8 | protein_coding | tolerated(0.66) | benign(0) | TCGA-AN-A046-01 | Breast | breast invasive carcinoma | Female | >=65 | I/II | Unknown | Unknown | SD |
| GEMIN8 | insertion | Nonsense_Mutation | novel | c.620_621insAAAGAAAAAAAAAAAAGAACAATAATTCCCAAACCTGGT | p.Asp207delinsGluLysLysLysLysLysGluGlnTerPheProAsnLeuVal | p.D207delinsEKKKKKEQ*FPNLV | Q9NWZ8 | protein_coding | TCGA-A8-A09E-01 | Breast | breast invasive carcinoma | Female | >=65 | III/IV | Hormone Therapy | anastrozole | SD | ||
| GEMIN8 | SNV | Missense_Mutation | c.589N>T | p.Arg197Cys | p.R197C | Q9NWZ8 | protein_coding | deleterious(0.04) | probably_damaging(1) | TCGA-2W-A8YY-01 | Cervix | cervical & endocervical cancer | Female | <65 | I/II | Chemotherapy | cisplatin | CR | |
| GEMIN8 | SNV | Missense_Mutation | novel | c.377N>T | p.Ser126Leu | p.S126L | Q9NWZ8 | protein_coding | deleterious(0) | probably_damaging(0.967) | TCGA-ZJ-A8QO-01 | Cervix | cervical & endocervical cancer | Female | >=65 | I/II | Unknown | Unknown | SD |
| GEMIN8 | SNV | Missense_Mutation | rs753453623 | c.619G>A | p.Asp207Asn | p.D207N | Q9NWZ8 | protein_coding | tolerated(0.34) | benign(0.007) | TCGA-AZ-4315-01 | Colorectum | colon adenocarcinoma | Male | <65 | I/II | Unknown | Unknown | SD |
| GEMIN8 | SNV | Missense_Mutation | c.184N>G | p.Pro62Ala | p.P62A | Q9NWZ8 | protein_coding | tolerated(0.13) | benign(0.007) | TCGA-CK-4950-01 | Colorectum | colon adenocarcinoma | Female | >=65 | III/IV | Chemotherapy | folfox | SD | |
| GEMIN8 | SNV | Missense_Mutation | c.520N>A | p.Ala174Thr | p.A174T | Q9NWZ8 | protein_coding | deleterious(0) | probably_damaging(1) | TCGA-CK-4951-01 | Colorectum | colon adenocarcinoma | Female | >=65 | I/II | Unknown | Unknown | PD |
| Page: 1 2 3 4 |
Top |
Related drugs of malignant transformation related genes |
| Identification of chemicals and drugs interact with genes involved in malignant transfromation |
| (DGIdb 4.0) |
| Entrez ID | Symbol | Category | Interaction Types | Drug Claim Name | Drug Name | PMIDs |
| Page: 1 |

Copyright 2023-Present -The University of Texas Health Science Center at Houston |