
|
|||||
|
 | |
| |
| |
| |
| |
| |
|
Gene: FUNDC1 |
Gene summary for FUNDC1 |
| Gene information | Species | Human | Gene symbol | FUNDC1 | Gene ID | 139341 |
| Gene name | FUN14 domain containing 1 | |
| Gene Alias | FUNDC1 | |
| Cytomap | Xp11.3 | |
| Gene Type | protein-coding | GO ID | GO:0000422 | UniProtAcc | Q8IVP5 |
Top |
Malignant transformation analysis |
| Identification of the aberrant gene expression in precancerous and cancerous lesions by comparing the gene expression of stem-like cells in diseased tissues with normal stem cells |
| Entrez ID | Symbol | Replicates | Species | Organ | Tissue | Adj P-value | Log2FC | Malignancy |
| 139341 | FUNDC1 | LZE4T | Human | Esophagus | ESCC | 7.31e-13 | 3.40e-01 | 0.0811 |
| 139341 | FUNDC1 | LZE20T | Human | Esophagus | ESCC | 2.42e-02 | 1.71e-01 | 0.0662 |
| 139341 | FUNDC1 | LZE24T | Human | Esophagus | ESCC | 1.36e-07 | 2.33e-01 | 0.0596 |
| 139341 | FUNDC1 | LZE21T | Human | Esophagus | ESCC | 2.09e-04 | 2.41e-01 | 0.0655 |
| 139341 | FUNDC1 | P1T-E | Human | Esophagus | ESCC | 3.18e-04 | 3.40e-01 | 0.0875 |
| 139341 | FUNDC1 | P2T-E | Human | Esophagus | ESCC | 1.98e-23 | 5.08e-01 | 0.1177 |
| 139341 | FUNDC1 | P4T-E | Human | Esophagus | ESCC | 1.38e-38 | 9.42e-01 | 0.1323 |
| 139341 | FUNDC1 | P5T-E | Human | Esophagus | ESCC | 1.25e-15 | 3.15e-01 | 0.1327 |
| 139341 | FUNDC1 | P8T-E | Human | Esophagus | ESCC | 8.17e-50 | 8.86e-01 | 0.0889 |
| 139341 | FUNDC1 | P9T-E | Human | Esophagus | ESCC | 2.02e-18 | 2.74e-01 | 0.1131 |
| 139341 | FUNDC1 | P10T-E | Human | Esophagus | ESCC | 1.68e-17 | 2.98e-01 | 0.116 |
| 139341 | FUNDC1 | P11T-E | Human | Esophagus | ESCC | 3.96e-15 | 7.19e-01 | 0.1426 |
| 139341 | FUNDC1 | P12T-E | Human | Esophagus | ESCC | 2.99e-16 | 2.98e-01 | 0.1122 |
| 139341 | FUNDC1 | P15T-E | Human | Esophagus | ESCC | 2.00e-18 | 3.85e-01 | 0.1149 |
| 139341 | FUNDC1 | P16T-E | Human | Esophagus | ESCC | 4.40e-25 | 4.99e-01 | 0.1153 |
| 139341 | FUNDC1 | P17T-E | Human | Esophagus | ESCC | 4.92e-02 | 2.56e-01 | 0.1278 |
| 139341 | FUNDC1 | P19T-E | Human | Esophagus | ESCC | 2.00e-03 | 2.24e-01 | 0.1662 |
| 139341 | FUNDC1 | P20T-E | Human | Esophagus | ESCC | 5.92e-15 | 3.90e-01 | 0.1124 |
| 139341 | FUNDC1 | P21T-E | Human | Esophagus | ESCC | 5.70e-20 | 3.21e-01 | 0.1617 |
| 139341 | FUNDC1 | P22T-E | Human | Esophagus | ESCC | 3.24e-18 | 2.67e-01 | 0.1236 |
| Page: 1 2 3 4 5 |
| Tissue | Expression Dynamics | Abbreviation |
| Esophagus | 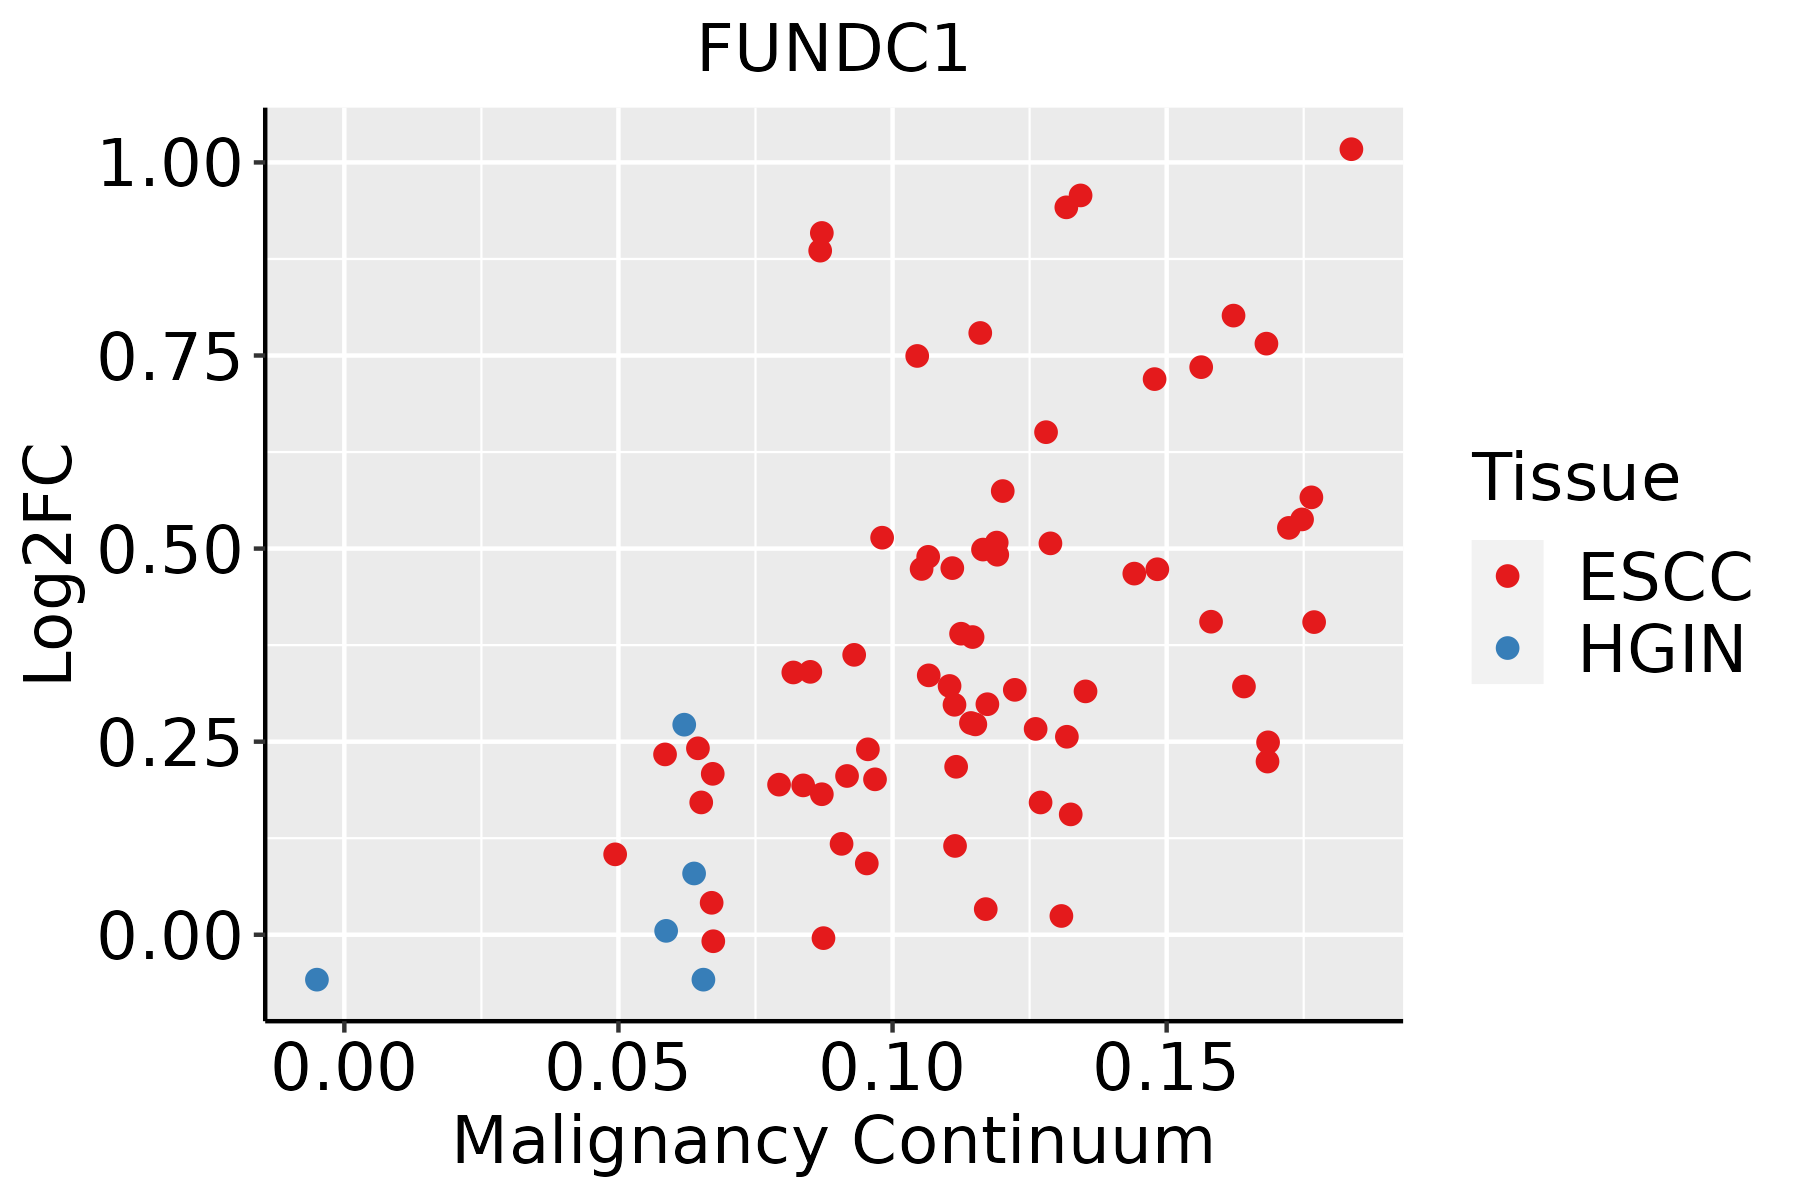 | ESCC: Esophageal squamous cell carcinoma |
| HGIN: High-grade intraepithelial neoplasias | ||
| LGIN: Low-grade intraepithelial neoplasias | ||
| Liver | 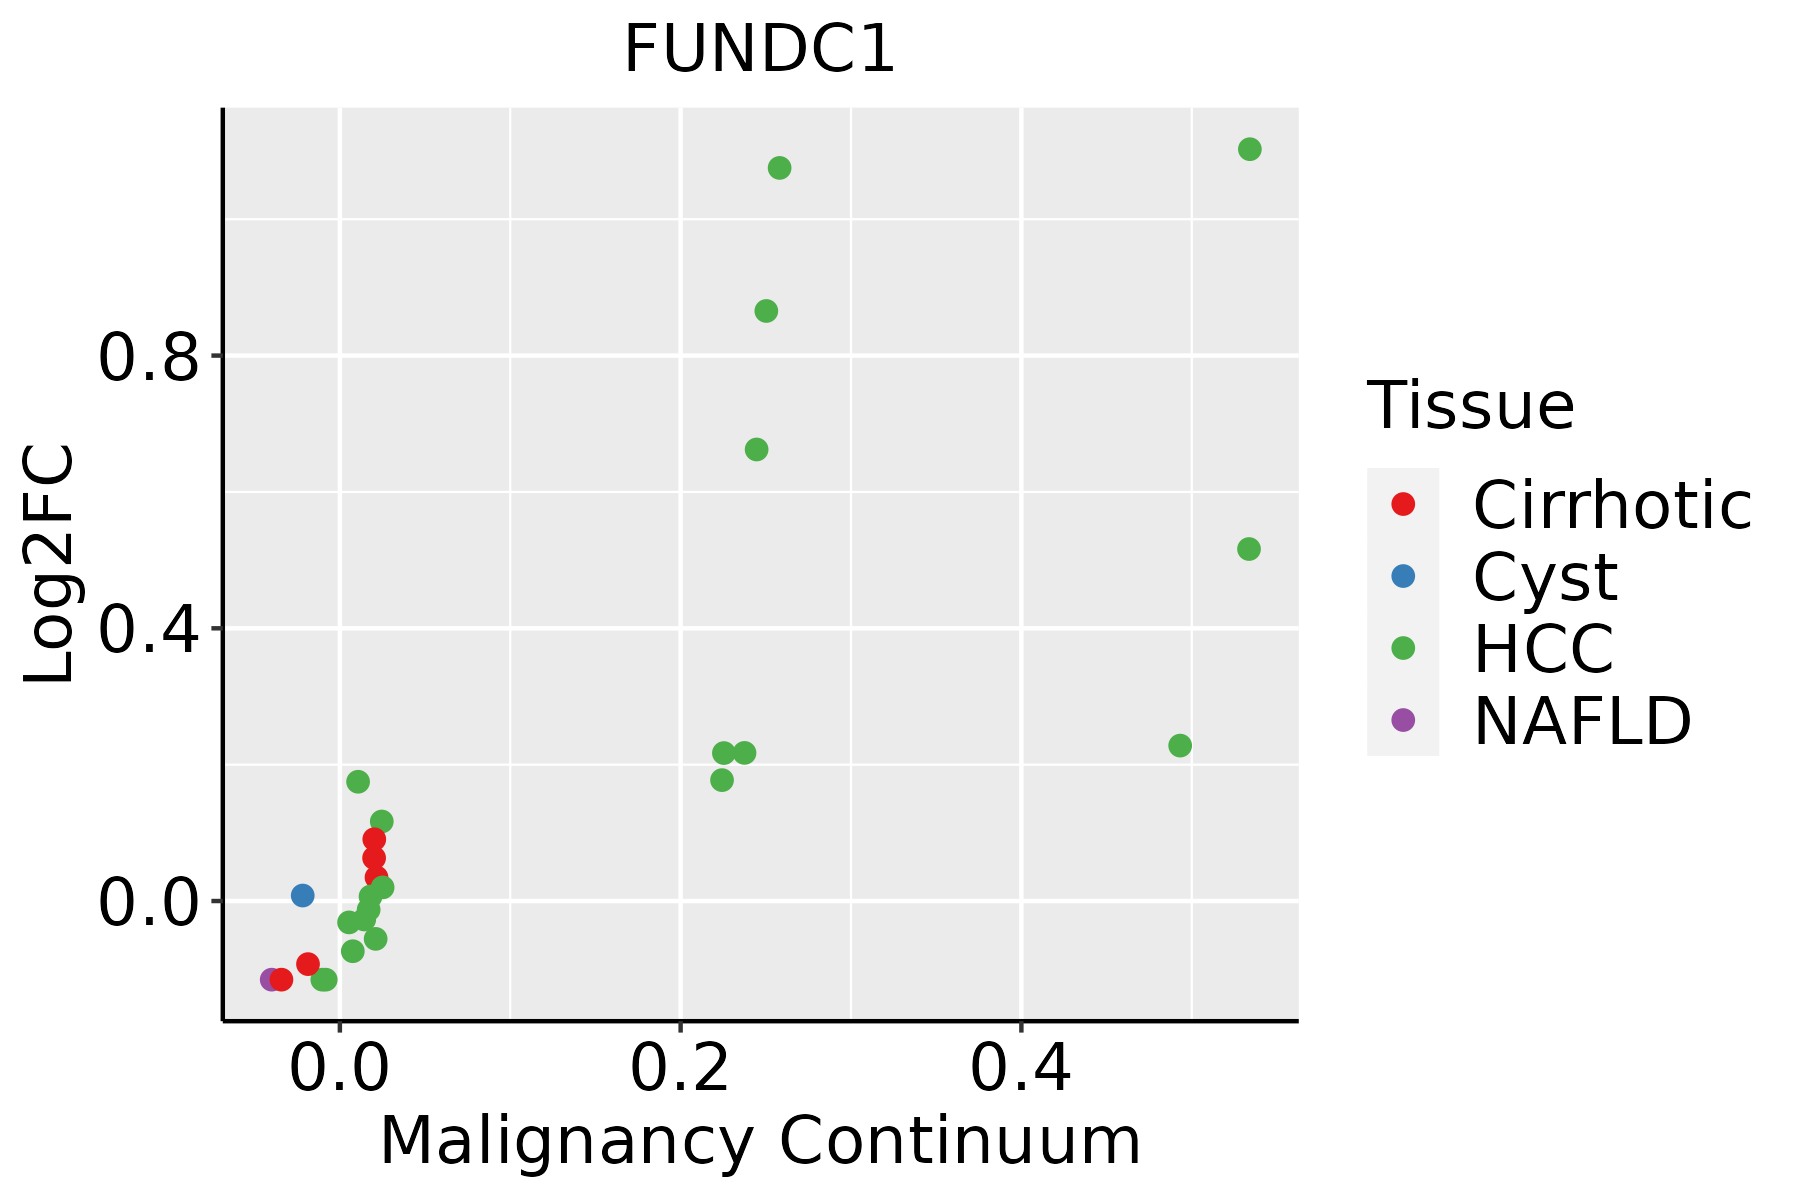 | HCC: Hepatocellular carcinoma |
| NAFLD: Non-alcoholic fatty liver disease | ||
| Oral Cavity | 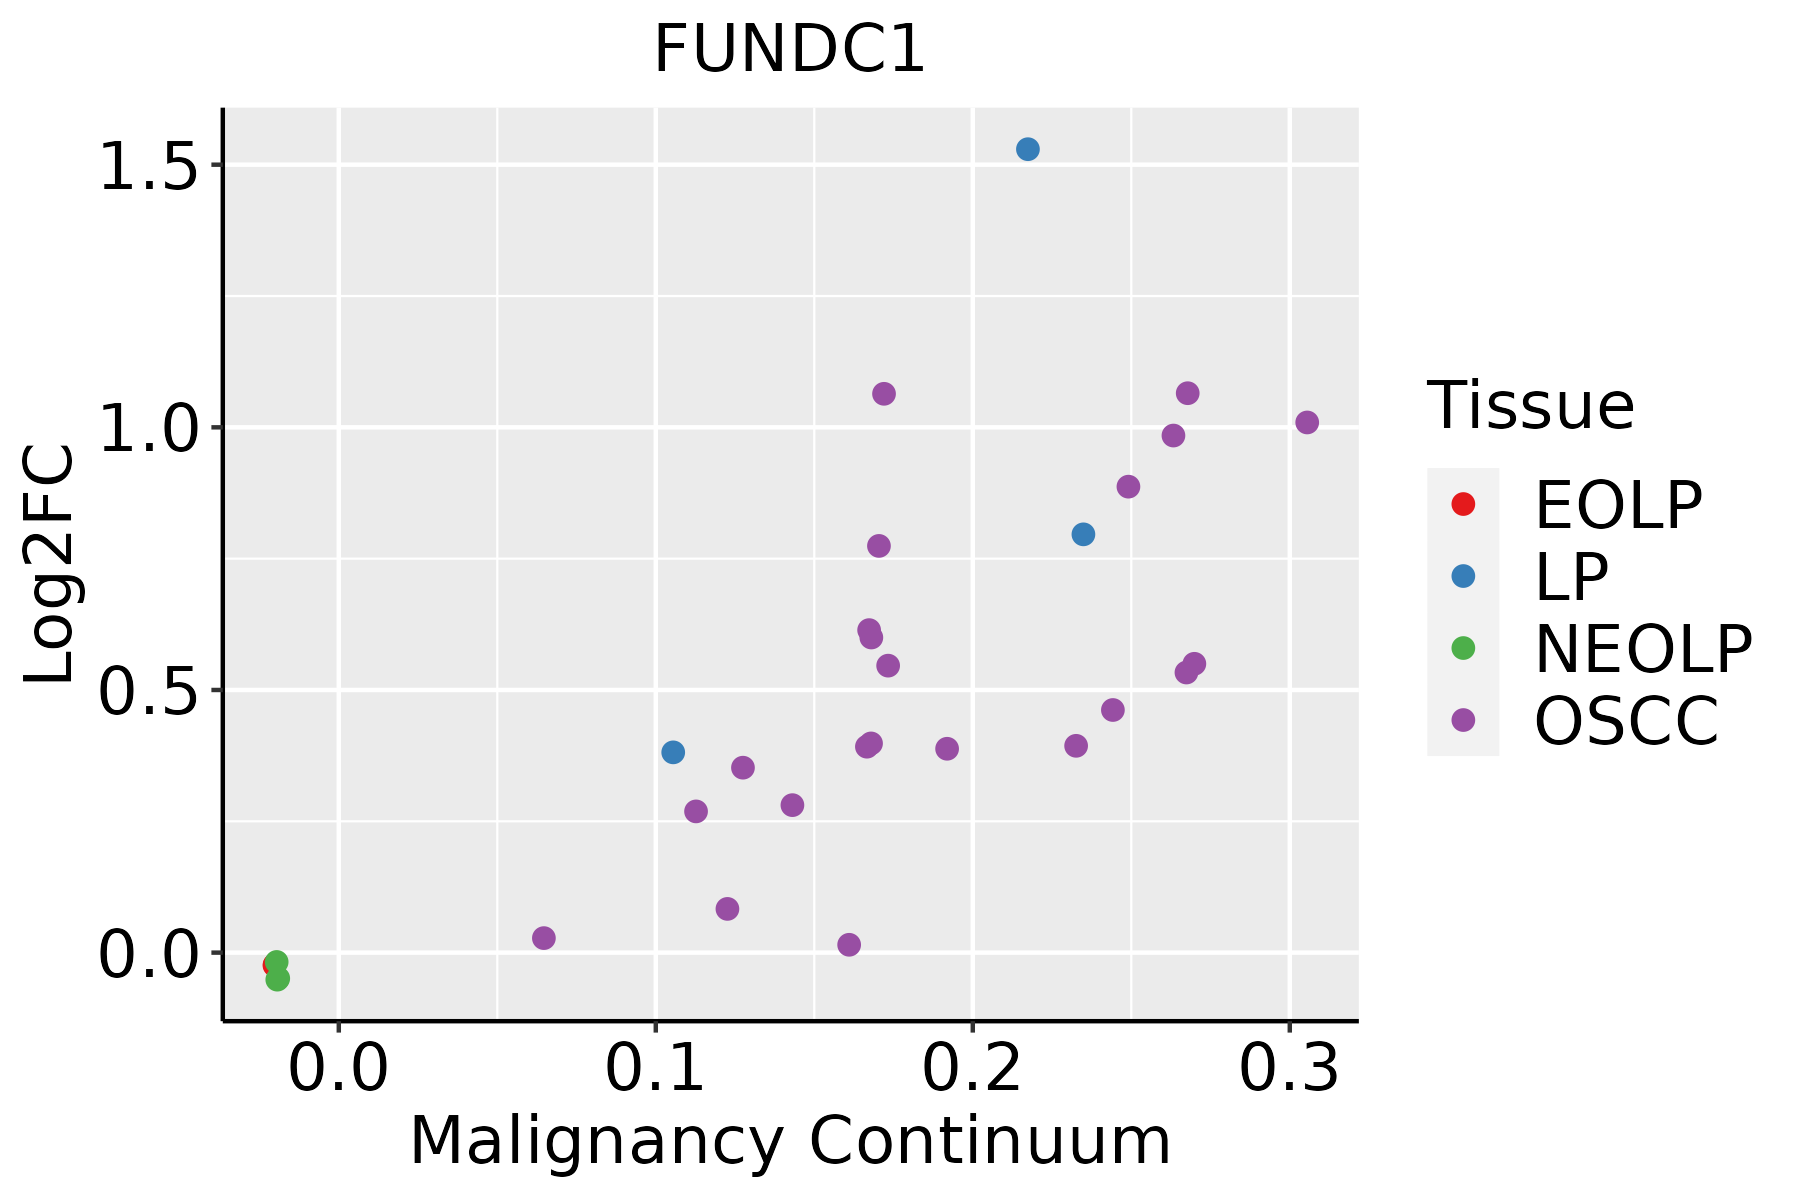 | EOLP: Erosive Oral lichen planus |
| LP: leukoplakia | ||
| NEOLP: Non-erosive oral lichen planus | ||
| OSCC: Oral squamous cell carcinoma | ||
| Skin | 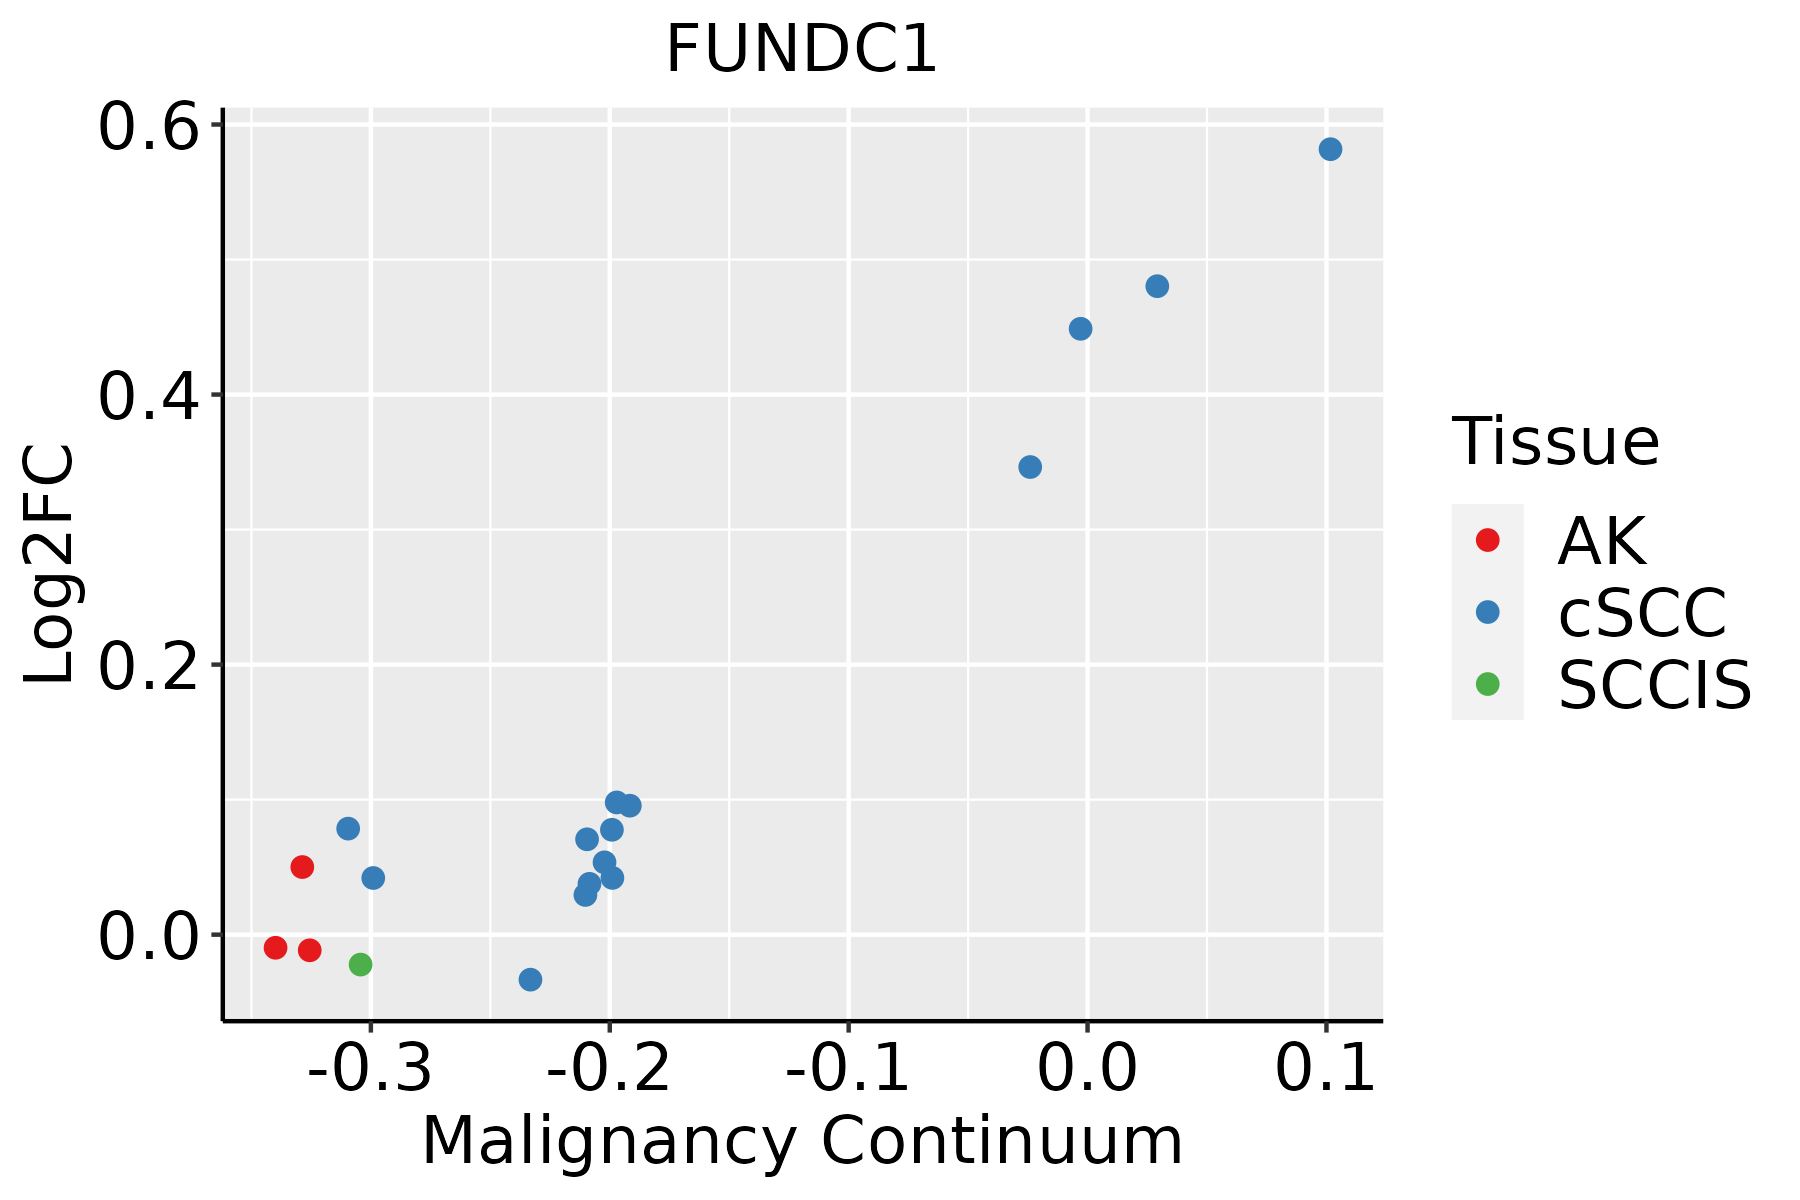 | AK: Actinic keratosis |
| cSCC: Cutaneous squamous cell carcinoma | ||
| SCCIS:squamous cell carcinoma in situ |
| ∗log2FC in expression of this searched gene in stem-like cells from each diseased tissue sample relative to stem-like cells in normal samples in each tissue plotted against the malignancy continuum. Samples are colored based on if they are from different disease stage. |
Top |
Malignant transformation related pathway analysis |
| Find out the enriched GO biological processes and KEGG pathways involved in transition from healthy to precancer to cancer |
| Tissue | Disease Stage | Enriched GO biological Processes |
| Colorectum | AD |  |
| Colorectum | SER |  |
| Colorectum | MSS |  |
| Colorectum | MSI-H |  |
| Colorectum | FAP |  |
| ∗Top 15 enriched GO BP terms are showed in the bar plot of each disease state in each tissue. Each row represents a significant GO biological process which is colored according to the -log10(p.adjust). |
| Page: 1 2 3 4 5 6 7 8 9 |
| GO ID | Tissue | Disease Stage | Description | Gene Ratio | Bg Ratio | pvalue | p.adjust | Count |
| GO:007048212 | Liver | HCC | response to oxygen levels | 191/7958 | 347/18723 | 1.42e-06 | 2.03e-05 | 191 |
| GO:002241119 | Oral cavity | OSCC | cellular component disassembly | 283/7305 | 443/18723 | 9.57e-27 | 3.37e-24 | 283 |
| GO:19030088 | Oral cavity | OSCC | organelle disassembly | 85/7305 | 114/18723 | 1.15e-14 | 6.93e-13 | 85 |
| GO:007048219 | Oral cavity | OSCC | response to oxygen levels | 200/7305 | 347/18723 | 1.17e-12 | 5.13e-11 | 200 |
| GO:000166619 | Oral cavity | OSCC | response to hypoxia | 177/7305 | 307/18723 | 2.21e-11 | 7.50e-10 | 177 |
| GO:003629319 | Oral cavity | OSCC | response to decreased oxygen levels | 182/7305 | 322/18723 | 1.14e-10 | 3.41e-09 | 182 |
| GO:000042210 | Oral cavity | OSCC | autophagy of mitochondrion | 59/7305 | 81/18723 | 6.40e-10 | 1.63e-08 | 59 |
| GO:006172610 | Oral cavity | OSCC | mitochondrion disassembly | 59/7305 | 81/18723 | 6.40e-10 | 1.63e-08 | 59 |
| GO:0022411110 | Oral cavity | LP | cellular component disassembly | 173/4623 | 443/18723 | 9.97e-12 | 7.44e-10 | 173 |
| GO:190300815 | Oral cavity | LP | organelle disassembly | 60/4623 | 114/18723 | 1.28e-10 | 7.30e-09 | 60 |
| GO:000042215 | Oral cavity | LP | autophagy of mitochondrion | 41/4623 | 81/18723 | 4.23e-07 | 1.21e-05 | 41 |
| GO:006172615 | Oral cavity | LP | mitochondrion disassembly | 41/4623 | 81/18723 | 4.23e-07 | 1.21e-05 | 41 |
| GO:0070482110 | Oral cavity | LP | response to oxygen levels | 122/4623 | 347/18723 | 7.10e-06 | 1.37e-04 | 122 |
| GO:0001666110 | Oral cavity | LP | response to hypoxia | 106/4623 | 307/18723 | 6.38e-05 | 8.61e-04 | 106 |
| GO:0036293110 | Oral cavity | LP | response to decreased oxygen levels | 109/4623 | 322/18723 | 1.25e-04 | 1.46e-03 | 109 |
| GO:0022411112 | Skin | cSCC | cellular component disassembly | 201/4864 | 443/18723 | 4.09e-19 | 5.69e-17 | 201 |
| GO:190300817 | Skin | cSCC | organelle disassembly | 65/4864 | 114/18723 | 2.03e-12 | 1.12e-10 | 65 |
| GO:000042219 | Skin | cSCC | autophagy of mitochondrion | 44/4864 | 81/18723 | 5.28e-08 | 1.36e-06 | 44 |
| GO:006172619 | Skin | cSCC | mitochondrion disassembly | 44/4864 | 81/18723 | 5.28e-08 | 1.36e-06 | 44 |
| GO:007048226 | Skin | cSCC | response to oxygen levels | 133/4864 | 347/18723 | 2.39e-07 | 5.07e-06 | 133 |
| Page: 1 2 3 |
| Pathway ID | Tissue | Disease Stage | Description | Gene Ratio | Bg Ratio | pvalue | p.adjust | qvalue | Count |
| hsa04137210 | Esophagus | ESCC | Mitophagy - animal | 54/4205 | 72/8465 | 9.33e-06 | 4.96e-05 | 2.54e-05 | 54 |
| hsa0413738 | Esophagus | ESCC | Mitophagy - animal | 54/4205 | 72/8465 | 9.33e-06 | 4.96e-05 | 2.54e-05 | 54 |
| hsa0413721 | Liver | Cirrhotic | Mitophagy - animal | 39/2530 | 72/8465 | 1.38e-05 | 1.24e-04 | 7.64e-05 | 39 |
| hsa0413731 | Liver | Cirrhotic | Mitophagy - animal | 39/2530 | 72/8465 | 1.38e-05 | 1.24e-04 | 7.64e-05 | 39 |
| hsa0413741 | Liver | HCC | Mitophagy - animal | 53/4020 | 72/8465 | 5.49e-06 | 4.59e-05 | 2.56e-05 | 53 |
| hsa0413751 | Liver | HCC | Mitophagy - animal | 53/4020 | 72/8465 | 5.49e-06 | 4.59e-05 | 2.56e-05 | 53 |
| hsa0413728 | Oral cavity | OSCC | Mitophagy - animal | 58/3704 | 72/8465 | 1.48e-10 | 2.07e-09 | 1.05e-09 | 58 |
| hsa04137112 | Oral cavity | OSCC | Mitophagy - animal | 58/3704 | 72/8465 | 1.48e-10 | 2.07e-09 | 1.05e-09 | 58 |
| hsa0413729 | Oral cavity | LP | Mitophagy - animal | 38/2418 | 72/8465 | 1.24e-05 | 8.63e-05 | 5.57e-05 | 38 |
| hsa0413737 | Oral cavity | LP | Mitophagy - animal | 38/2418 | 72/8465 | 1.24e-05 | 8.63e-05 | 5.57e-05 | 38 |
| Page: 1 |
Top |
Cell-cell communication analysis |
| Identification of potential cell-cell interactions between two cell types and their ligand-receptor pairs for different disease states |
| Ligand | Receptor | LRpair | Pathway | Tissue | Disease Stage |
| Page: 1 |
Top |
Single-cell gene regulatory network inference analysis |
| Find out the significant the regulons (TFs) and the target genes of each regulon across cell types for different disease states |
| TF | Cell Type | Tissue | Disease Stage | Target Gene | RSS | Regulon Activity |
| ∗The dot plots of a searched regulon are shown for all cell subpopulations in each disease state of each tissue based on the regulon specific score inferred using pySCENIC and by calculating the average expression. |
| Page: 1 |
Top |
Somatic mutation of malignant transformation related genes |
| Annotation of somatic variants for genes involved in malignant transformation |
| Hugo Symbol | Variant Class | Variant Classification | dbSNP RS | HGVSc | HGVSp | HGVSp Short | SWISSPROT | BIOTYPE | SIFT | PolyPhen | Tumor Sample Barcode | Tissue | Histology | Sex | Age | Stage | Therapy Types | Drugs | Outcome |
| FUNDC1 | SNV | Missense_Mutation | novel | c.349N>T | p.Ala117Ser | p.A117S | Q8IVP5 | protein_coding | tolerated(0.56) | benign(0.076) | TCGA-A2-A4S1-01 | Breast | breast invasive carcinoma | Female | >=65 | I/II | Unknown | Unknown | SD |
| FUNDC1 | insertion | In_Frame_Ins | novel | c.71_72insGAAGGA | p.Thr24_Glu25insLysAsp | p.T24_E25insKD | Q8IVP5 | protein_coding | TCGA-A7-A26I-01 | Breast | breast invasive carcinoma | Female | >=65 | I/II | Chemotherapy | cytoxan | SD | ||
| FUNDC1 | SNV | Missense_Mutation | c.110N>G | p.Phe37Cys | p.F37C | Q8IVP5 | protein_coding | deleterious(0) | possibly_damaging(0.862) | TCGA-AA-A00N-01 | Colorectum | colon adenocarcinoma | Male | >=65 | I/II | Unknown | Unknown | PD | |
| FUNDC1 | SNV | Missense_Mutation | c.322N>G | p.Lys108Glu | p.K108E | Q8IVP5 | protein_coding | deleterious(0.03) | possibly_damaging(0.766) | TCGA-AA-A02Y-01 | Colorectum | colon adenocarcinoma | Male | >=65 | I/II | Unknown | Unknown | SD | |
| FUNDC1 | SNV | Missense_Mutation | rs777393435 | c.31N>G | p.Tyr11Asp | p.Y11D | Q8IVP5 | protein_coding | tolerated(0.17) | benign(0.026) | TCGA-AX-A0J0-01 | Endometrium | uterine corpus endometrioid carcinoma | Female | <65 | I/II | Unknown | Unknown | SD |
| FUNDC1 | SNV | Missense_Mutation | novel | c.191N>T | p.Ala64Val | p.A64V | Q8IVP5 | protein_coding | tolerated(0.31) | benign(0.133) | TCGA-AX-A0J1-01 | Endometrium | uterine corpus endometrioid carcinoma | Female | >=65 | I/II | Unknown | Unknown | SD |
| FUNDC1 | SNV | Missense_Mutation | rs181489310 | c.46G>A | p.Asp16Asn | p.D16N | Q8IVP5 | protein_coding | tolerated(0.24) | benign(0.005) | TCGA-AX-A2HD-01 | Endometrium | uterine corpus endometrioid carcinoma | Female | >=65 | III/IV | Unknown | Unknown | SD |
| FUNDC1 | SNV | Missense_Mutation | c.313N>T | p.Asp105Tyr | p.D105Y | Q8IVP5 | protein_coding | deleterious(0.02) | probably_damaging(0.983) | TCGA-BS-A0TC-01 | Endometrium | uterine corpus endometrioid carcinoma | Female | >=65 | I/II | Unknown | Unknown | SD | |
| FUNDC1 | SNV | Missense_Mutation | novel | c.385N>A | p.Glu129Lys | p.E129K | Q8IVP5 | protein_coding | tolerated(0.08) | benign(0.081) | TCGA-BS-A0UF-01 | Endometrium | uterine corpus endometrioid carcinoma | Female | >=65 | I/II | Unknown | Unknown | SD |
| FUNDC1 | SNV | Missense_Mutation | novel | c.71C>A | p.Thr24Asn | p.T24N | Q8IVP5 | protein_coding | deleterious(0) | possibly_damaging(0.674) | TCGA-D1-A102-01 | Endometrium | uterine corpus endometrioid carcinoma | Female | <65 | I/II | Unknown | Unknown | SD |
| Page: 1 2 |
Top |
Related drugs of malignant transformation related genes |
| Identification of chemicals and drugs interact with genes involved in malignant transfromation |
| (DGIdb 4.0) |
| Entrez ID | Symbol | Category | Interaction Types | Drug Claim Name | Drug Name | PMIDs |
| Page: 1 |

Copyright 2023-Present -The University of Texas Health Science Center at Houston |