
|
|||||
|
 | |
| |
| |
| |
| |
| |
|
Gene: FKBP11 |
Gene summary for FKBP11 |
| Gene information | Species | Human | Gene symbol | FKBP11 | Gene ID | 51303 |
| Gene name | FKBP prolyl isomerase 11 | |
| Gene Alias | FKBP19 | |
| Cytomap | 12q13.12 | |
| Gene Type | protein-coding | GO ID | GO:0000413 | UniProtAcc | E9PAR0 |
Top |
Malignant transformation analysis |
| Identification of the aberrant gene expression in precancerous and cancerous lesions by comparing the gene expression of stem-like cells in diseased tissues with normal stem cells |
| Entrez ID | Symbol | Replicates | Species | Organ | Tissue | Adj P-value | Log2FC | Malignancy |
| 51303 | FKBP11 | AEH-subject1 | Human | Endometrium | AEH | 4.63e-19 | -4.42e-01 | -0.3059 |
| 51303 | FKBP11 | AEH-subject2 | Human | Endometrium | AEH | 4.85e-15 | -4.12e-01 | -0.2525 |
| 51303 | FKBP11 | AEH-subject3 | Human | Endometrium | AEH | 9.31e-13 | -3.70e-01 | -0.2576 |
| 51303 | FKBP11 | AEH-subject4 | Human | Endometrium | AEH | 9.27e-12 | -3.07e-01 | -0.2657 |
| 51303 | FKBP11 | EEC-subject1 | Human | Endometrium | EEC | 1.55e-10 | -3.06e-01 | -0.2682 |
| 51303 | FKBP11 | EEC-subject2 | Human | Endometrium | EEC | 1.43e-22 | -4.62e-01 | -0.2607 |
| 51303 | FKBP11 | EEC-subject3 | Human | Endometrium | EEC | 7.59e-32 | -3.72e-01 | -0.2525 |
| 51303 | FKBP11 | EEC-subject4 | Human | Endometrium | EEC | 3.13e-08 | -3.20e-01 | -0.2571 |
| 51303 | FKBP11 | EEC-subject5 | Human | Endometrium | EEC | 1.51e-09 | -3.69e-01 | -0.249 |
| 51303 | FKBP11 | GSM5276934 | Human | Endometrium | EEC | 1.37e-04 | -1.69e-01 | -0.0913 |
| 51303 | FKBP11 | GSM5276935 | Human | Endometrium | EEC | 5.05e-10 | -3.91e-01 | -0.123 |
| 51303 | FKBP11 | GSM6177620_NYU_UCEC1_lib1_lib1 | Human | Endometrium | EEC | 1.76e-28 | -4.23e-01 | -0.1869 |
| 51303 | FKBP11 | GSM6177620_NYU_UCEC1_lib2_lib2 | Human | Endometrium | EEC | 2.80e-25 | -5.16e-01 | -0.1875 |
| 51303 | FKBP11 | GSM6177620_NYU_UCEC1_lib3_lib3 | Human | Endometrium | EEC | 4.48e-32 | -5.20e-01 | -0.1883 |
| 51303 | FKBP11 | GSM6177621_NYU_UCEC2_lib1_lib1 | Human | Endometrium | EEC | 7.52e-34 | -4.86e-01 | -0.1934 |
| 51303 | FKBP11 | GSM6177622_NYU_UCEC3_lib1_lib1 | Human | Endometrium | EEC | 6.06e-46 | -5.01e-01 | -0.1917 |
| 51303 | FKBP11 | GSM6177622_NYU_UCEC3_lib2_lib2 | Human | Endometrium | EEC | 3.09e-45 | -5.20e-01 | -0.1916 |
| 51303 | FKBP11 | GSM6177623_NYU_UCEC3_Vis | Human | Endometrium | EEC | 1.04e-23 | -4.74e-01 | -0.1269 |
| 51303 | FKBP11 | LZE3D | Human | Esophagus | HGIN | 8.04e-04 | 5.44e-01 | 0.0668 |
| 51303 | FKBP11 | LZE4T | Human | Esophagus | ESCC | 1.76e-03 | 3.88e-02 | 0.0811 |
| Page: 1 2 3 4 5 6 7 |
| Tissue | Expression Dynamics | Abbreviation |
| Endometrium |  | AEH: Atypical endometrial hyperplasia |
| EEC: Endometrioid Cancer | ||
| Esophagus | 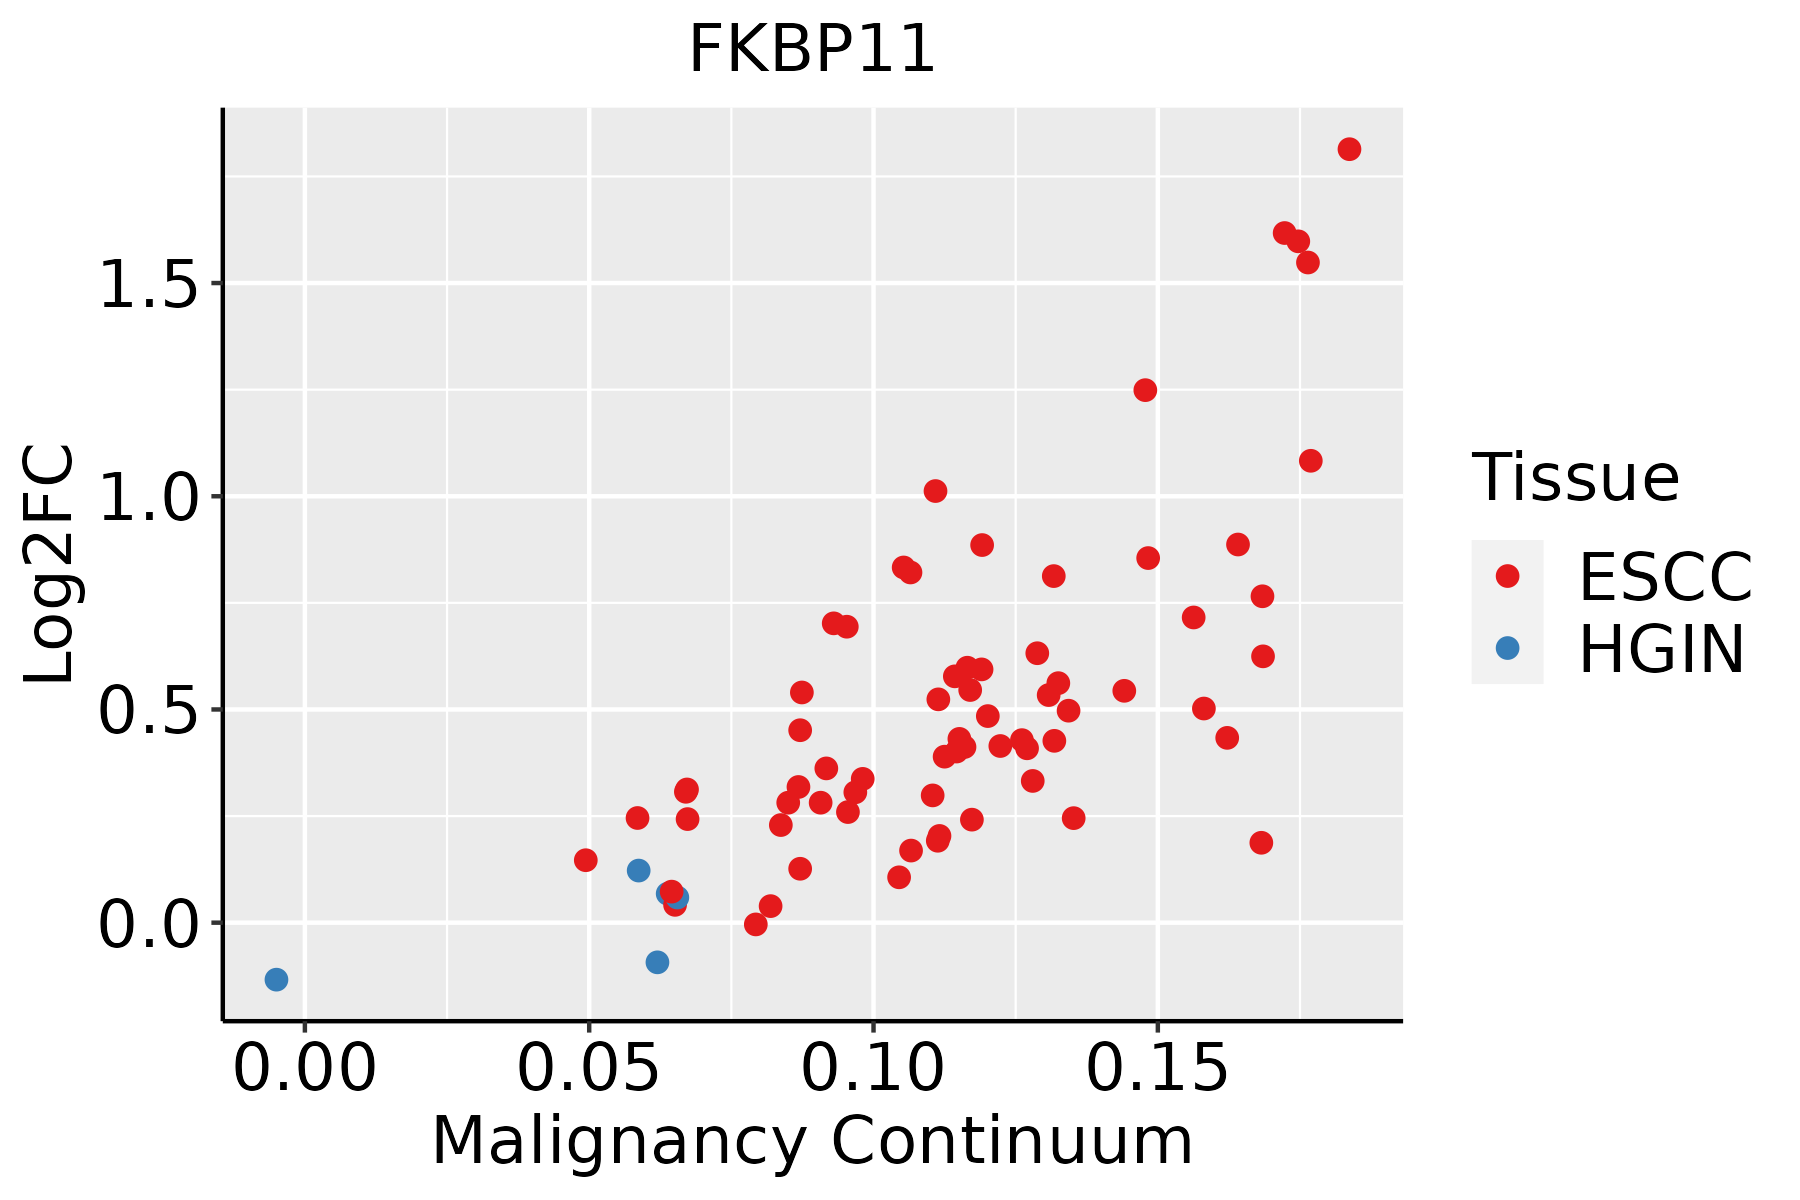 | ESCC: Esophageal squamous cell carcinoma |
| HGIN: High-grade intraepithelial neoplasias | ||
| LGIN: Low-grade intraepithelial neoplasias | ||
| Liver | 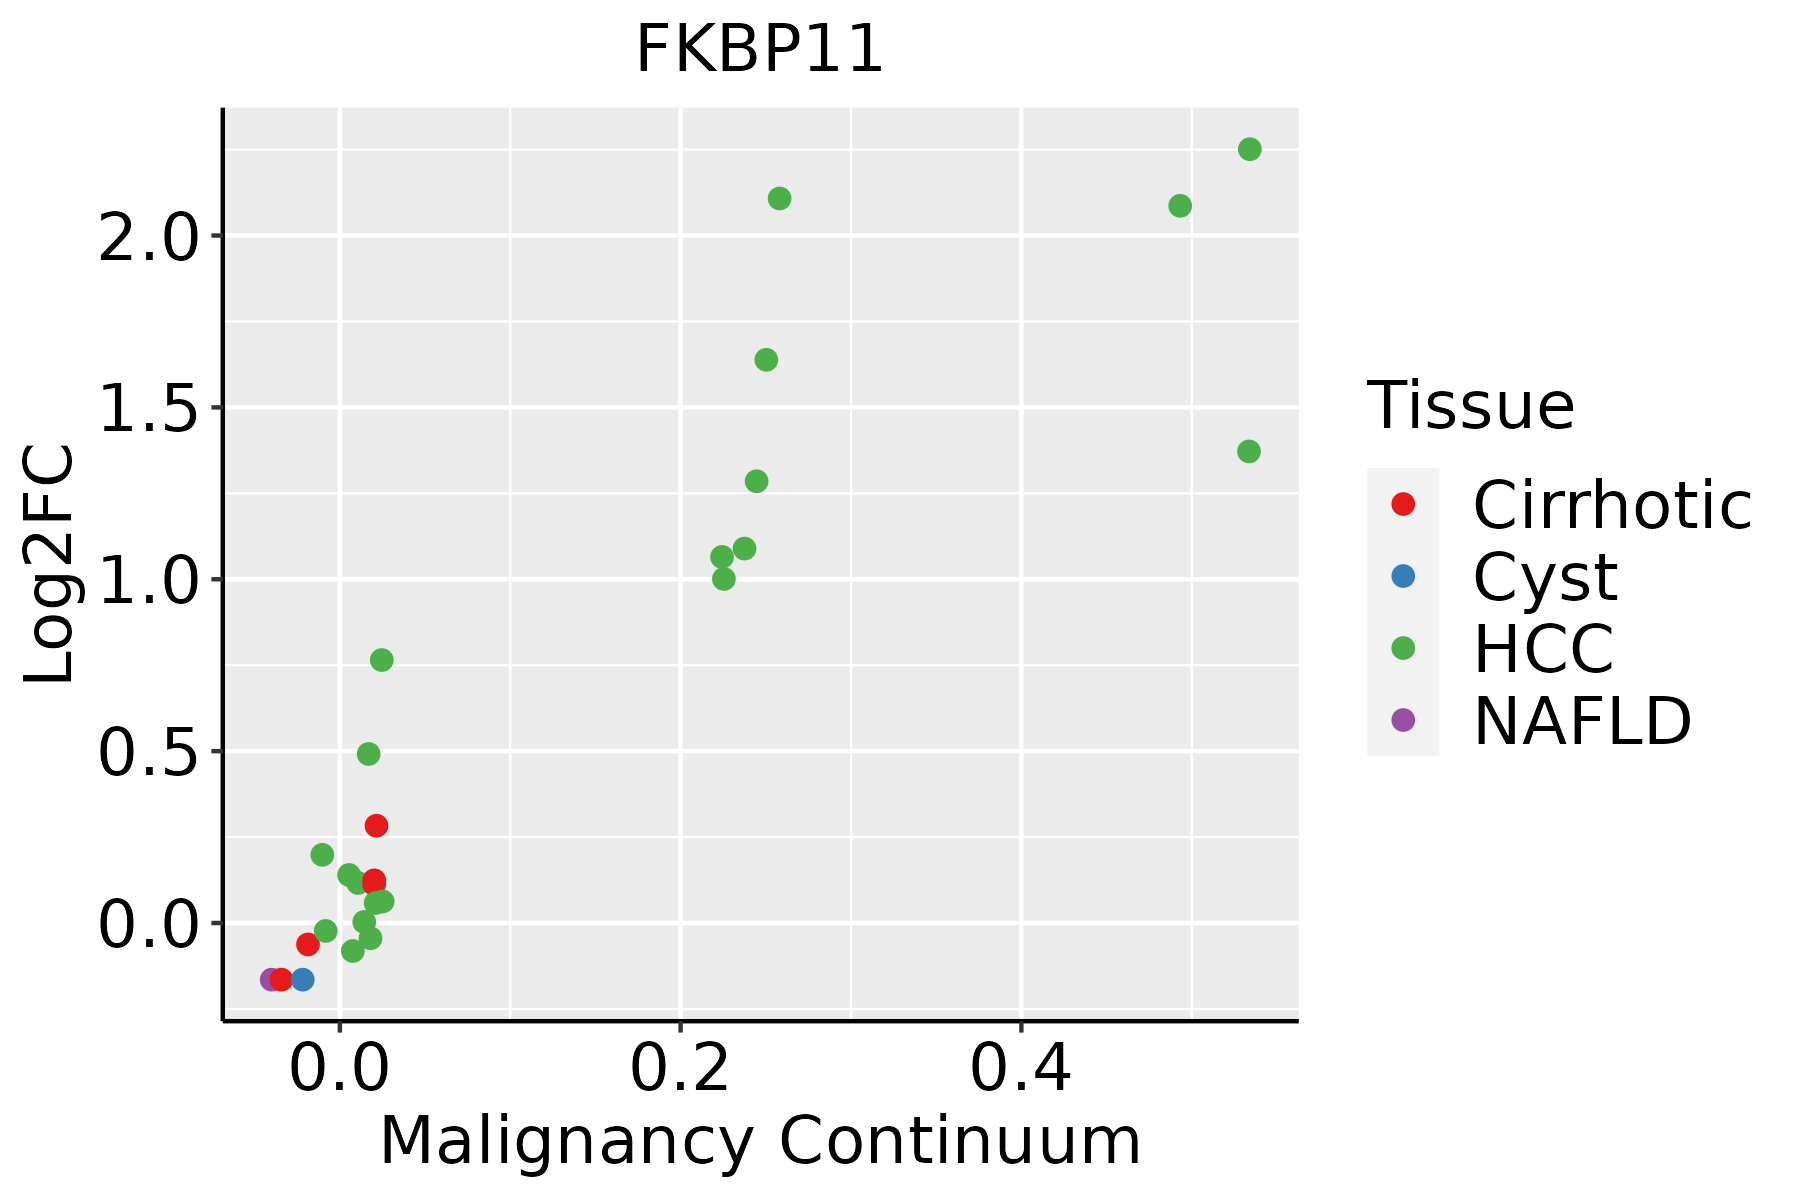 | HCC: Hepatocellular carcinoma |
| NAFLD: Non-alcoholic fatty liver disease | ||
| Oral Cavity | 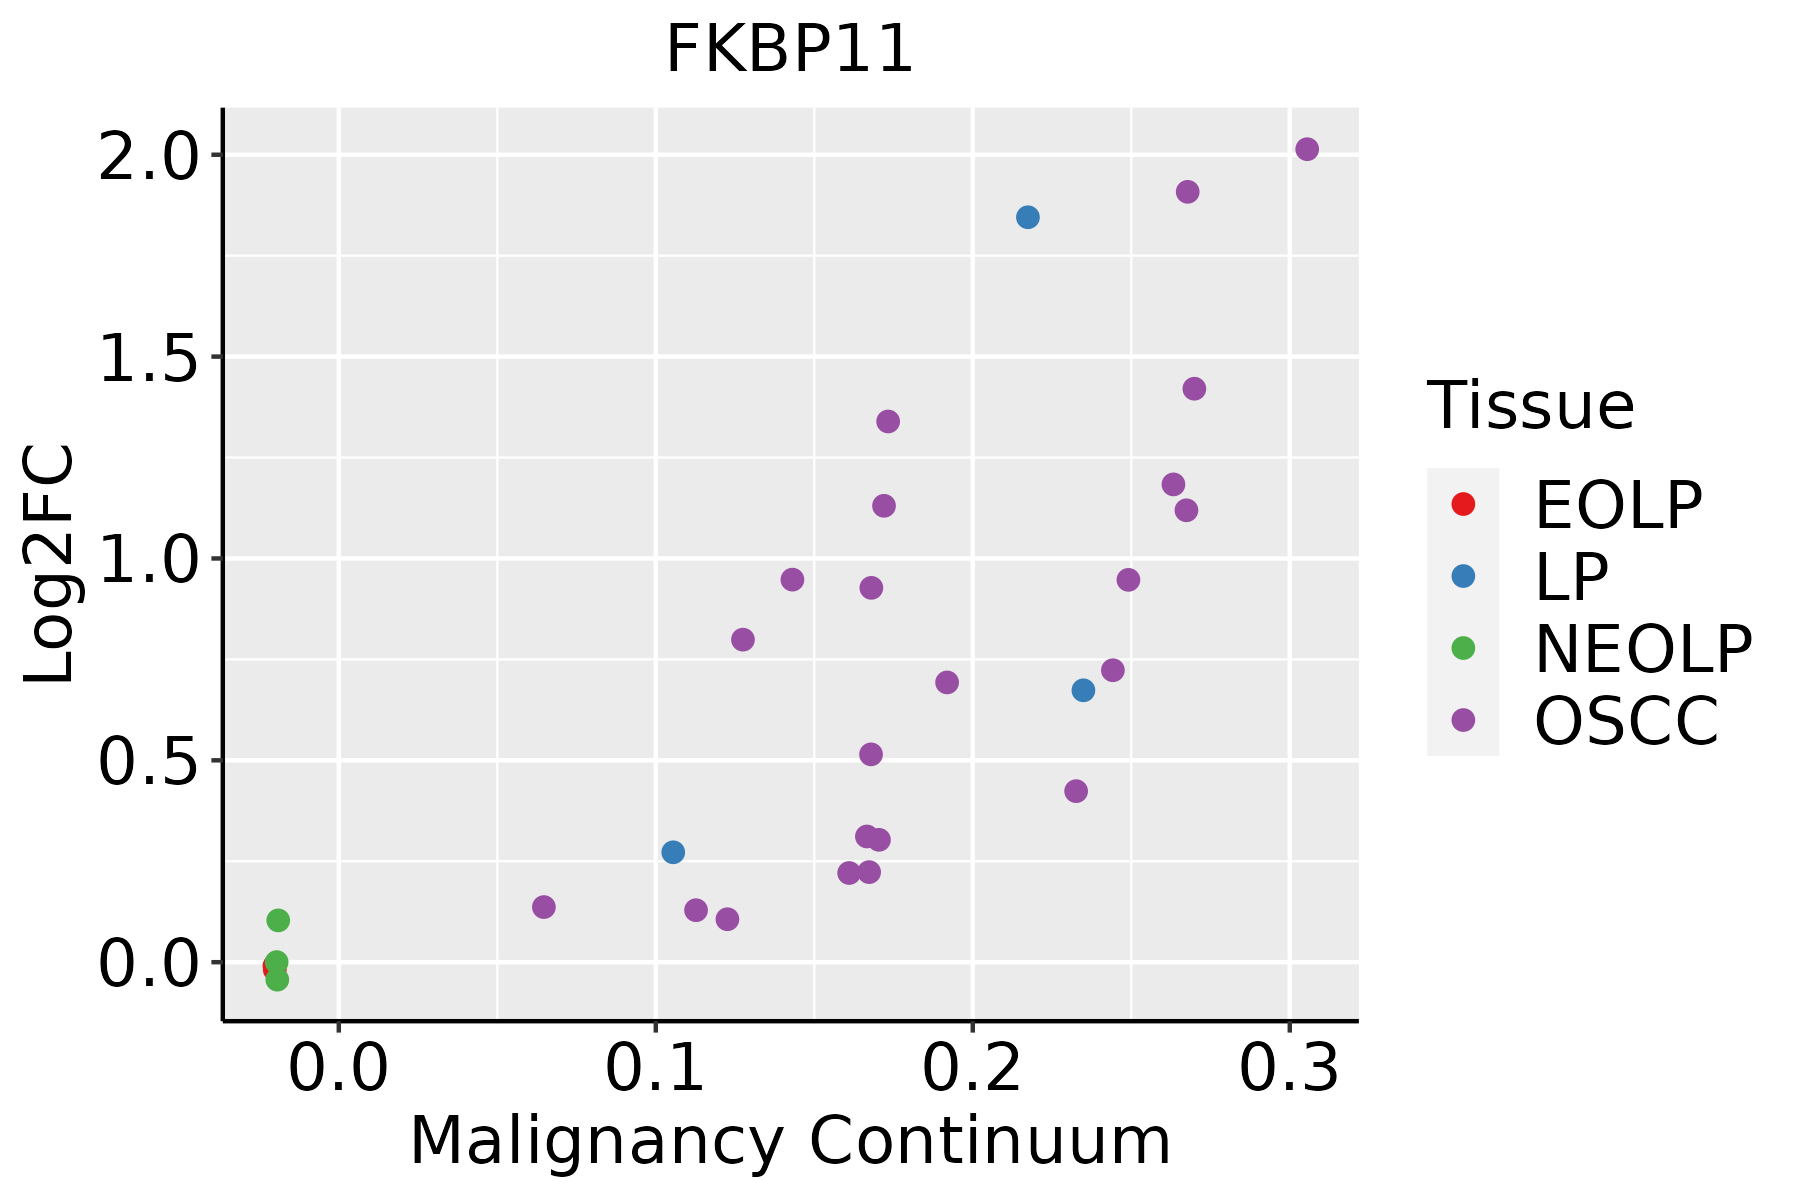 | EOLP: Erosive Oral lichen planus |
| LP: leukoplakia | ||
| NEOLP: Non-erosive oral lichen planus | ||
| OSCC: Oral squamous cell carcinoma | ||
| Skin | 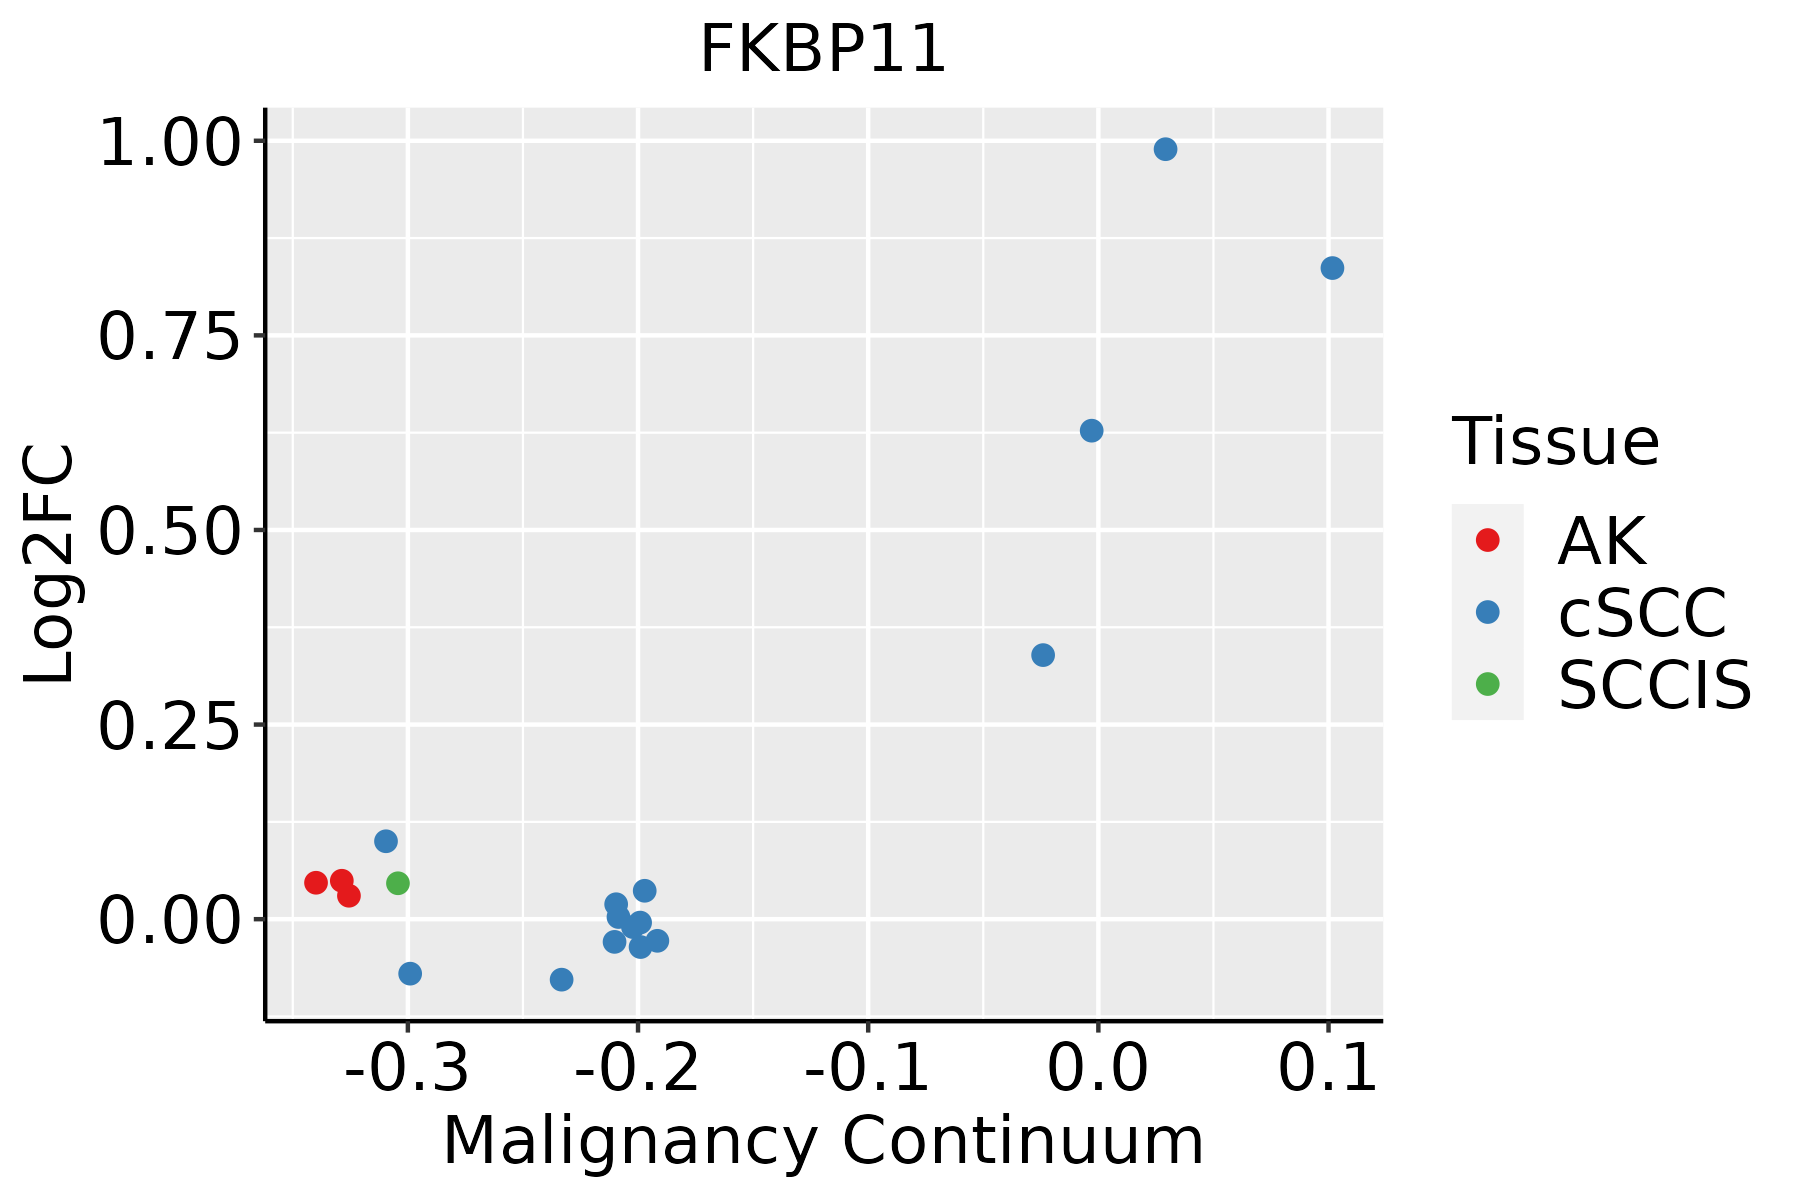 | AK: Actinic keratosis |
| cSCC: Cutaneous squamous cell carcinoma | ||
| SCCIS:squamous cell carcinoma in situ | ||
| Thyroid | 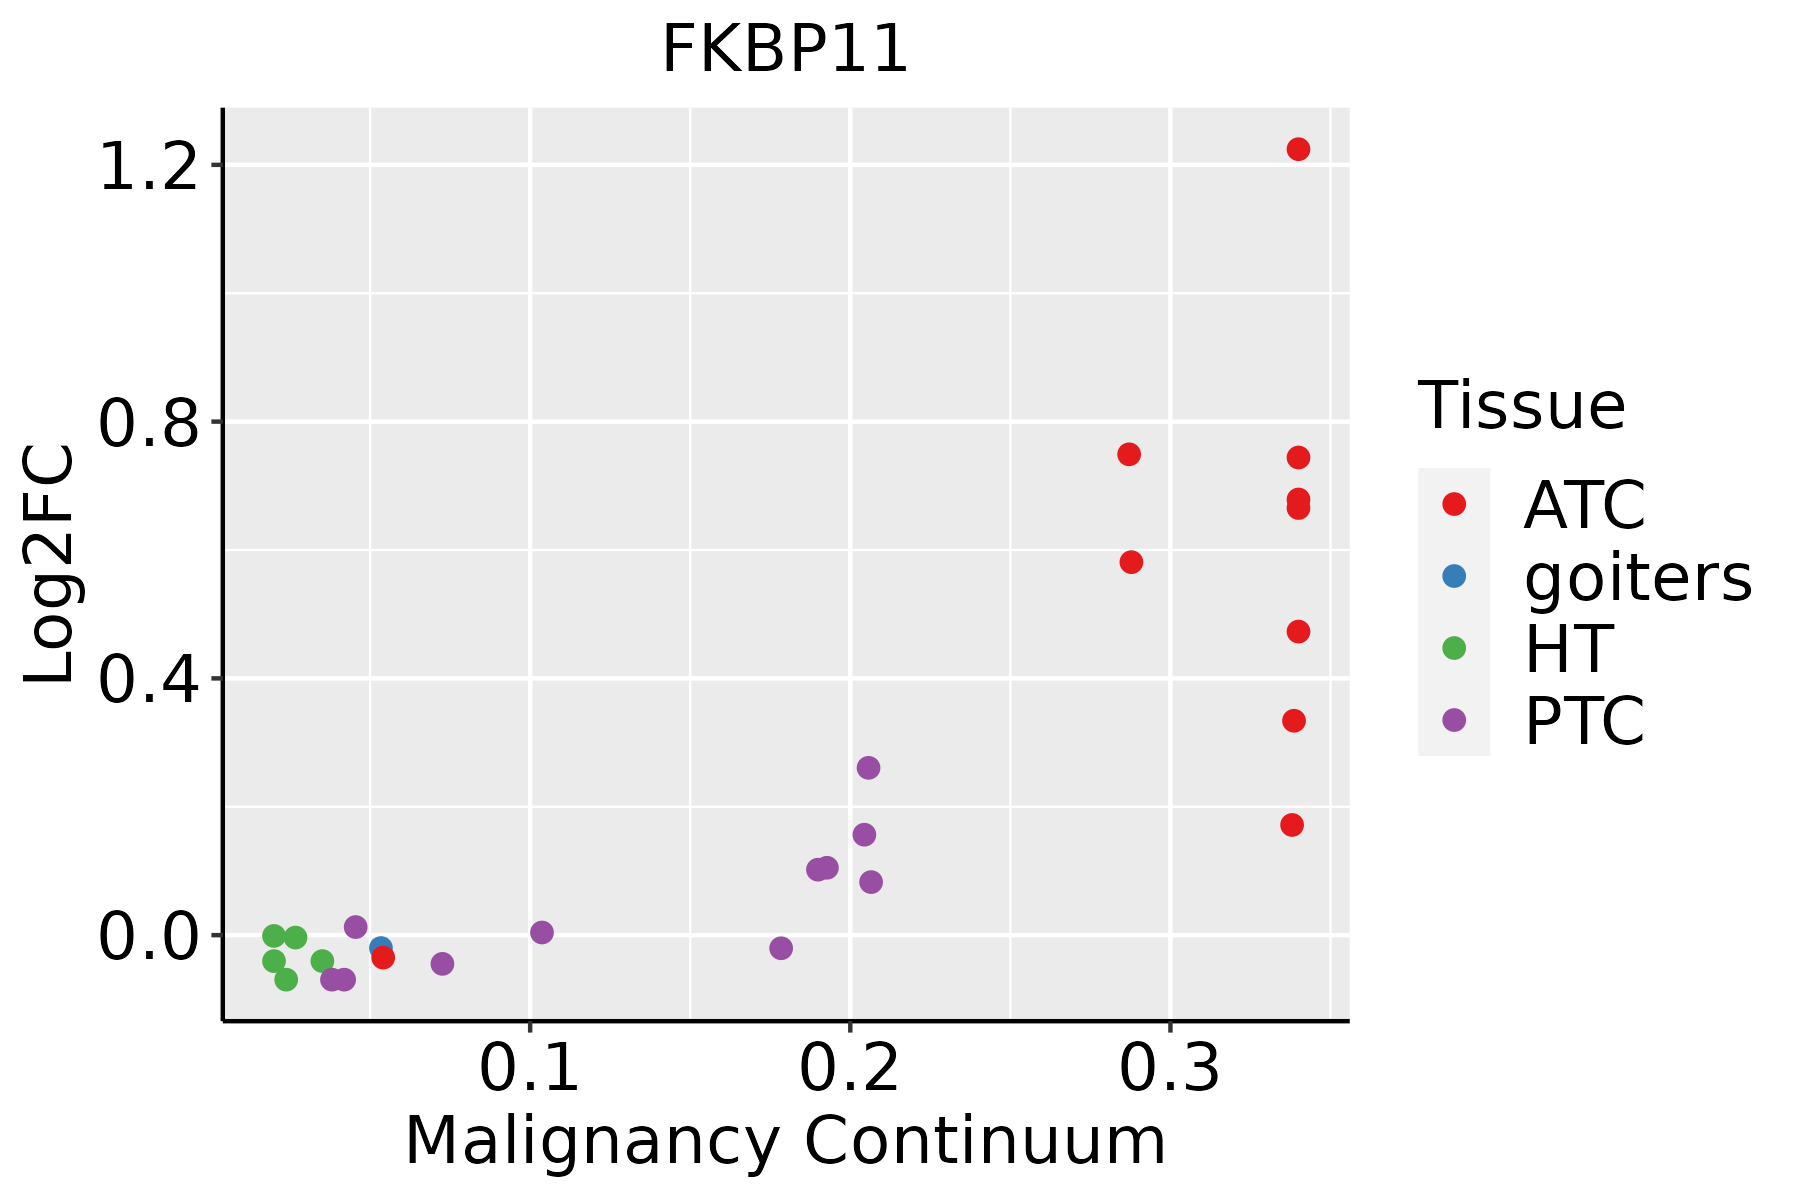 | ATC: Anaplastic thyroid cancer |
| HT: Hashimoto's thyroiditis | ||
| PTC: Papillary thyroid cancer |
| ∗log2FC in expression of this searched gene in stem-like cells from each diseased tissue sample relative to stem-like cells in normal samples in each tissue plotted against the malignancy continuum. Samples are colored based on if they are from different disease stage. |
Top |
Malignant transformation related pathway analysis |
| Find out the enriched GO biological processes and KEGG pathways involved in transition from healthy to precancer to cancer |
| Tissue | Disease Stage | Enriched GO biological Processes |
| Colorectum | AD |  |
| Colorectum | SER |  |
| Colorectum | MSS |  |
| Colorectum | MSI-H |  |
| Colorectum | FAP |  |
| ∗Top 15 enriched GO BP terms are showed in the bar plot of each disease state in each tissue. Each row represents a significant GO biological process which is colored according to the -log10(p.adjust). |
| Page: 1 2 3 4 5 6 7 8 9 |
| GO ID | Tissue | Disease Stage | Description | Gene Ratio | Bg Ratio | pvalue | p.adjust | Count |
| GO:000645718 | Oral cavity | OSCC | protein folding | 154/7305 | 212/18723 | 1.89e-23 | 4.60e-21 | 154 |
| GO:006107718 | Oral cavity | OSCC | chaperone-mediated protein folding | 54/7305 | 67/18723 | 3.73e-12 | 1.45e-10 | 54 |
| GO:00182088 | Oral cavity | OSCC | peptidyl-proline modification | 42/7305 | 58/18723 | 2.49e-07 | 3.92e-06 | 42 |
| GO:00004134 | Oral cavity | OSCC | protein peptidyl-prolyl isomerization | 28/7305 | 42/18723 | 2.61e-04 | 1.67e-03 | 28 |
| GO:000645719 | Oral cavity | LP | protein folding | 125/4623 | 212/18723 | 1.62e-26 | 8.45e-24 | 125 |
| GO:006107719 | Oral cavity | LP | chaperone-mediated protein folding | 45/4623 | 67/18723 | 2.58e-13 | 2.41e-11 | 45 |
| GO:001820815 | Oral cavity | LP | peptidyl-proline modification | 28/4623 | 58/18723 | 8.35e-05 | 1.07e-03 | 28 |
| GO:000041312 | Oral cavity | LP | protein peptidyl-prolyl isomerization | 22/4623 | 42/18723 | 1.04e-04 | 1.26e-03 | 22 |
| GO:0006457111 | Skin | cSCC | protein folding | 131/4864 | 212/18723 | 2.96e-28 | 1.32e-25 | 131 |
| GO:0061077111 | Skin | cSCC | chaperone-mediated protein folding | 46/4864 | 67/18723 | 2.93e-13 | 1.75e-11 | 46 |
| GO:001820810 | Skin | cSCC | peptidyl-proline modification | 37/4864 | 58/18723 | 1.53e-09 | 5.82e-08 | 37 |
| GO:00004136 | Skin | cSCC | protein peptidyl-prolyl isomerization | 26/4864 | 42/18723 | 9.92e-07 | 1.78e-05 | 26 |
| GO:0006457112 | Thyroid | PTC | protein folding | 137/5968 | 212/18723 | 8.29e-23 | 2.01e-20 | 137 |
| GO:001820817 | Thyroid | PTC | peptidyl-proline modification | 42/5968 | 58/18723 | 2.71e-10 | 8.91e-09 | 42 |
| GO:0061077112 | Thyroid | PTC | chaperone-mediated protein folding | 46/5968 | 67/18723 | 6.91e-10 | 2.08e-08 | 46 |
| GO:00004137 | Thyroid | PTC | protein peptidyl-prolyl isomerization | 30/5968 | 42/18723 | 1.65e-07 | 3.13e-06 | 30 |
| GO:000645733 | Thyroid | ATC | protein folding | 140/6293 | 212/18723 | 3.46e-22 | 8.09e-20 | 140 |
| GO:006107733 | Thyroid | ATC | chaperone-mediated protein folding | 47/6293 | 67/18723 | 1.05e-09 | 2.67e-08 | 47 |
| GO:001820818 | Thyroid | ATC | peptidyl-proline modification | 42/6293 | 58/18723 | 1.70e-09 | 4.21e-08 | 42 |
| GO:000041314 | Thyroid | ATC | protein peptidyl-prolyl isomerization | 30/6293 | 42/18723 | 6.06e-07 | 8.44e-06 | 30 |
| Page: 1 2 |
| Pathway ID | Tissue | Disease Stage | Description | Gene Ratio | Bg Ratio | pvalue | p.adjust | qvalue | Count |
| Page: 1 |
Top |
Cell-cell communication analysis |
| Identification of potential cell-cell interactions between two cell types and their ligand-receptor pairs for different disease states |
| Ligand | Receptor | LRpair | Pathway | Tissue | Disease Stage |
| Page: 1 |
Top |
Single-cell gene regulatory network inference analysis |
| Find out the significant the regulons (TFs) and the target genes of each regulon across cell types for different disease states |
| TF | Cell Type | Tissue | Disease Stage | Target Gene | RSS | Regulon Activity |
| ∗The dot plots of a searched regulon are shown for all cell subpopulations in each disease state of each tissue based on the regulon specific score inferred using pySCENIC and by calculating the average expression. |
| Page: 1 |
Top |
Somatic mutation of malignant transformation related genes |
| Annotation of somatic variants for genes involved in malignant transformation |
| Hugo Symbol | Variant Class | Variant Classification | dbSNP RS | HGVSc | HGVSp | HGVSp Short | SWISSPROT | BIOTYPE | SIFT | PolyPhen | Tumor Sample Barcode | Tissue | Histology | Sex | Age | Stage | Therapy Types | Drugs | Outcome |
| FKBP11 | SNV | Missense_Mutation | c.236N>G | p.Thr79Ser | p.T79S | Q9NYL4 | protein_coding | tolerated(1) | benign(0) | TCGA-AY-A8YK-01 | Colorectum | colon adenocarcinoma | Male | <65 | I/II | Chemotherapy | 5-fu | CR | |
| FKBP11 | SNV | Missense_Mutation | rs757467836 | c.462N>T | p.Lys154Asn | p.K154N | Q9NYL4 | protein_coding | tolerated(0.77) | benign(0.001) | TCGA-AZ-4615-01 | Colorectum | colon adenocarcinoma | Male | >=65 | III/IV | Chemotherapy | xeloda | PD |
| FKBP11 | SNV | Missense_Mutation | c.515T>A | p.Ile172Asn | p.I172N | Q9NYL4 | protein_coding | deleterious(0) | probably_damaging(0.942) | TCGA-AG-A02N-01 | Colorectum | rectum adenocarcinoma | Male | >=65 | I/II | Chemotherapy | folinic | CR | |
| FKBP11 | SNV | Missense_Mutation | novel | c.600G>T | p.Lys200Asn | p.K200N | Q9NYL4 | protein_coding | deleterious_low_confidence(0) | benign(0.052) | TCGA-EI-6917-01 | Colorectum | rectum adenocarcinoma | Male | <65 | III/IV | Chemotherapy | 5fluorouracil+oxaciplatina+l-folinian | SD |
| FKBP11 | SNV | Missense_Mutation | c.304G>A | p.Asp102Asn | p.D102N | Q9NYL4 | protein_coding | tolerated(0.31) | probably_damaging(0.926) | TCGA-EI-6917-01 | Colorectum | rectum adenocarcinoma | Male | <65 | III/IV | Chemotherapy | 5fluorouracil+oxaciplatina+l-folinian | SD | |
| FKBP11 | SNV | Missense_Mutation | c.304N>A | p.Asp102Asn | p.D102N | Q9NYL4 | protein_coding | tolerated(0.31) | probably_damaging(0.926) | TCGA-AP-A0LM-01 | Endometrium | uterine corpus endometrioid carcinoma | Female | <65 | III/IV | Chemotherapy | cisplatin | SD | |
| FKBP11 | SNV | Missense_Mutation | c.172N>T | p.Asp58Tyr | p.D58Y | Q9NYL4 | protein_coding | deleterious(0) | possibly_damaging(0.844) | TCGA-AP-A0LM-01 | Endometrium | uterine corpus endometrioid carcinoma | Female | <65 | III/IV | Chemotherapy | cisplatin | SD | |
| FKBP11 | SNV | Missense_Mutation | novel | c.301C>A | p.Leu101Ile | p.L101I | Q9NYL4 | protein_coding | tolerated(0.13) | benign(0.134) | TCGA-AX-A06F-01 | Endometrium | uterine corpus endometrioid carcinoma | Female | <65 | III/IV | Chemotherapy | carboplatin | SD |
| FKBP11 | SNV | Missense_Mutation | novel | c.600N>T | p.Lys200Asn | p.K200N | Q9NYL4 | protein_coding | deleterious_low_confidence(0) | benign(0.052) | TCGA-EO-A22X-01 | Endometrium | uterine corpus endometrioid carcinoma | Female | <65 | III/IV | Unspecific | Carboplatin | Complete Response |
| FKBP11 | SNV | Missense_Mutation | novel | c.136C>T | p.Pro46Ser | p.P46S | Q9NYL4 | protein_coding | tolerated(0.33) | benign(0.003) | TCGA-FI-A2D5-01 | Endometrium | uterine corpus endometrioid carcinoma | Female | <65 | III/IV | Chemotherapy | carboplatinum | PD |
| Page: 1 2 |
Top |
Related drugs of malignant transformation related genes |
| Identification of chemicals and drugs interact with genes involved in malignant transfromation |
| (DGIdb 4.0) |
| Entrez ID | Symbol | Category | Interaction Types | Drug Claim Name | Drug Name | PMIDs |
| Page: 1 |

Copyright 2023-Present -The University of Texas Health Science Center at Houston |