
|
|||||
|
 | |
| |
| |
| |
| |
| |
|
Gene: FBXW4 |
Gene summary for FBXW4 |
| Gene information | Species | Human | Gene symbol | FBXW4 | Gene ID | 6468 |
| Gene name | F-box and WD repeat domain containing 4 | |
| Gene Alias | DAC | |
| Cytomap | 10q24.32 | |
| Gene Type | protein-coding | GO ID | GO:0006508 | UniProtAcc | P57775 |
Top |
Malignant transformation analysis |
| Identification of the aberrant gene expression in precancerous and cancerous lesions by comparing the gene expression of stem-like cells in diseased tissues with normal stem cells |
| Entrez ID | Symbol | Replicates | Species | Organ | Tissue | Adj P-value | Log2FC | Malignancy |
| 6468 | FBXW4 | NAFLD1 | Human | Liver | NAFLD | 1.77e-02 | 2.83e-01 | -0.04 |
| 6468 | FBXW4 | HCC1_Meng | Human | Liver | HCC | 2.80e-12 | -6.07e-02 | 0.0246 |
| 6468 | FBXW4 | HCC2_Meng | Human | Liver | HCC | 2.78e-14 | 1.15e-01 | 0.0107 |
| 6468 | FBXW4 | HCC2 | Human | Liver | HCC | 1.64e-07 | 2.47e+00 | 0.5341 |
| 6468 | FBXW4 | S015 | Human | Liver | HCC | 1.28e-02 | 3.78e-01 | 0.2375 |
| 6468 | FBXW4 | S016 | Human | Liver | HCC | 5.37e-04 | 3.14e-01 | 0.2243 |
| 6468 | FBXW4 | S027 | Human | Liver | HCC | 1.15e-03 | 5.13e-01 | 0.2446 |
| 6468 | FBXW4 | S028 | Human | Liver | HCC | 1.47e-05 | 4.07e-01 | 0.2503 |
| 6468 | FBXW4 | S029 | Human | Liver | HCC | 2.33e-03 | 3.60e-01 | 0.2581 |
| 6468 | FBXW4 | C21 | Human | Oral cavity | OSCC | 4.35e-03 | 1.46e-01 | 0.2678 |
| 6468 | FBXW4 | C30 | Human | Oral cavity | OSCC | 8.19e-13 | 6.65e-01 | 0.3055 |
| 6468 | FBXW4 | C46 | Human | Oral cavity | OSCC | 1.10e-04 | 1.97e-01 | 0.1673 |
| 6468 | FBXW4 | C51 | Human | Oral cavity | OSCC | 4.67e-07 | 4.61e-01 | 0.2674 |
| 6468 | FBXW4 | C06 | Human | Oral cavity | OSCC | 4.78e-03 | 5.86e-01 | 0.2699 |
| 6468 | FBXW4 | C08 | Human | Oral cavity | OSCC | 4.04e-11 | 4.08e-01 | 0.1919 |
| 6468 | FBXW4 | LN46 | Human | Oral cavity | OSCC | 4.71e-04 | 2.14e-01 | 0.1666 |
| 6468 | FBXW4 | EOLP-1 | Human | Oral cavity | EOLP | 4.90e-02 | 2.32e-01 | -0.0202 |
| 6468 | FBXW4 | SYSMH1 | Human | Oral cavity | OSCC | 1.33e-07 | 3.11e-01 | 0.1127 |
| 6468 | FBXW4 | SYSMH2 | Human | Oral cavity | OSCC | 2.84e-05 | 3.39e-01 | 0.2326 |
| 6468 | FBXW4 | SYSMH3 | Human | Oral cavity | OSCC | 3.60e-08 | 2.36e-01 | 0.2442 |
| Page: 1 2 |
| Tissue | Expression Dynamics | Abbreviation |
| Liver | 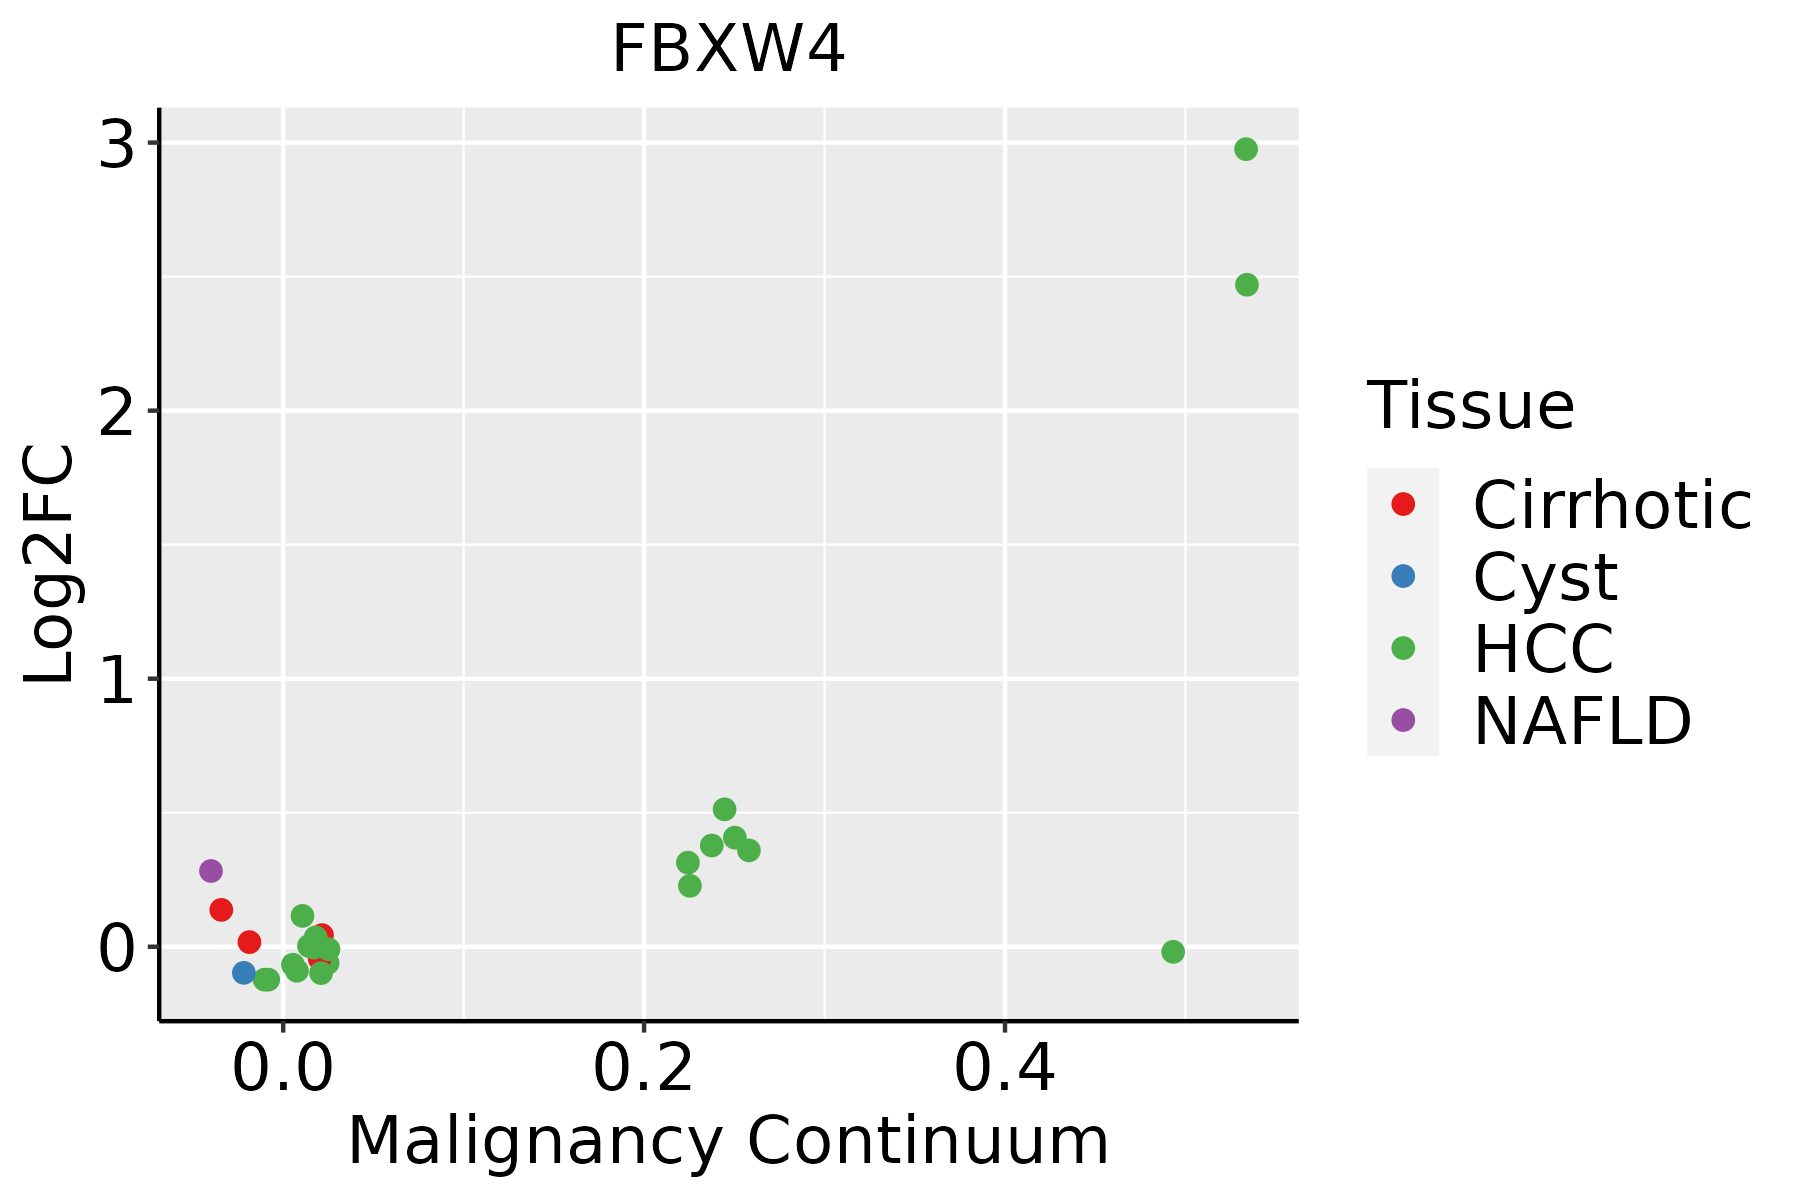 | HCC: Hepatocellular carcinoma |
| NAFLD: Non-alcoholic fatty liver disease | ||
| Oral Cavity | 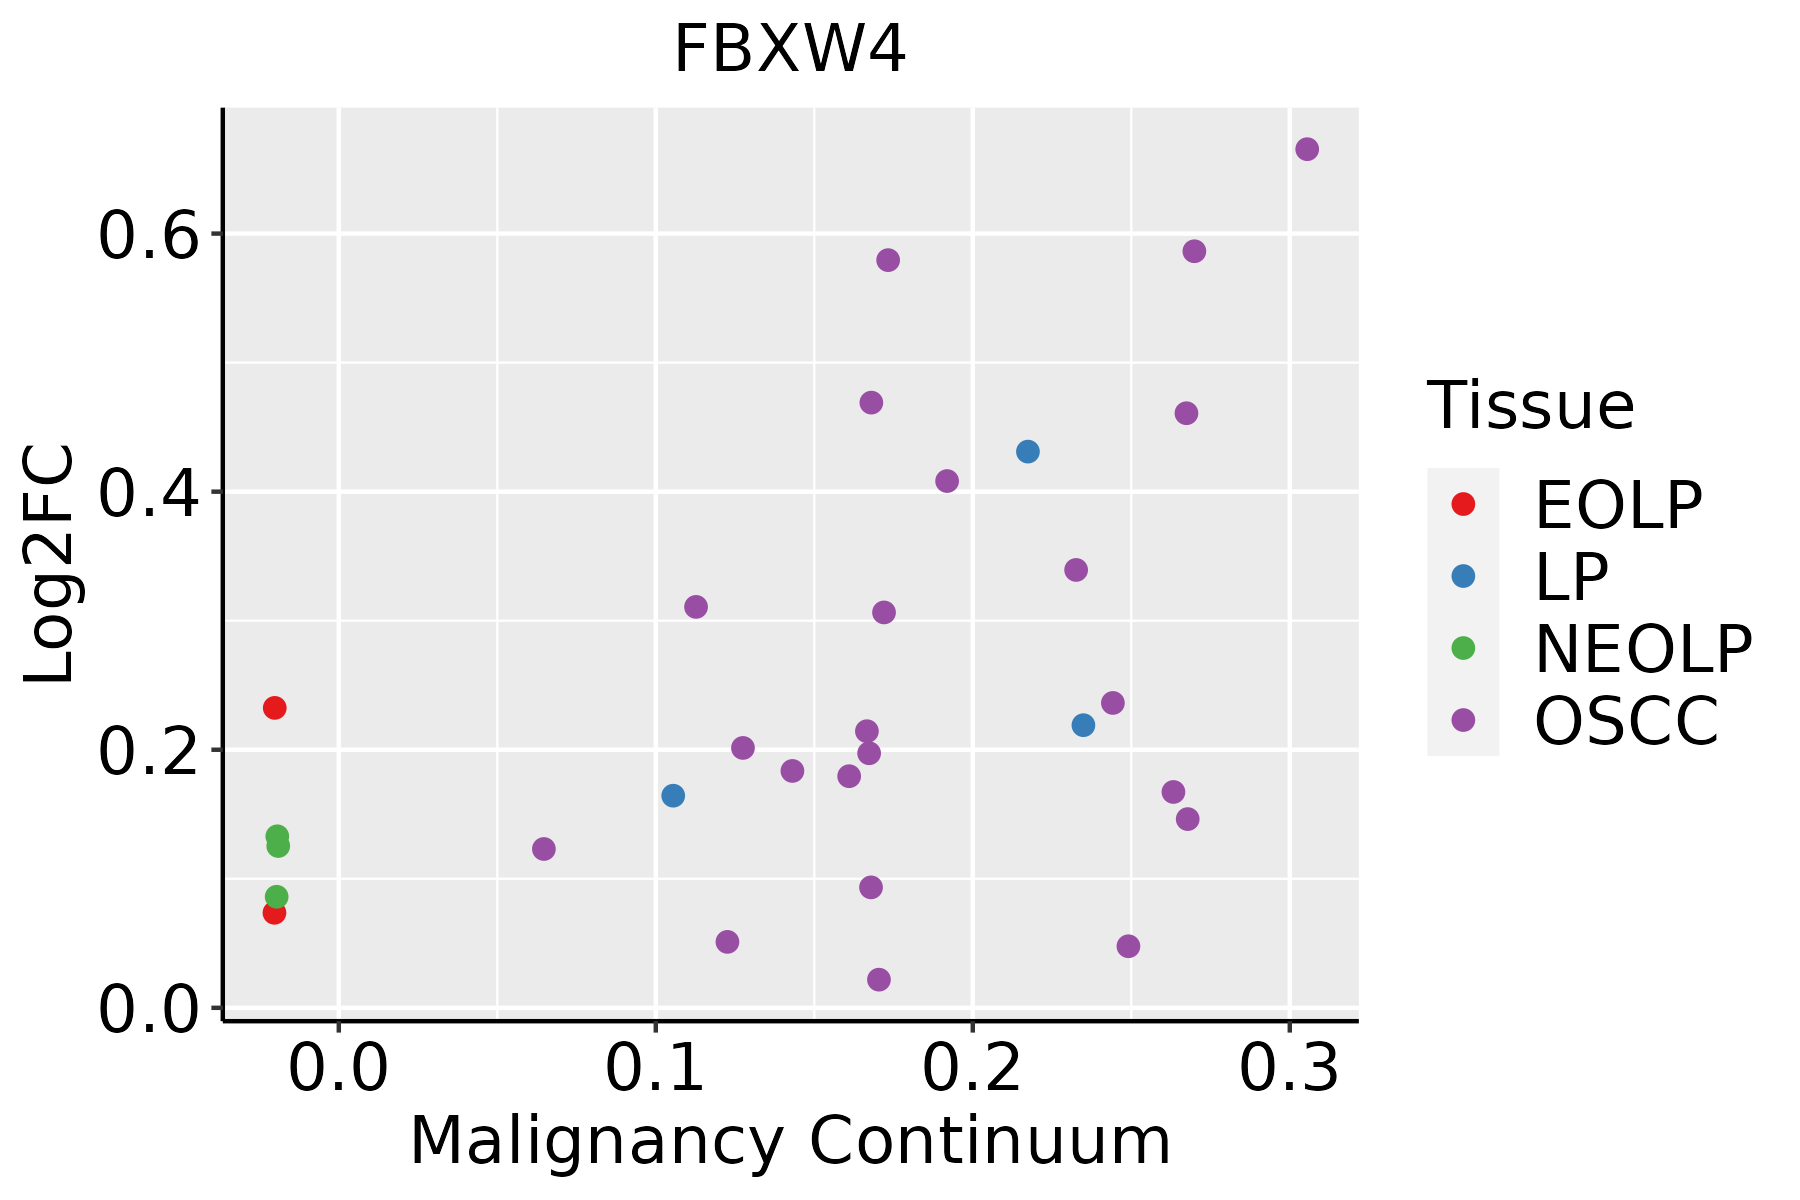 | EOLP: Erosive Oral lichen planus |
| LP: leukoplakia | ||
| NEOLP: Non-erosive oral lichen planus | ||
| OSCC: Oral squamous cell carcinoma | ||
| Thyroid |  | ATC: Anaplastic thyroid cancer |
| HT: Hashimoto's thyroiditis | ||
| PTC: Papillary thyroid cancer |
| ∗log2FC in expression of this searched gene in stem-like cells from each diseased tissue sample relative to stem-like cells in normal samples in each tissue plotted against the malignancy continuum. Samples are colored based on if they are from different disease stage. |
Top |
Malignant transformation related pathway analysis |
| Find out the enriched GO biological processes and KEGG pathways involved in transition from healthy to precancer to cancer |
| Tissue | Disease Stage | Enriched GO biological Processes |
| Colorectum | AD |  |
| Colorectum | SER |  |
| Colorectum | MSS |  |
| Colorectum | MSI-H |  |
| Colorectum | FAP |  |
| ∗Top 15 enriched GO BP terms are showed in the bar plot of each disease state in each tissue. Each row represents a significant GO biological process which is colored according to the -log10(p.adjust). |
| Page: 1 2 3 4 5 6 7 8 9 |
| GO ID | Tissue | Disease Stage | Description | Gene Ratio | Bg Ratio | pvalue | p.adjust | Count |
| GO:0198738110 | Thyroid | PTC | cell-cell signaling by wnt | 217/5968 | 446/18723 | 6.68e-14 | 3.73e-12 | 217 |
| GO:001049832 | Thyroid | ATC | proteasomal protein catabolic process | 309/6293 | 490/18723 | 1.78e-41 | 1.13e-37 | 309 |
| GO:0043161210 | Thyroid | ATC | proteasome-mediated ubiquitin-dependent protein catabolic process | 265/6293 | 412/18723 | 7.09e-38 | 1.49e-34 | 265 |
| GO:001605525 | Thyroid | ATC | Wnt signaling pathway | 234/6293 | 444/18723 | 4.64e-17 | 4.31e-15 | 234 |
| GO:019873825 | Thyroid | ATC | cell-cell signaling by wnt | 234/6293 | 446/18723 | 9.26e-17 | 8.25e-15 | 234 |
| GO:00351074 | Thyroid | ATC | appendage morphogenesis | 63/6293 | 138/18723 | 2.13e-03 | 1.00e-02 | 63 |
| GO:00351084 | Thyroid | ATC | limb morphogenesis | 63/6293 | 138/18723 | 2.13e-03 | 1.00e-02 | 63 |
| GO:00487368 | Thyroid | ATC | appendage development | 76/6293 | 172/18723 | 2.41e-03 | 1.12e-02 | 76 |
| GO:00601738 | Thyroid | ATC | limb development | 76/6293 | 172/18723 | 2.41e-03 | 1.12e-02 | 76 |
| GO:00303262 | Thyroid | ATC | embryonic limb morphogenesis | 52/6293 | 116/18723 | 7.67e-03 | 3.00e-02 | 52 |
| GO:00351132 | Thyroid | ATC | embryonic appendage morphogenesis | 52/6293 | 116/18723 | 7.67e-03 | 3.00e-02 | 52 |
| Page: 1 2 |
| Pathway ID | Tissue | Disease Stage | Description | Gene Ratio | Bg Ratio | pvalue | p.adjust | qvalue | Count |
| Page: 1 |
Top |
Cell-cell communication analysis |
| Identification of potential cell-cell interactions between two cell types and their ligand-receptor pairs for different disease states |
| Ligand | Receptor | LRpair | Pathway | Tissue | Disease Stage |
| Page: 1 |
Top |
Single-cell gene regulatory network inference analysis |
| Find out the significant the regulons (TFs) and the target genes of each regulon across cell types for different disease states |
| TF | Cell Type | Tissue | Disease Stage | Target Gene | RSS | Regulon Activity |
| ∗The dot plots of a searched regulon are shown for all cell subpopulations in each disease state of each tissue based on the regulon specific score inferred using pySCENIC and by calculating the average expression. |
| Page: 1 |
Top |
Somatic mutation of malignant transformation related genes |
| Annotation of somatic variants for genes involved in malignant transformation |
| Hugo Symbol | Variant Class | Variant Classification | dbSNP RS | HGVSc | HGVSp | HGVSp Short | SWISSPROT | BIOTYPE | SIFT | PolyPhen | Tumor Sample Barcode | Tissue | Histology | Sex | Age | Stage | Therapy Types | Drugs | Outcome |
| FBXW4 | SNV | Missense_Mutation | c.1198C>A | p.Leu400Met | p.L400M | P57775 | protein_coding | deleterious(0) | possibly_damaging(0.796) | TCGA-AN-A0AK-01 | Breast | breast invasive carcinoma | Female | >=65 | I/II | Unknown | Unknown | SD | |
| FBXW4 | SNV | Missense_Mutation | c.478G>C | p.Ala160Pro | p.A160P | P57775 | protein_coding | tolerated(0.09) | benign(0.309) | TCGA-E2-A15M-01 | Breast | breast invasive carcinoma | Female | >=65 | I/II | Hormone Therapy | arimidex | SD | |
| FBXW4 | SNV | Missense_Mutation | rs199576249 | c.973G>A | p.Val325Ile | p.V325I | P57775 | protein_coding | tolerated(0.06) | benign(0.017) | TCGA-EK-A2R7-01 | Cervix | cervical & endocervical cancer | Female | <65 | I/II | Unknown | Unknown | SD |
| FBXW4 | SNV | Missense_Mutation | c.360N>C | p.Gln120His | p.Q120H | P57775 | protein_coding | deleterious(0.02) | benign(0.359) | TCGA-Q1-A73O-01 | Cervix | cervical & endocervical cancer | Female | <65 | I/II | Chemotherapy | cisplatin | CR | |
| FBXW4 | SNV | Missense_Mutation | rs148012023 | c.1169N>A | p.Arg390His | p.R390H | P57775 | protein_coding | deleterious(0.01) | possibly_damaging(0.707) | TCGA-A6-2686-01 | Colorectum | colon adenocarcinoma | Female | >=65 | I/II | Unknown | Unknown | SD |
| FBXW4 | SNV | Missense_Mutation | novel | c.800N>A | p.Gly267Glu | p.G267E | P57775 | protein_coding | tolerated(0.52) | benign(0.015) | TCGA-A6-5659-01 | Colorectum | colon adenocarcinoma | Male | >=65 | I/II | Unknown | Unknown | SD |
| FBXW4 | SNV | Missense_Mutation | rs770806032 | c.434N>A | p.Arg145His | p.R145H | P57775 | protein_coding | tolerated(0.35) | benign(0.006) | TCGA-AA-3710-01 | Colorectum | colon adenocarcinoma | Female | >=65 | I/II | Unknown | Unknown | SD |
| FBXW4 | SNV | Missense_Mutation | c.1099N>T | p.Arg367Cys | p.R367C | P57775 | protein_coding | deleterious(0) | probably_damaging(0.996) | TCGA-AA-A022-01 | Colorectum | colon adenocarcinoma | Female | >=65 | I/II | Unknown | Unknown | SD | |
| FBXW4 | SNV | Missense_Mutation | c.758G>A | p.Ser253Asn | p.S253N | P57775 | protein_coding | tolerated(0.35) | benign(0.021) | TCGA-AG-3882-01 | Colorectum | rectum adenocarcinoma | Female | >=65 | I/II | Unknown | Unknown | SD | |
| FBXW4 | SNV | Missense_Mutation | rs781234377 | c.737N>A | p.Arg246Gln | p.R246Q | P57775 | protein_coding | deleterious(0.03) | possibly_damaging(0.773) | TCGA-A5-A0G2-01 | Endometrium | uterine corpus endometrioid carcinoma | Female | <65 | III/IV | Unknown | Unknown | SD |
| Page: 1 2 3 |
Top |
Related drugs of malignant transformation related genes |
| Identification of chemicals and drugs interact with genes involved in malignant transfromation |
| (DGIdb 4.0) |
| Entrez ID | Symbol | Category | Interaction Types | Drug Claim Name | Drug Name | PMIDs |
| Page: 1 |

Copyright 2023-Present -The University of Texas Health Science Center at Houston |