
|
|||||
|
 | |
| |
| |
| |
| |
| |
|
Gene: FBLN2 |
Gene summary for FBLN2 |
| Gene information | Species | Human | Gene symbol | FBLN2 | Gene ID | 2199 |
| Gene name | fibulin 2 | |
| Gene Alias | FBLN2 | |
| Cytomap | 3p25.1 | |
| Gene Type | protein-coding | GO ID | GO:0007155 | UniProtAcc | P98095 |
Top |
Malignant transformation analysis |
| Identification of the aberrant gene expression in precancerous and cancerous lesions by comparing the gene expression of stem-like cells in diseased tissues with normal stem cells |
| Entrez ID | Symbol | Replicates | Species | Organ | Tissue | Adj P-value | Log2FC | Malignancy |
| 2199 | FBLN2 | GSM4909281 | Human | Breast | IDC | 3.22e-54 | 7.95e-01 | 0.21 |
| 2199 | FBLN2 | GSM4909295 | Human | Breast | IDC | 5.02e-27 | 8.98e-01 | 0.0898 |
| 2199 | FBLN2 | LZE2T | Human | Esophagus | ESCC | 1.70e-07 | 4.40e-01 | 0.082 |
| 2199 | FBLN2 | P2T-E | Human | Esophagus | ESCC | 1.33e-08 | 2.39e-01 | 0.1177 |
| 2199 | FBLN2 | P5T-E | Human | Esophagus | ESCC | 1.11e-09 | 2.70e-01 | 0.1327 |
| 2199 | FBLN2 | P12T-E | Human | Esophagus | ESCC | 2.56e-05 | -3.88e-03 | 0.1122 |
| 2199 | FBLN2 | P16T-E | Human | Esophagus | ESCC | 5.49e-09 | 2.99e-01 | 0.1153 |
| 2199 | FBLN2 | P21T-E | Human | Esophagus | ESCC | 2.65e-23 | 6.03e-01 | 0.1617 |
| 2199 | FBLN2 | P26T-E | Human | Esophagus | ESCC | 8.91e-18 | 3.55e-01 | 0.1276 |
| 2199 | FBLN2 | P37T-E | Human | Esophagus | ESCC | 1.30e-19 | 7.45e-01 | 0.1371 |
| 2199 | FBLN2 | P44T-E | Human | Esophagus | ESCC | 1.54e-03 | 5.34e-01 | 0.1096 |
| 2199 | FBLN2 | P47T-E | Human | Esophagus | ESCC | 1.33e-03 | 3.30e-01 | 0.1067 |
| 2199 | FBLN2 | P56T-E | Human | Esophagus | ESCC | 1.19e-04 | 7.33e-01 | 0.1613 |
| 2199 | FBLN2 | P57T-E | Human | Esophagus | ESCC | 1.29e-03 | 8.18e-02 | 0.0926 |
| 2199 | FBLN2 | P75T-E | Human | Esophagus | ESCC | 1.79e-11 | -1.48e-01 | 0.1125 |
| 2199 | FBLN2 | P76T-E | Human | Esophagus | ESCC | 2.77e-07 | 7.97e-02 | 0.1207 |
| 2199 | FBLN2 | P79T-E | Human | Esophagus | ESCC | 6.79e-06 | 1.88e-02 | 0.1154 |
| 2199 | FBLN2 | P80T-E | Human | Esophagus | ESCC | 1.49e-04 | -9.33e-02 | 0.155 |
| 2199 | FBLN2 | P107T-E | Human | Esophagus | ESCC | 1.25e-09 | -3.67e-02 | 0.171 |
| 2199 | FBLN2 | P126T-E | Human | Esophagus | ESCC | 7.29e-03 | 1.83e-01 | 0.1125 |
| Page: 1 2 3 |
| Tissue | Expression Dynamics | Abbreviation |
| Breast | 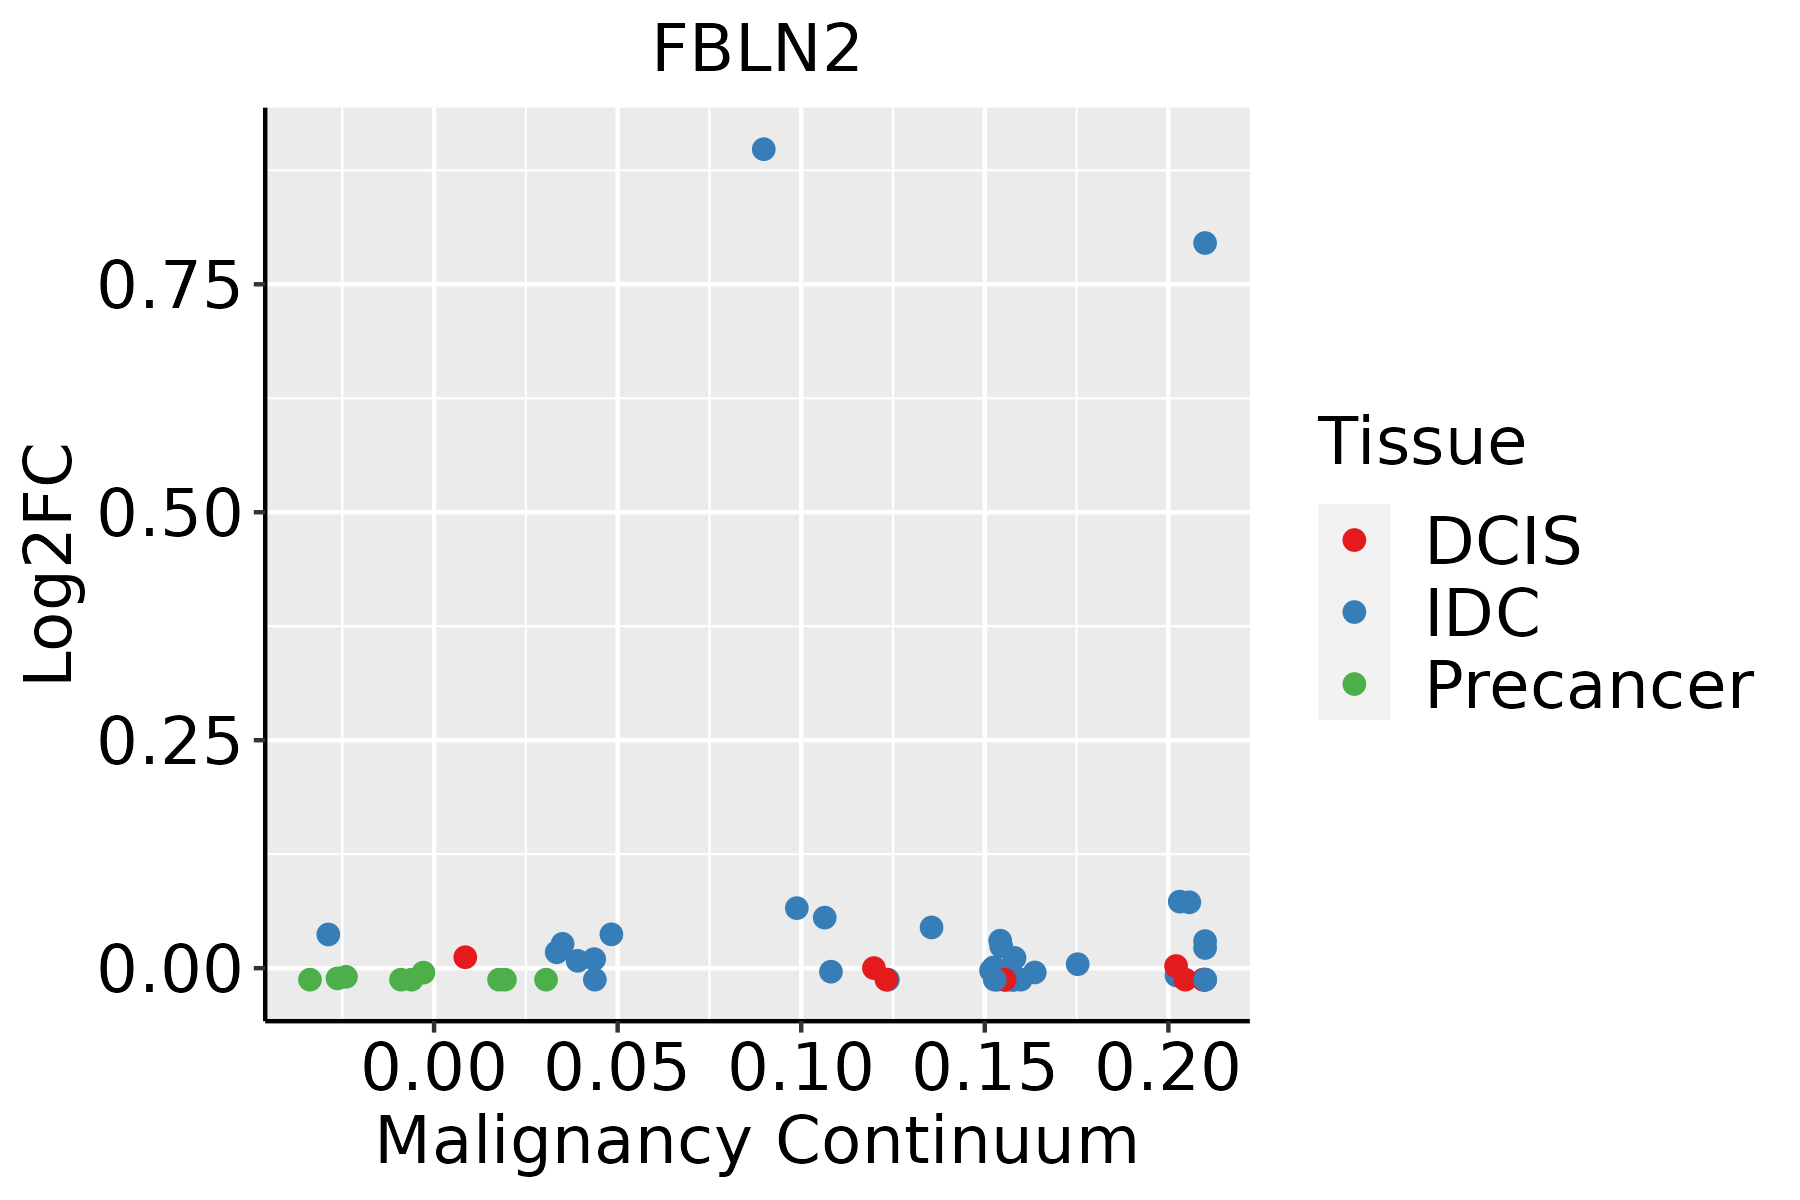 | IDC: Invasive ductal carcinoma |
| DCIS: Ductal carcinoma in situ | ||
| Precancer(BRCA1-mut): Precancerous lesion from BRCA1 mutation carriers | ||
| Esophagus | 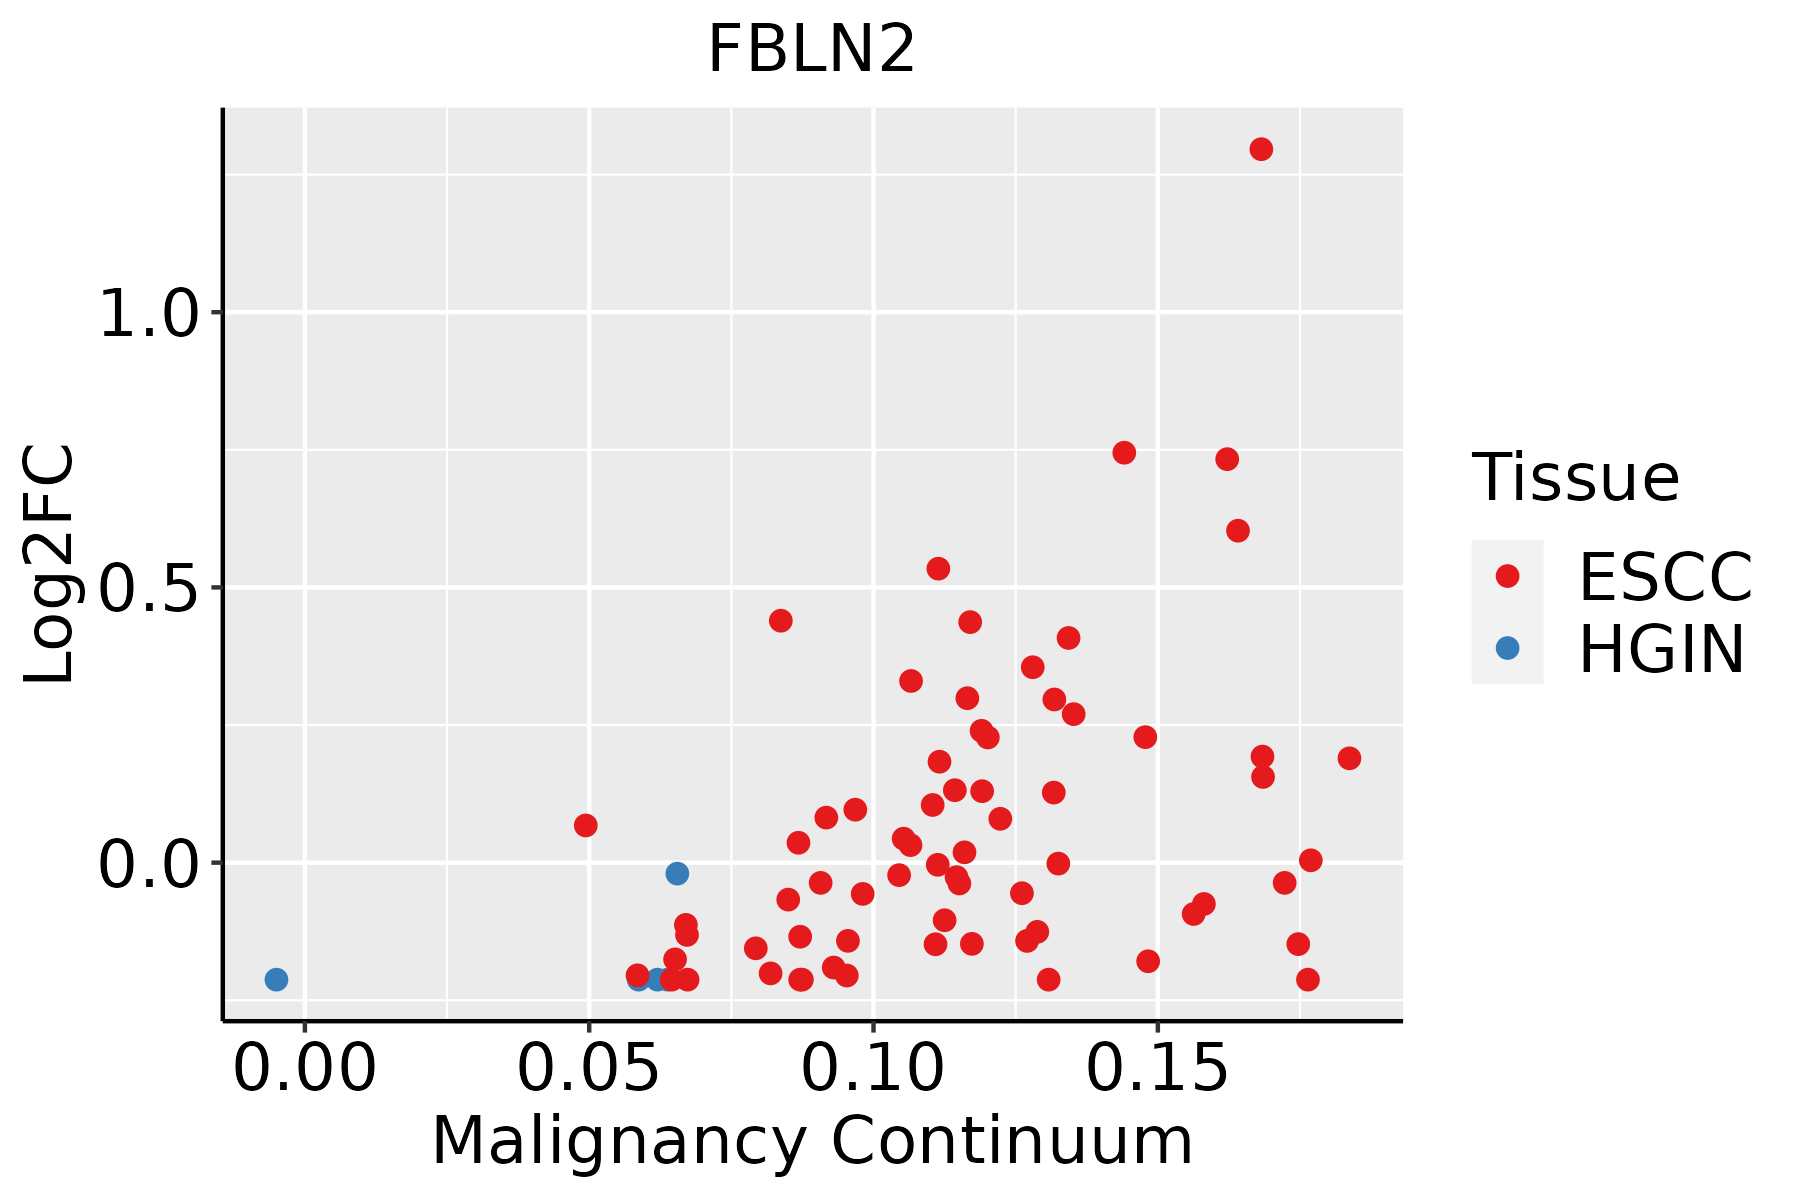 | ESCC: Esophageal squamous cell carcinoma |
| HGIN: High-grade intraepithelial neoplasias | ||
| LGIN: Low-grade intraepithelial neoplasias | ||
| Skin | 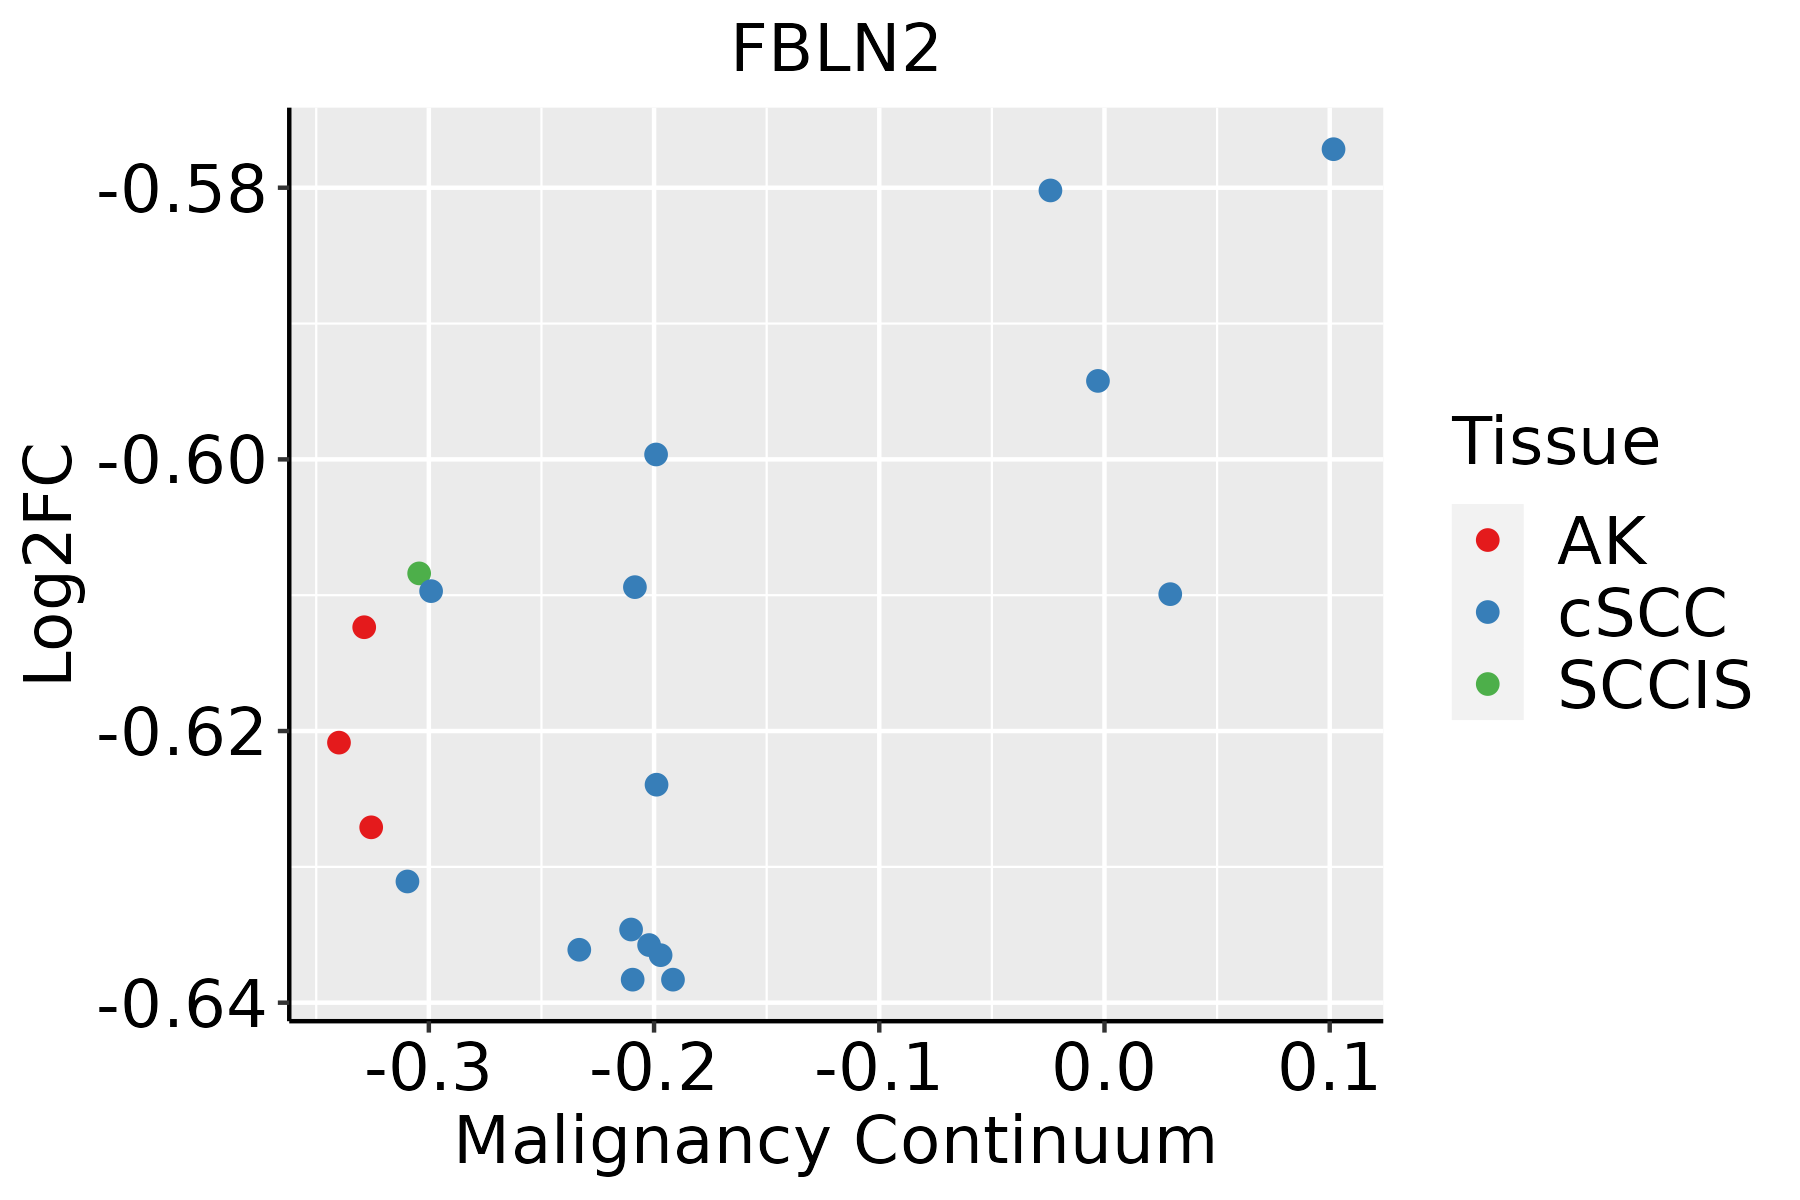 | AK: Actinic keratosis |
| cSCC: Cutaneous squamous cell carcinoma | ||
| SCCIS:squamous cell carcinoma in situ | ||
| Thyroid |  | ATC: Anaplastic thyroid cancer |
| HT: Hashimoto's thyroiditis | ||
| PTC: Papillary thyroid cancer |
| ∗log2FC in expression of this searched gene in stem-like cells from each diseased tissue sample relative to stem-like cells in normal samples in each tissue plotted against the malignancy continuum. Samples are colored based on if they are from different disease stage. |
Top |
Malignant transformation related pathway analysis |
| Find out the enriched GO biological processes and KEGG pathways involved in transition from healthy to precancer to cancer |
| Tissue | Disease Stage | Enriched GO biological Processes |
| Colorectum | AD |  |
| Colorectum | SER |  |
| Colorectum | MSS |  |
| Colorectum | MSI-H |  |
| Colorectum | FAP |  |
| ∗Top 15 enriched GO BP terms are showed in the bar plot of each disease state in each tissue. Each row represents a significant GO biological process which is colored according to the -log10(p.adjust). |
| Page: 1 2 3 4 5 6 7 8 9 |
| GO ID | Tissue | Disease Stage | Description | Gene Ratio | Bg Ratio | pvalue | p.adjust | Count |
| GO:0010811111 | Skin | SCCIS | positive regulation of cell-substrate adhesion | 16/919 | 123/18723 | 3.41e-04 | 5.86e-03 | 16 |
| GO:001081027 | Skin | cSCC | regulation of cell-substrate adhesion | 88/4864 | 221/18723 | 4.26e-06 | 6.32e-05 | 88 |
| GO:003158926 | Skin | cSCC | cell-substrate adhesion | 130/4864 | 363/18723 | 1.87e-05 | 2.23e-04 | 130 |
| GO:004578529 | Skin | cSCC | positive regulation of cell adhesion | 139/4864 | 437/18723 | 3.39e-03 | 1.84e-02 | 139 |
| GO:001081128 | Skin | cSCC | positive regulation of cell-substrate adhesion | 46/4864 | 123/18723 | 3.41e-03 | 1.85e-02 | 46 |
| GO:003158928 | Thyroid | ATC | cell-substrate adhesion | 195/6293 | 363/18723 | 1.58e-15 | 1.17e-13 | 195 |
| GO:001081029 | Thyroid | ATC | regulation of cell-substrate adhesion | 128/6293 | 221/18723 | 8.74e-14 | 4.57e-12 | 128 |
| GO:003019812 | Thyroid | ATC | extracellular matrix organization | 152/6293 | 301/18723 | 8.63e-10 | 2.24e-08 | 152 |
| GO:004306212 | Thyroid | ATC | extracellular structure organization | 152/6293 | 302/18723 | 1.17e-09 | 2.94e-08 | 152 |
| GO:004522912 | Thyroid | ATC | external encapsulating structure organization | 152/6293 | 304/18723 | 2.11e-09 | 5.08e-08 | 152 |
| GO:0010811210 | Thyroid | ATC | positive regulation of cell-substrate adhesion | 73/6293 | 123/18723 | 4.12e-09 | 9.37e-08 | 73 |
| GO:0045785210 | Thyroid | ATC | positive regulation of cell adhesion | 194/6293 | 437/18723 | 1.40e-06 | 1.75e-05 | 194 |
| Page: 1 2 |
| Pathway ID | Tissue | Disease Stage | Description | Gene Ratio | Bg Ratio | pvalue | p.adjust | qvalue | Count |
| Page: 1 |
Top |
Cell-cell communication analysis |
| Identification of potential cell-cell interactions between two cell types and their ligand-receptor pairs for different disease states |
| Ligand | Receptor | LRpair | Pathway | Tissue | Disease Stage |
| Page: 1 |
Top |
Single-cell gene regulatory network inference analysis |
| Find out the significant the regulons (TFs) and the target genes of each regulon across cell types for different disease states |
| TF | Cell Type | Tissue | Disease Stage | Target Gene | RSS | Regulon Activity |
| ∗The dot plots of a searched regulon are shown for all cell subpopulations in each disease state of each tissue based on the regulon specific score inferred using pySCENIC and by calculating the average expression. |
| Page: 1 |
Top |
Somatic mutation of malignant transformation related genes |
| Annotation of somatic variants for genes involved in malignant transformation |
| Hugo Symbol | Variant Class | Variant Classification | dbSNP RS | HGVSc | HGVSp | HGVSp Short | SWISSPROT | BIOTYPE | SIFT | PolyPhen | Tumor Sample Barcode | Tissue | Histology | Sex | Age | Stage | Therapy Types | Drugs | Outcome |
| FBLN2 | SNV | Missense_Mutation | c.1675N>G | p.Leu559Val | p.L559V | P98095 | protein_coding | tolerated(0.11) | possibly_damaging(0.84) | TCGA-A8-A06Q-01 | Breast | breast invasive carcinoma | Female | <65 | III/IV | Unknown | Unknown | SD | |
| FBLN2 | SNV | Missense_Mutation | novel | c.538N>G | p.Asn180Asp | p.N180D | P98095 | protein_coding | deleterious(0.03) | possibly_damaging(0.84) | TCGA-AN-A046-01 | Breast | breast invasive carcinoma | Female | >=65 | I/II | Unknown | Unknown | SD |
| FBLN2 | SNV | Missense_Mutation | c.1084N>A | p.Leu362Met | p.L362M | P98095 | protein_coding | tolerated(0.24) | benign(0.332) | TCGA-AO-A128-01 | Breast | breast invasive carcinoma | Female | <65 | I/II | Chemotherapy | doxorubicin | SD | |
| FBLN2 | SNV | Missense_Mutation | novel | c.3630N>C | p.Trp1210Cys | p.W1210C | P98095 | protein_coding | deleterious(0) | probably_damaging(0.997) | TCGA-AQ-A54N-01 | Breast | breast invasive carcinoma | Female | <65 | I/II | Unknown | Unknown | SD |
| FBLN2 | SNV | Missense_Mutation | rs751893647 | c.3185N>T | p.Thr1062Ile | p.T1062I | P98095 | protein_coding | deleterious(0) | possibly_damaging(0.798) | TCGA-AR-A0TY-01 | Breast | breast invasive carcinoma | Female | <65 | I/II | Unspecific | Paclitaxel | PD |
| FBLN2 | SNV | Missense_Mutation | c.2564G>C | p.Cys855Ser | p.C855S | P98095 | protein_coding | deleterious(0) | benign(0.065) | TCGA-AR-A24Q-01 | Breast | breast invasive carcinoma | Female | <65 | I/II | Chemotherapy | doxorubicin | SD | |
| FBLN2 | SNV | Missense_Mutation | c.2872N>T | p.Arg958Cys | p.R958C | P98095 | protein_coding | deleterious(0) | probably_damaging(0.999) | TCGA-BH-A18M-01 | Breast | breast invasive carcinoma | Female | <65 | III/IV | Unknown | Unknown | SD | |
| FBLN2 | SNV | Missense_Mutation | c.3343N>A | p.Cys1115Ser | p.C1115S | P98095 | protein_coding | deleterious(0) | probably_damaging(0.998) | TCGA-D8-A1XK-01 | Breast | breast invasive carcinoma | Female | <65 | I/II | Chemotherapy | doxorubicine+cyclophosphamide | SD | |
| FBLN2 | insertion | Frame_Shift_Ins | novel | c.2135_2136insT | p.Asp713GlyfsTer6 | p.D713Gfs*6 | P98095 | protein_coding | TCGA-AO-A03T-01 | Breast | breast invasive carcinoma | Female | <65 | I/II | Chemotherapy | cyclophosphamide | SD | ||
| FBLN2 | insertion | Frame_Shift_Ins | novel | c.2136_2137insGTGCTGGGTATGTGCAA | p.Asp713ValfsTer18 | p.D713Vfs*18 | P98095 | protein_coding | TCGA-AO-A03T-01 | Breast | breast invasive carcinoma | Female | <65 | I/II | Chemotherapy | cyclophosphamide | SD |
| Page: 1 2 3 4 5 6 7 8 9 10 11 12 13 |
Top |
Related drugs of malignant transformation related genes |
| Identification of chemicals and drugs interact with genes involved in malignant transfromation |
| (DGIdb 4.0) |
| Entrez ID | Symbol | Category | Interaction Types | Drug Claim Name | Drug Name | PMIDs |
| Page: 1 |

Copyright 2023-Present -The University of Texas Health Science Center at Houston |