
|
|||||
|
 | |
| |
| |
| |
| |
| |
|
Gene: FASTKD5 |
Gene summary for FASTKD5 |
| Gene information | Species | Human | Gene symbol | FASTKD5 | Gene ID | 60493 |
| Gene name | FAST kinase domains 5 | |
| Gene Alias | dJ1187M17.5 | |
| Cytomap | 20p13 | |
| Gene Type | protein-coding | GO ID | GO:0000959 | UniProtAcc | Q7L8L6 |
Top |
Malignant transformation analysis |
| Identification of the aberrant gene expression in precancerous and cancerous lesions by comparing the gene expression of stem-like cells in diseased tissues with normal stem cells |
| Entrez ID | Symbol | Replicates | Species | Organ | Tissue | Adj P-value | Log2FC | Malignancy |
| 60493 | FASTKD5 | LZE24T | Human | Esophagus | ESCC | 5.40e-03 | 1.49e-01 | 0.0596 |
| 60493 | FASTKD5 | LZE21T | Human | Esophagus | ESCC | 2.90e-02 | 1.57e-01 | 0.0655 |
| 60493 | FASTKD5 | P2T-E | Human | Esophagus | ESCC | 6.76e-11 | 1.96e-01 | 0.1177 |
| 60493 | FASTKD5 | P4T-E | Human | Esophagus | ESCC | 1.91e-11 | 1.34e-01 | 0.1323 |
| 60493 | FASTKD5 | P8T-E | Human | Esophagus | ESCC | 1.97e-11 | 1.32e-01 | 0.0889 |
| 60493 | FASTKD5 | P9T-E | Human | Esophagus | ESCC | 1.98e-07 | 1.66e-01 | 0.1131 |
| 60493 | FASTKD5 | P10T-E | Human | Esophagus | ESCC | 8.34e-24 | 2.48e-01 | 0.116 |
| 60493 | FASTKD5 | P12T-E | Human | Esophagus | ESCC | 1.76e-13 | 3.03e-01 | 0.1122 |
| 60493 | FASTKD5 | P15T-E | Human | Esophagus | ESCC | 7.73e-07 | 1.43e-01 | 0.1149 |
| 60493 | FASTKD5 | P16T-E | Human | Esophagus | ESCC | 3.12e-04 | 9.55e-02 | 0.1153 |
| 60493 | FASTKD5 | P21T-E | Human | Esophagus | ESCC | 5.12e-11 | 1.31e-01 | 0.1617 |
| 60493 | FASTKD5 | P22T-E | Human | Esophagus | ESCC | 4.04e-07 | 5.32e-02 | 0.1236 |
| 60493 | FASTKD5 | P23T-E | Human | Esophagus | ESCC | 3.38e-11 | 3.58e-01 | 0.108 |
| 60493 | FASTKD5 | P24T-E | Human | Esophagus | ESCC | 1.24e-14 | 1.00e-01 | 0.1287 |
| 60493 | FASTKD5 | P26T-E | Human | Esophagus | ESCC | 7.57e-49 | 9.63e-01 | 0.1276 |
| 60493 | FASTKD5 | P27T-E | Human | Esophagus | ESCC | 9.29e-06 | 4.97e-02 | 0.1055 |
| 60493 | FASTKD5 | P28T-E | Human | Esophagus | ESCC | 2.15e-14 | 3.12e-01 | 0.1149 |
| 60493 | FASTKD5 | P30T-E | Human | Esophagus | ESCC | 3.10e-13 | 4.23e-01 | 0.137 |
| 60493 | FASTKD5 | P31T-E | Human | Esophagus | ESCC | 2.00e-12 | 1.77e-01 | 0.1251 |
| 60493 | FASTKD5 | P32T-E | Human | Esophagus | ESCC | 6.93e-10 | 8.18e-02 | 0.1666 |
| Page: 1 2 3 |
| Tissue | Expression Dynamics | Abbreviation |
| Esophagus | 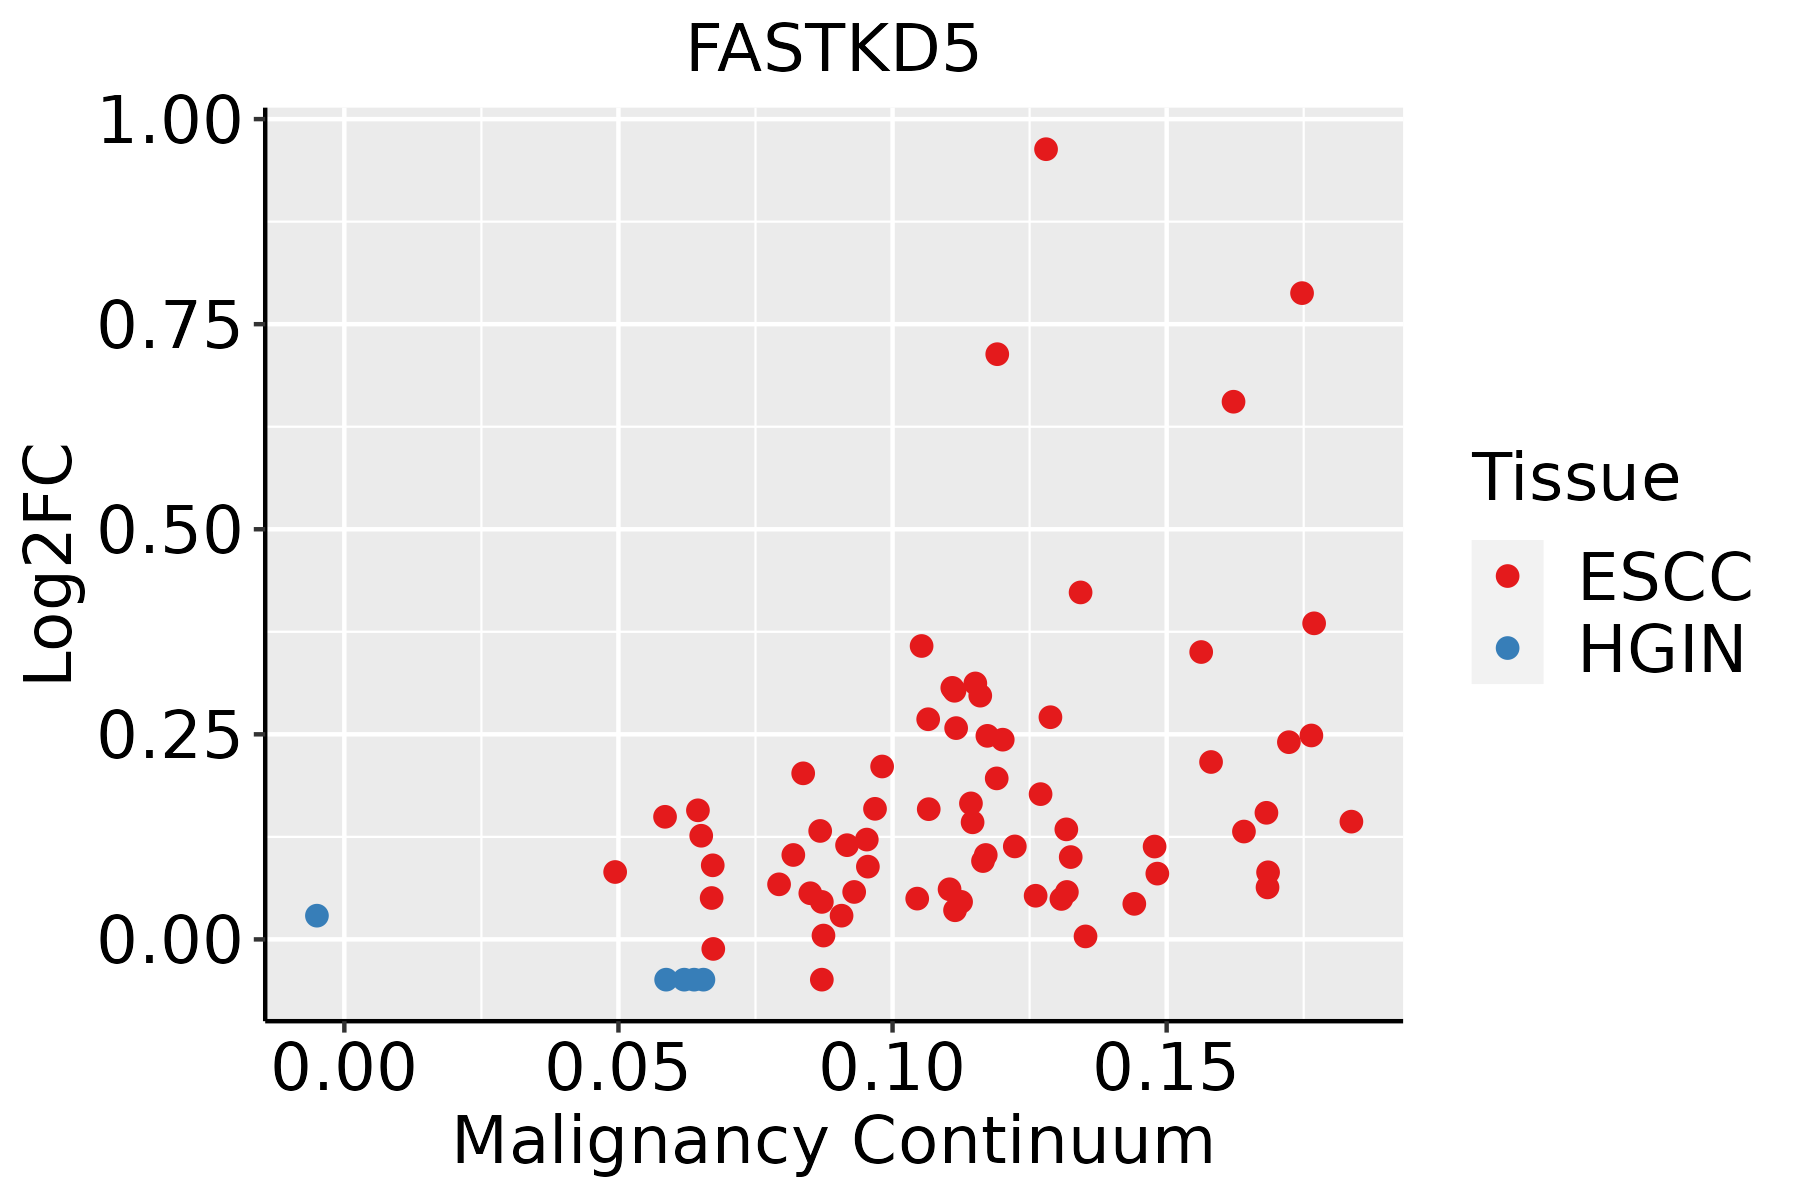 | ESCC: Esophageal squamous cell carcinoma |
| HGIN: High-grade intraepithelial neoplasias | ||
| LGIN: Low-grade intraepithelial neoplasias | ||
| Oral Cavity | 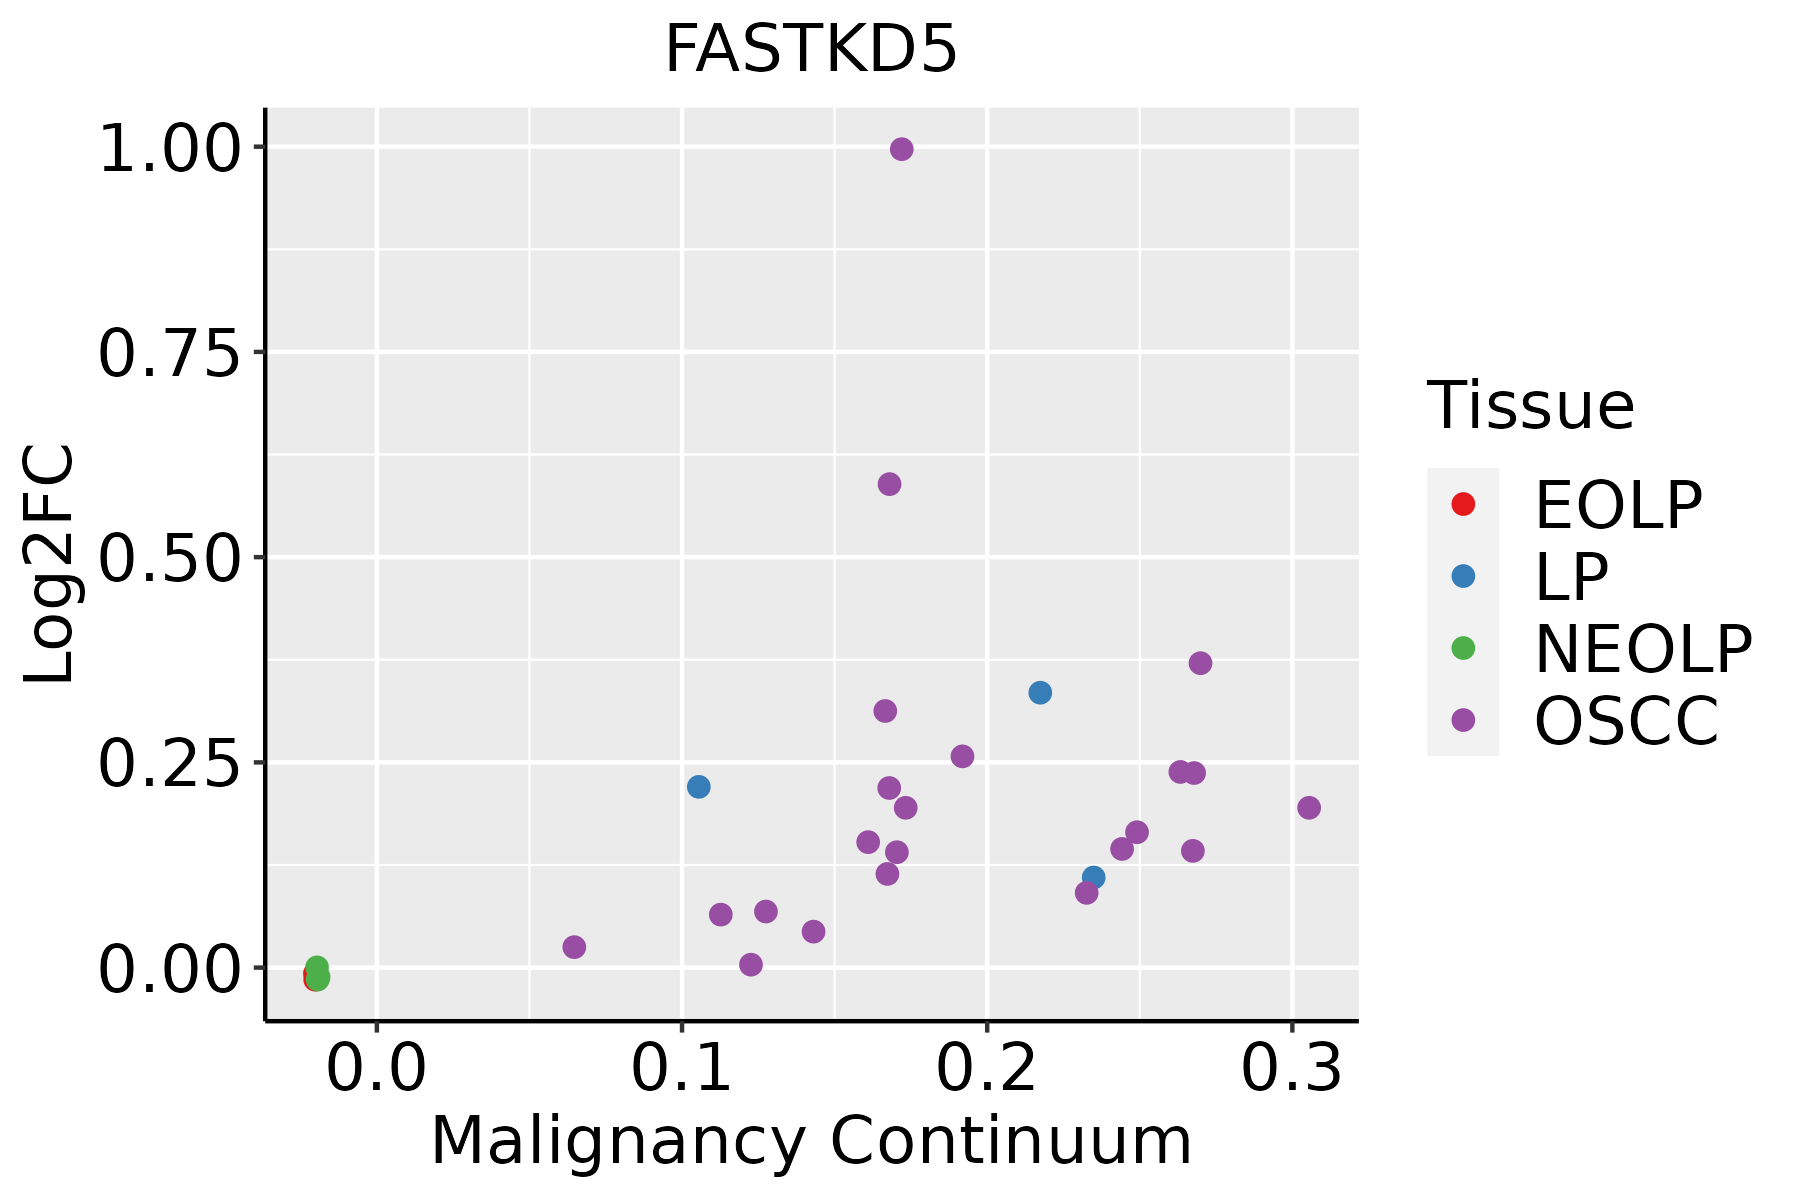 | EOLP: Erosive Oral lichen planus |
| LP: leukoplakia | ||
| NEOLP: Non-erosive oral lichen planus | ||
| OSCC: Oral squamous cell carcinoma |
| ∗log2FC in expression of this searched gene in stem-like cells from each diseased tissue sample relative to stem-like cells in normal samples in each tissue plotted against the malignancy continuum. Samples are colored based on if they are from different disease stage. |
Top |
Malignant transformation related pathway analysis |
| Find out the enriched GO biological processes and KEGG pathways involved in transition from healthy to precancer to cancer |
| Tissue | Disease Stage | Enriched GO biological Processes |
| Colorectum | AD |  |
| Colorectum | SER |  |
| Colorectum | MSS |  |
| Colorectum | MSI-H |  |
| Colorectum | FAP |  |
| ∗Top 15 enriched GO BP terms are showed in the bar plot of each disease state in each tissue. Each row represents a significant GO biological process which is colored according to the -log10(p.adjust). |
| Page: 1 2 3 4 5 6 7 8 9 |
| GO ID | Tissue | Disease Stage | Description | Gene Ratio | Bg Ratio | pvalue | p.adjust | Count |
| GO:001943915 | Oral cavity | OSCC | aromatic compound catabolic process | 263/7305 | 467/18723 | 1.49e-14 | 8.84e-13 | 263 |
| GO:190136115 | Oral cavity | OSCC | organic cyclic compound catabolic process | 272/7305 | 495/18723 | 2.73e-13 | 1.36e-11 | 272 |
| GO:01400533 | Oral cavity | OSCC | mitochondrial gene expression | 78/7305 | 108/18723 | 2.37e-12 | 9.86e-11 | 78 |
| GO:006101316 | Oral cavity | OSCC | regulation of mRNA catabolic process | 105/7305 | 166/18723 | 2.04e-10 | 5.82e-09 | 105 |
| GO:004348716 | Oral cavity | OSCC | regulation of RNA stability | 106/7305 | 170/18723 | 5.65e-10 | 1.47e-08 | 106 |
| GO:004348816 | Oral cavity | OSCC | regulation of mRNA stability | 99/7305 | 158/18723 | 1.41e-09 | 3.39e-08 | 99 |
| GO:00009591 | Oral cavity | OSCC | mitochondrial RNA metabolic process | 29/7305 | 49/18723 | 3.33e-03 | 1.42e-02 | 29 |
| GO:0000963 | Oral cavity | OSCC | mitochondrial RNA processing | 14/7305 | 20/18723 | 4.95e-03 | 1.94e-02 | 14 |
| Page: 1 2 |
| Pathway ID | Tissue | Disease Stage | Description | Gene Ratio | Bg Ratio | pvalue | p.adjust | qvalue | Count |
| Page: 1 |
Top |
Cell-cell communication analysis |
| Identification of potential cell-cell interactions between two cell types and their ligand-receptor pairs for different disease states |
| Ligand | Receptor | LRpair | Pathway | Tissue | Disease Stage |
| Page: 1 |
Top |
Single-cell gene regulatory network inference analysis |
| Find out the significant the regulons (TFs) and the target genes of each regulon across cell types for different disease states |
| TF | Cell Type | Tissue | Disease Stage | Target Gene | RSS | Regulon Activity |
| ∗The dot plots of a searched regulon are shown for all cell subpopulations in each disease state of each tissue based on the regulon specific score inferred using pySCENIC and by calculating the average expression. |
| Page: 1 |
Top |
Somatic mutation of malignant transformation related genes |
| Annotation of somatic variants for genes involved in malignant transformation |
| Hugo Symbol | Variant Class | Variant Classification | dbSNP RS | HGVSc | HGVSp | HGVSp Short | SWISSPROT | BIOTYPE | SIFT | PolyPhen | Tumor Sample Barcode | Tissue | Histology | Sex | Age | Stage | Therapy Types | Drugs | Outcome |
| FASTKD5 | SNV | Missense_Mutation | c.2050N>A | p.Leu684Met | p.L684M | Q7L8L6 | protein_coding | tolerated(0.17) | possibly_damaging(0.548) | TCGA-AN-A0AK-01 | Breast | breast invasive carcinoma | Female | >=65 | I/II | Unknown | Unknown | SD | |
| FASTKD5 | SNV | Missense_Mutation | novel | c.2053N>G | p.Cys685Gly | p.C685G | Q7L8L6 | protein_coding | tolerated(0.39) | benign(0) | TCGA-AN-A0XV-01 | Breast | breast invasive carcinoma | Female | >=65 | III/IV | Unknown | Unknown | SD |
| FASTKD5 | SNV | Missense_Mutation | c.131N>T | p.Pro44Leu | p.P44L | Q7L8L6 | protein_coding | tolerated(0.38) | benign(0.001) | TCGA-BH-A0HF-01 | Breast | breast invasive carcinoma | Female | >=65 | I/II | Hormone Therapy | arimidex | SD | |
| FASTKD5 | SNV | Missense_Mutation | rs767011584 | c.1202N>T | p.Ser401Leu | p.S401L | Q7L8L6 | protein_coding | deleterious(0) | probably_damaging(0.925) | TCGA-BH-A1EV-01 | Breast | breast invasive carcinoma | Female | <65 | III/IV | Unknown | Unknown | PD |
| FASTKD5 | SNV | Missense_Mutation | novel | c.122N>C | p.Gln41Pro | p.Q41P | Q7L8L6 | protein_coding | tolerated(0.08) | benign(0) | TCGA-E9-A5UP-01 | Breast | breast invasive carcinoma | Female | <65 | I/II | Hormone Therapy | tamoxiphen | SD |
| FASTKD5 | SNV | Missense_Mutation | rs754823337 | c.2237N>A | p.Arg746Gln | p.R746Q | Q7L8L6 | protein_coding | tolerated(0.06) | benign(0.164) | TCGA-2W-A8YY-01 | Cervix | cervical & endocervical cancer | Female | <65 | I/II | Chemotherapy | cisplatin | CR |
| FASTKD5 | SNV | Missense_Mutation | rs371032615 | c.2059N>A | p.Ala687Thr | p.A687T | Q7L8L6 | protein_coding | tolerated(0.55) | benign(0.011) | TCGA-2W-A8YY-01 | Cervix | cervical & endocervical cancer | Female | <65 | I/II | Chemotherapy | cisplatin | CR |
| FASTKD5 | SNV | Missense_Mutation | novel | c.1798N>T | p.Pro600Ser | p.P600S | Q7L8L6 | protein_coding | deleterious(0) | possibly_damaging(0.873) | TCGA-2W-A8YY-01 | Cervix | cervical & endocervical cancer | Female | <65 | I/II | Chemotherapy | cisplatin | CR |
| FASTKD5 | SNV | Missense_Mutation | c.59C>T | p.Ser20Phe | p.S20F | Q7L8L6 | protein_coding | tolerated(0.22) | benign(0) | TCGA-EK-A2R7-01 | Cervix | cervical & endocervical cancer | Female | <65 | I/II | Unknown | Unknown | SD | |
| FASTKD5 | SNV | Missense_Mutation | rs547200037 | c.2258N>T | p.Ala753Val | p.A753V | Q7L8L6 | protein_coding | deleterious(0.02) | possibly_damaging(0.85) | TCGA-A6-2686-01 | Colorectum | colon adenocarcinoma | Female | >=65 | I/II | Unknown | Unknown | SD |
| Page: 1 2 3 4 5 6 7 8 |
Top |
Related drugs of malignant transformation related genes |
| Identification of chemicals and drugs interact with genes involved in malignant transfromation |
| (DGIdb 4.0) |
| Entrez ID | Symbol | Category | Interaction Types | Drug Claim Name | Drug Name | PMIDs |
| Page: 1 |

Copyright 2023-Present -The University of Texas Health Science Center at Houston |