
|
|||||
|
 | |
| |
| |
| |
| |
| |
|
Gene: FASTKD1 |
Gene summary for FASTKD1 |
| Gene information | Species | Human | Gene symbol | FASTKD1 | Gene ID | 79675 |
| Gene name | FAST kinase domains 1 | |
| Gene Alias | FASTKD1 | |
| Cytomap | 2q31.1 | |
| Gene Type | protein-coding | GO ID | GO:0000959 | UniProtAcc | Q53R41 |
Top |
Malignant transformation analysis |
| Identification of the aberrant gene expression in precancerous and cancerous lesions by comparing the gene expression of stem-like cells in diseased tissues with normal stem cells |
| Entrez ID | Symbol | Replicates | Species | Organ | Tissue | Adj P-value | Log2FC | Malignancy |
| 79675 | FASTKD1 | HTA11_3410_2000001011 | Human | Colorectum | AD | 1.52e-02 | -3.35e-01 | 0.0155 |
| 79675 | FASTKD1 | HTA11_347_2000001011 | Human | Colorectum | AD | 1.62e-13 | 6.64e-01 | -0.1954 |
| 79675 | FASTKD1 | HTA11_99999974143_84620 | Human | Colorectum | MSS | 4.13e-03 | -2.60e-01 | 0.3005 |
| 79675 | FASTKD1 | A001-C-207 | Human | Colorectum | FAP | 5.25e-07 | -3.58e-01 | 0.1278 |
| 79675 | FASTKD1 | A015-C-203 | Human | Colorectum | FAP | 5.51e-25 | -4.03e-01 | -0.1294 |
| 79675 | FASTKD1 | A015-C-204 | Human | Colorectum | FAP | 2.10e-04 | -2.32e-01 | -0.0228 |
| 79675 | FASTKD1 | A014-C-040 | Human | Colorectum | FAP | 2.21e-04 | -3.34e-01 | -0.1184 |
| 79675 | FASTKD1 | A002-C-201 | Human | Colorectum | FAP | 7.81e-14 | -3.68e-01 | 0.0324 |
| 79675 | FASTKD1 | A002-C-203 | Human | Colorectum | FAP | 8.34e-09 | -2.66e-01 | 0.2786 |
| 79675 | FASTKD1 | A001-C-119 | Human | Colorectum | FAP | 1.06e-07 | -4.06e-01 | -0.1557 |
| 79675 | FASTKD1 | A001-C-108 | Human | Colorectum | FAP | 5.41e-17 | -2.93e-01 | -0.0272 |
| 79675 | FASTKD1 | A002-C-205 | Human | Colorectum | FAP | 2.78e-19 | -3.28e-01 | -0.1236 |
| 79675 | FASTKD1 | A001-C-104 | Human | Colorectum | FAP | 4.93e-08 | -2.94e-01 | 0.0184 |
| 79675 | FASTKD1 | A015-C-005 | Human | Colorectum | FAP | 8.27e-05 | -2.55e-01 | -0.0336 |
| 79675 | FASTKD1 | A015-C-006 | Human | Colorectum | FAP | 6.08e-14 | -2.83e-01 | -0.0994 |
| 79675 | FASTKD1 | A015-C-106 | Human | Colorectum | FAP | 1.03e-11 | -2.42e-01 | -0.0511 |
| 79675 | FASTKD1 | A002-C-114 | Human | Colorectum | FAP | 1.23e-17 | -4.00e-01 | -0.1561 |
| 79675 | FASTKD1 | A015-C-104 | Human | Colorectum | FAP | 5.18e-28 | -3.25e-01 | -0.1899 |
| 79675 | FASTKD1 | A001-C-014 | Human | Colorectum | FAP | 2.23e-14 | -3.41e-01 | 0.0135 |
| 79675 | FASTKD1 | A002-C-016 | Human | Colorectum | FAP | 1.14e-22 | -3.61e-01 | 0.0521 |
| Page: 1 2 3 4 5 |
| Tissue | Expression Dynamics | Abbreviation |
| Colorectum (GSE201348) |  | FAP: Familial adenomatous polyposis |
| CRC: Colorectal cancer | ||
| Colorectum (HTA11) |  | AD: Adenomas |
| SER: Sessile serrated lesions | ||
| MSI-H: Microsatellite-high colorectal cancer | ||
| MSS: Microsatellite stable colorectal cancer | ||
| Esophagus | 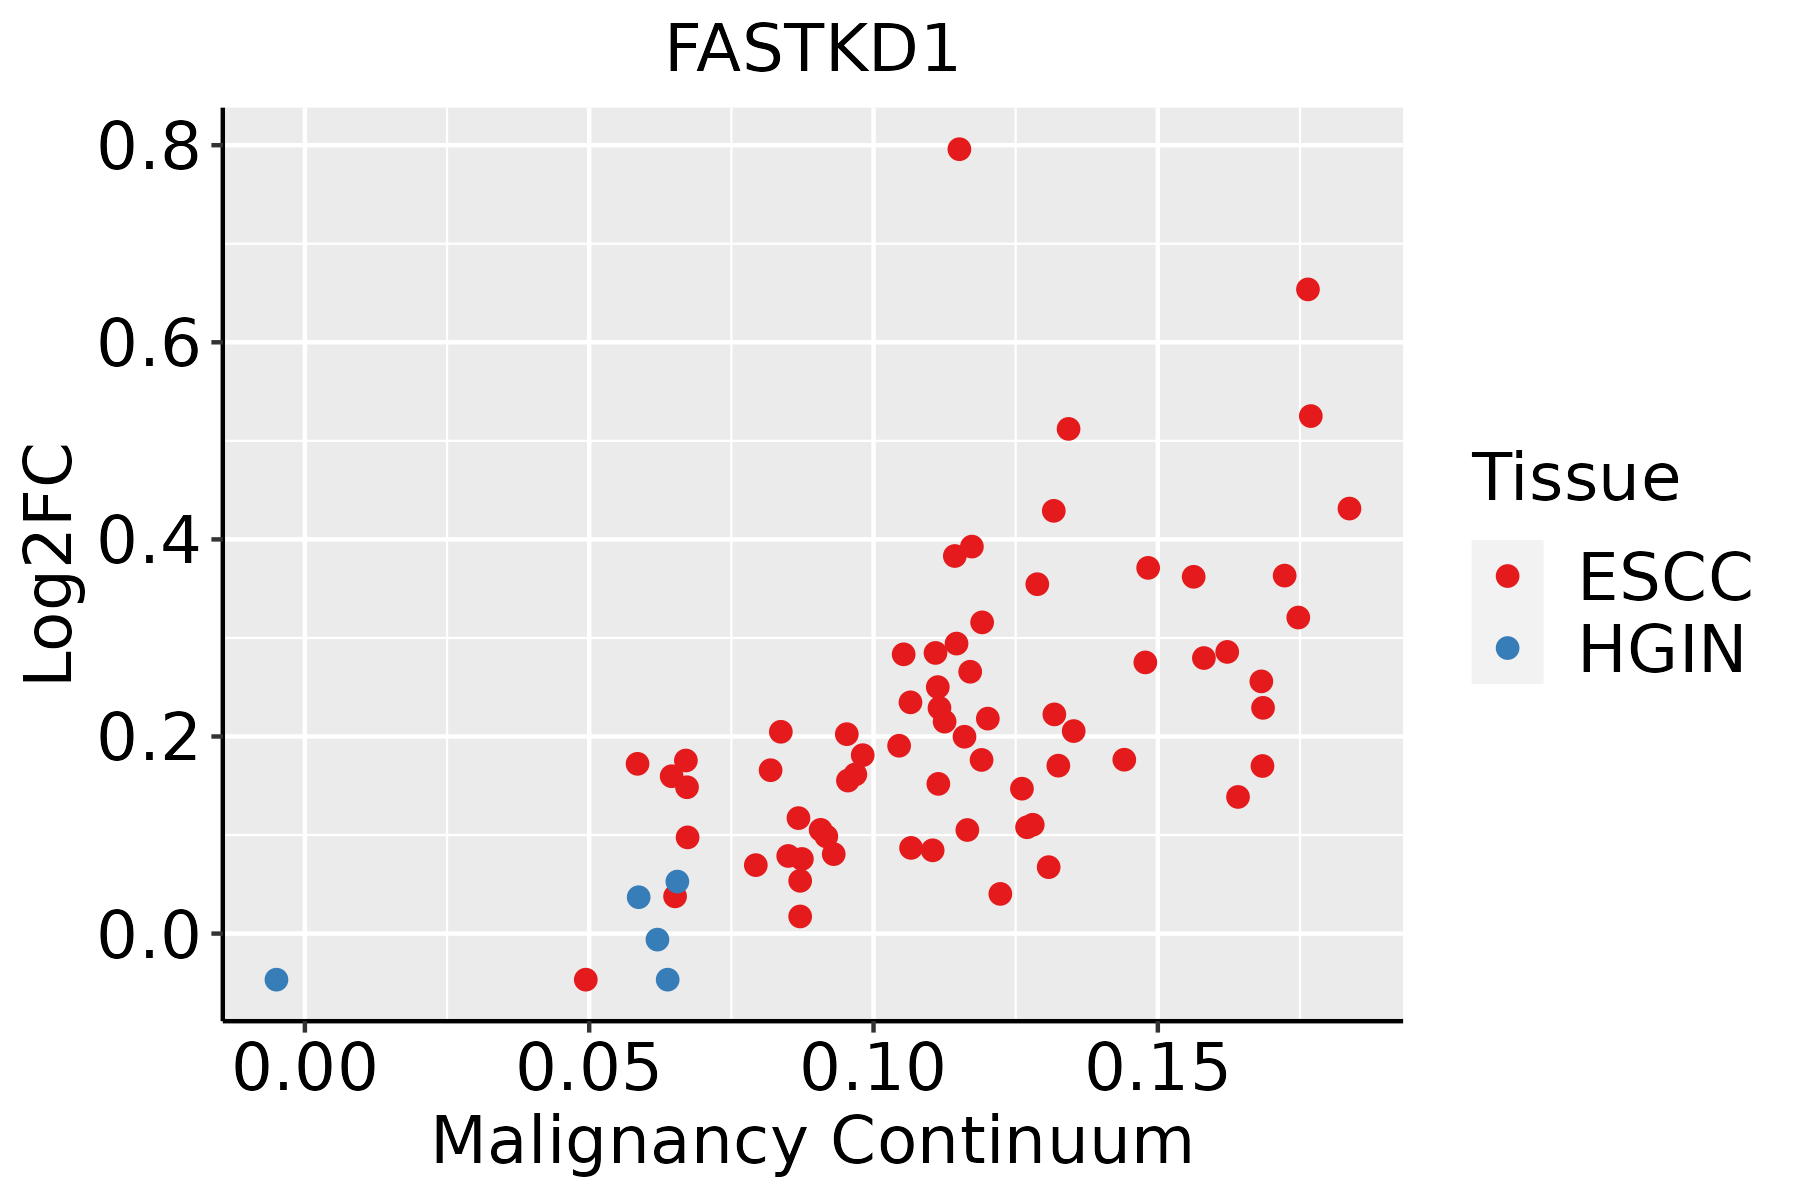 | ESCC: Esophageal squamous cell carcinoma |
| HGIN: High-grade intraepithelial neoplasias | ||
| LGIN: Low-grade intraepithelial neoplasias | ||
| Liver | 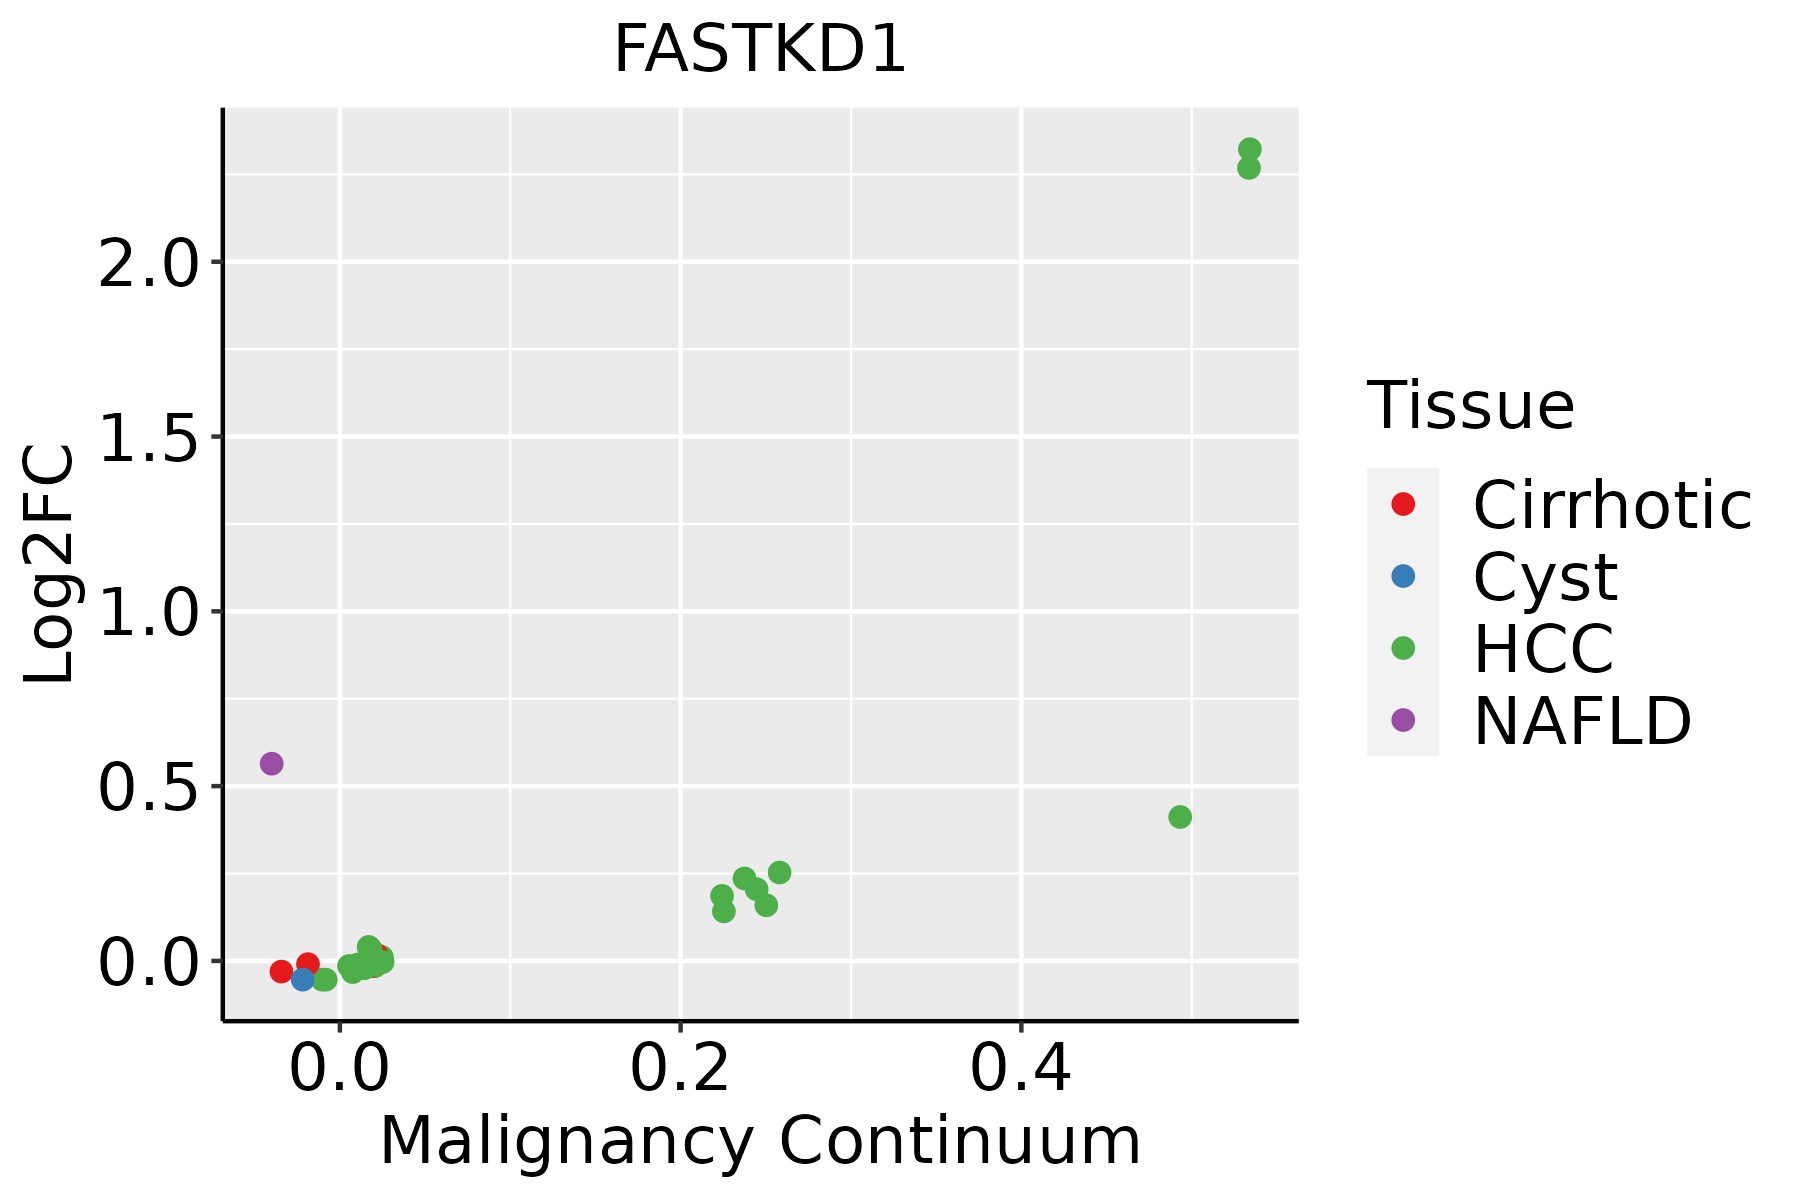 | HCC: Hepatocellular carcinoma |
| NAFLD: Non-alcoholic fatty liver disease |
| ∗log2FC in expression of this searched gene in stem-like cells from each diseased tissue sample relative to stem-like cells in normal samples in each tissue plotted against the malignancy continuum. Samples are colored based on if they are from different disease stage. |
Top |
Malignant transformation related pathway analysis |
| Find out the enriched GO biological processes and KEGG pathways involved in transition from healthy to precancer to cancer |
| Tissue | Disease Stage | Enriched GO biological Processes |
| Colorectum | AD |  |
| Colorectum | SER |  |
| Colorectum | MSS |  |
| Colorectum | MSI-H |  |
| Colorectum | FAP |  |
| ∗Top 15 enriched GO BP terms are showed in the bar plot of each disease state in each tissue. Each row represents a significant GO biological process which is colored according to the -log10(p.adjust). |
| Page: 1 2 3 4 5 6 7 8 9 |
| GO ID | Tissue | Disease Stage | Description | Gene Ratio | Bg Ratio | pvalue | p.adjust | Count |
| GO:00434882 | Colorectum | MSS | regulation of mRNA stability | 62/3467 | 158/18723 | 8.41e-10 | 6.81e-08 | 62 |
| GO:00194392 | Colorectum | MSS | aromatic compound catabolic process | 140/3467 | 467/18723 | 8.56e-10 | 6.85e-08 | 140 |
| GO:19033114 | Colorectum | FAP | regulation of mRNA metabolic process | 97/2622 | 288/18723 | 1.35e-17 | 4.13e-14 | 97 |
| GO:00610134 | Colorectum | FAP | regulation of mRNA catabolic process | 54/2622 | 166/18723 | 8.64e-10 | 1.96e-07 | 54 |
| GO:00064024 | Colorectum | FAP | mRNA catabolic process | 68/2622 | 232/18723 | 9.87e-10 | 2.16e-07 | 68 |
| GO:00064014 | Colorectum | FAP | RNA catabolic process | 77/2622 | 278/18723 | 1.42e-09 | 2.77e-07 | 77 |
| GO:00434874 | Colorectum | FAP | regulation of RNA stability | 53/2622 | 170/18723 | 6.61e-09 | 1.00e-06 | 53 |
| GO:00434884 | Colorectum | FAP | regulation of mRNA stability | 50/2622 | 158/18723 | 1.01e-08 | 1.27e-06 | 50 |
| GO:00442704 | Colorectum | FAP | cellular nitrogen compound catabolic process | 101/2622 | 451/18723 | 7.42e-07 | 3.44e-05 | 101 |
| GO:00346554 | Colorectum | FAP | nucleobase-containing compound catabolic process | 92/2622 | 407/18723 | 1.50e-06 | 6.49e-05 | 92 |
| GO:00467004 | Colorectum | FAP | heterocycle catabolic process | 98/2622 | 445/18723 | 2.36e-06 | 9.21e-05 | 98 |
| GO:00194394 | Colorectum | FAP | aromatic compound catabolic process | 100/2622 | 467/18723 | 6.75e-06 | 2.08e-04 | 100 |
| GO:19013614 | Colorectum | FAP | organic cyclic compound catabolic process | 101/2622 | 495/18723 | 4.87e-05 | 9.93e-04 | 101 |
| GO:19033115 | Colorectum | CRC | regulation of mRNA metabolic process | 80/2078 | 288/18723 | 3.21e-15 | 6.40e-12 | 80 |
| GO:00064025 | Colorectum | CRC | mRNA catabolic process | 58/2078 | 232/18723 | 1.77e-09 | 5.31e-07 | 58 |
| GO:00610135 | Colorectum | CRC | regulation of mRNA catabolic process | 45/2078 | 166/18723 | 8.14e-09 | 1.85e-06 | 45 |
| GO:00064015 | Colorectum | CRC | RNA catabolic process | 63/2078 | 278/18723 | 2.21e-08 | 3.23e-06 | 63 |
| GO:00434885 | Colorectum | CRC | regulation of mRNA stability | 40/2078 | 158/18723 | 3.96e-07 | 3.21e-05 | 40 |
| GO:00434875 | Colorectum | CRC | regulation of RNA stability | 41/2078 | 170/18723 | 1.13e-06 | 6.69e-05 | 41 |
| GO:00346555 | Colorectum | CRC | nucleobase-containing compound catabolic process | 73/2078 | 407/18723 | 2.28e-05 | 6.57e-04 | 73 |
| Page: 1 2 3 4 5 |
| Pathway ID | Tissue | Disease Stage | Description | Gene Ratio | Bg Ratio | pvalue | p.adjust | qvalue | Count |
| Page: 1 |
Top |
Cell-cell communication analysis |
| Identification of potential cell-cell interactions between two cell types and their ligand-receptor pairs for different disease states |
| Ligand | Receptor | LRpair | Pathway | Tissue | Disease Stage |
| Page: 1 |
Top |
Single-cell gene regulatory network inference analysis |
| Find out the significant the regulons (TFs) and the target genes of each regulon across cell types for different disease states |
| TF | Cell Type | Tissue | Disease Stage | Target Gene | RSS | Regulon Activity |
| ∗The dot plots of a searched regulon are shown for all cell subpopulations in each disease state of each tissue based on the regulon specific score inferred using pySCENIC and by calculating the average expression. |
| Page: 1 |
Top |
Somatic mutation of malignant transformation related genes |
| Annotation of somatic variants for genes involved in malignant transformation |
| Hugo Symbol | Variant Class | Variant Classification | dbSNP RS | HGVSc | HGVSp | HGVSp Short | SWISSPROT | BIOTYPE | SIFT | PolyPhen | Tumor Sample Barcode | Tissue | Histology | Sex | Age | Stage | Therapy Types | Drugs | Outcome |
| FASTKD1 | SNV | Missense_Mutation | novel | c.966N>T | p.Lys322Asn | p.K322N | Q53R41 | protein_coding | deleterious(0.02) | possibly_damaging(0.776) | TCGA-AN-A046-01 | Breast | breast invasive carcinoma | Female | >=65 | I/II | Unknown | Unknown | SD |
| FASTKD1 | SNV | Missense_Mutation | c.2168C>G | p.Thr723Arg | p.T723R | Q53R41 | protein_coding | deleterious(0) | probably_damaging(0.988) | TCGA-AN-A0AR-01 | Breast | breast invasive carcinoma | Female | <65 | I/II | Unknown | Unknown | SD | |
| FASTKD1 | SNV | Missense_Mutation | c.1285C>G | p.Pro429Ala | p.P429A | Q53R41 | protein_coding | tolerated(0.26) | benign(0.006) | TCGA-AN-A0AT-01 | Breast | breast invasive carcinoma | Female | <65 | I/II | Unknown | Unknown | SD | |
| FASTKD1 | SNV | Missense_Mutation | c.2031N>C | p.Gln677His | p.Q677H | Q53R41 | protein_coding | tolerated(0.23) | benign(0.41) | TCGA-BH-A0BZ-01 | Breast | breast invasive carcinoma | Female | <65 | III/IV | Chemotherapy | doxorubicin | CR | |
| FASTKD1 | SNV | Missense_Mutation | c.90A>T | p.Gln30His | p.Q30H | Q53R41 | protein_coding | tolerated(0.39) | benign(0.003) | TCGA-EW-A1PB-01 | Breast | breast invasive carcinoma | Female | >=65 | III/IV | Unknown | Unknown | SD | |
| FASTKD1 | insertion | In_Frame_Ins | novel | c.1032_1033insACGAAAGTTAAACTCCAT | p.Val344_Leu345insThrLysValLysLeuHis | p.V344_L345insTKVKLH | Q53R41 | protein_coding | TCGA-B6-A0I6-01 | Breast | breast invasive carcinoma | Female | <65 | I/II | Unknown | Unknown | PD | ||
| FASTKD1 | SNV | Missense_Mutation | c.142N>C | p.Asp48His | p.D48H | Q53R41 | protein_coding | tolerated(0.38) | benign(0.025) | TCGA-C5-A7CL-01 | Cervix | cervical & endocervical cancer | Female | <65 | III/IV | Chemotherapy | cisplatin | PD | |
| FASTKD1 | SNV | Missense_Mutation | novel | c.404N>C | p.Leu135Pro | p.L135P | Q53R41 | protein_coding | deleterious(0) | probably_damaging(1) | TCGA-C5-A7UE-01 | Cervix | cervical & endocervical cancer | Female | <65 | I/II | Chemotherapy | cisplatin | SD |
| FASTKD1 | SNV | Missense_Mutation | rs758111477 | c.1970N>C | p.Arg657Thr | p.R657T | Q53R41 | protein_coding | tolerated(0.07) | benign(0.175) | TCGA-JW-A5VL-01 | Cervix | cervical & endocervical cancer | Female | <65 | I/II | Unknown | Unknown | SD |
| FASTKD1 | SNV | Missense_Mutation | novel | c.336N>A | p.Met112Ile | p.M112I | Q53R41 | protein_coding | deleterious(0) | benign(0.238) | TCGA-VS-A94Z-01 | Cervix | cervical & endocervical cancer | Female | <65 | I/II | Chemotherapy | cisplatin | CR |
| Page: 1 2 3 4 5 6 7 8 9 10 11 |
Top |
Related drugs of malignant transformation related genes |
| Identification of chemicals and drugs interact with genes involved in malignant transfromation |
| (DGIdb 4.0) |
| Entrez ID | Symbol | Category | Interaction Types | Drug Claim Name | Drug Name | PMIDs |
| Page: 1 |

Copyright 2023-Present -The University of Texas Health Science Center at Houston |