Schematic overview of the cellular and molecular mechanisms involved in the cancer progression, including the proposed cellular and molecular mechanisms in cancer cells trajectory. AT1: alveolar type 1 cells; AT2: alveolar type 2 cells; AAH: atypical adenomatous hyperplasia; AIS: adenocarcinoma in situ; MIA: minimally invasive adenocarcinoma; IA: invasive adenocarcinoma; EMT: epithelial-mesenchymal transition

Home

Download

Statistics

Help

Contact

Center for Computational Systems Medicine
leaf

Gene summary

leaf

Malignant transformation analysis

leaf

Malignant transformation related pathway analysis

leaf

Cell-cell communication analysis

leaf

Single-cell gene regulatory network inference analysis

leaf

Somatic mutation of malignant transformation related genes

leaf

Related drugs of malignant transformation related genes

Gene: FANCA

Gene summary for FANCA

check button Gene summary.

Gene informationSpeciesHuman
Gene symbol

FANCA

Gene ID

2175

Gene nameFA complementation group A
Gene AliasFA
Cytomap16q24.3
Gene Typeprotein-coding
GO ID

GO:0000003

UniProtAcc

O15360


Top

Malignant transformation analysis

check button Identification of the aberrant gene expression in precancerous and cancerous lesions by comparing the gene expression of stem-like cells in diseased tissues with normal stem cells
check button Malignant transformation involving gene list.
Entrez IDSymbolReplicatesSpeciesOrganTissueAdj P-valueLog2FCMalignancy
2175FANCAHSIL_HPV_2HumanCervixHSIL_HPV5.11e-031.82e-010.0208
2175FANCACCI_1HumanCervixCC1.45e-116.31e-010.528
2175FANCACCI_2HumanCervixCC9.85e-074.98e-010.5249
2175FANCACCI_3HumanCervixCC5.99e-105.98e-010.516
2175FANCACCII_1HumanCervixCC1.80e-032.37e-010.3249
2175FANCAHTA11_99999965062_69753HumanColorectumMSI-H1.06e-029.45e-010.3487
2175FANCAA001-C-119HumanColorectumFAP6.05e-065.42e-01-0.1557
2175FANCAGSM6177623_NYU_UCEC3_VisHumanEndometriumEEC7.76e-032.05e-01-0.1269
2175FANCAHCC1_MengHumanLiverHCC3.81e-092.18e-020.0246
2175FANCAHCC2HumanLiverHCC6.36e-041.91e+000.5341
2175FANCAS014HumanLiverHCC5.35e-145.96e-010.2254
2175FANCAS015HumanLiverHCC8.83e-042.82e-010.2375
2175FANCAS016HumanLiverHCC7.99e-103.32e-010.2243
2175FANCAS027HumanLiverHCC4.43e-033.05e-010.2446
2175FANCAS028HumanLiverHCC1.82e-032.37e-010.2503
2175FANCAS029HumanLiverHCC1.90e-032.07e-010.2581
2175FANCAC04HumanOral cavityOSCC5.49e-093.66e-010.2633
2175FANCAC21HumanOral cavityOSCC5.81e-298.35e-010.2678
2175FANCAC30HumanOral cavityOSCC8.26e-093.52e-010.3055
2175FANCAC38HumanOral cavityOSCC9.35e-074.10e-010.172
Page: 1 2 

check button Transcriptomic changes along malignancy continuum.
TissueExpression DynamicsAbbreviation
CervixThe image shows the transcriptomic changes along malignancy continuum.log2FC in expression of this searched gene in stem-like cells from each diseased tissue sample relative to stem-like cells in normal samples in each tissue plotted against the malignancy continuum. Samples are colored based on if they are from different disease stage.CC: Cervix cancer
HSIL_HPV: HPV-infected high-grade squamous intraepithelial lesions
N_HPV: HPV-infected normal cervix
Colorectum (GSE201348)The image shows the transcriptomic changes along malignancy continuum.log2FC in expression of this searched gene in stem-like cells from each diseased tissue sample relative to stem-like cells in normal samples in each tissue plotted against the malignancy continuum. Samples are colored based on if they are from different disease stage.FAP: Familial adenomatous polyposis
CRC: Colorectal cancer
Colorectum (HTA11)The image shows the transcriptomic changes along malignancy continuum.log2FC in expression of this searched gene in stem-like cells from each diseased tissue sample relative to stem-like cells in normal samples in each tissue plotted against the malignancy continuum. Samples are colored based on if they are from different disease stage.AD: Adenomas
SER: Sessile serrated lesions
MSI-H: Microsatellite-high colorectal cancer
MSS: Microsatellite stable colorectal cancer
EndometriumThe image shows the transcriptomic changes along malignancy continuum.log2FC in expression of this searched gene in stem-like cells from each diseased tissue sample relative to stem-like cells in normal samples in each tissue plotted against the malignancy continuum. Samples are colored based on if they are from different disease stage.AEH: Atypical endometrial hyperplasia
EEC: Endometrioid Cancer
LiverThe image shows the transcriptomic changes along malignancy continuum.log2FC in expression of this searched gene in stem-like cells from each diseased tissue sample relative to stem-like cells in normal samples in each tissue plotted against the malignancy continuum. Samples are colored based on if they are from different disease stage.HCC: Hepatocellular carcinoma
NAFLD: Non-alcoholic fatty liver disease
Oral CavityThe image shows the transcriptomic changes along malignancy continuum.log2FC in expression of this searched gene in stem-like cells from each diseased tissue sample relative to stem-like cells in normal samples in each tissue plotted against the malignancy continuum. Samples are colored based on if they are from different disease stage.
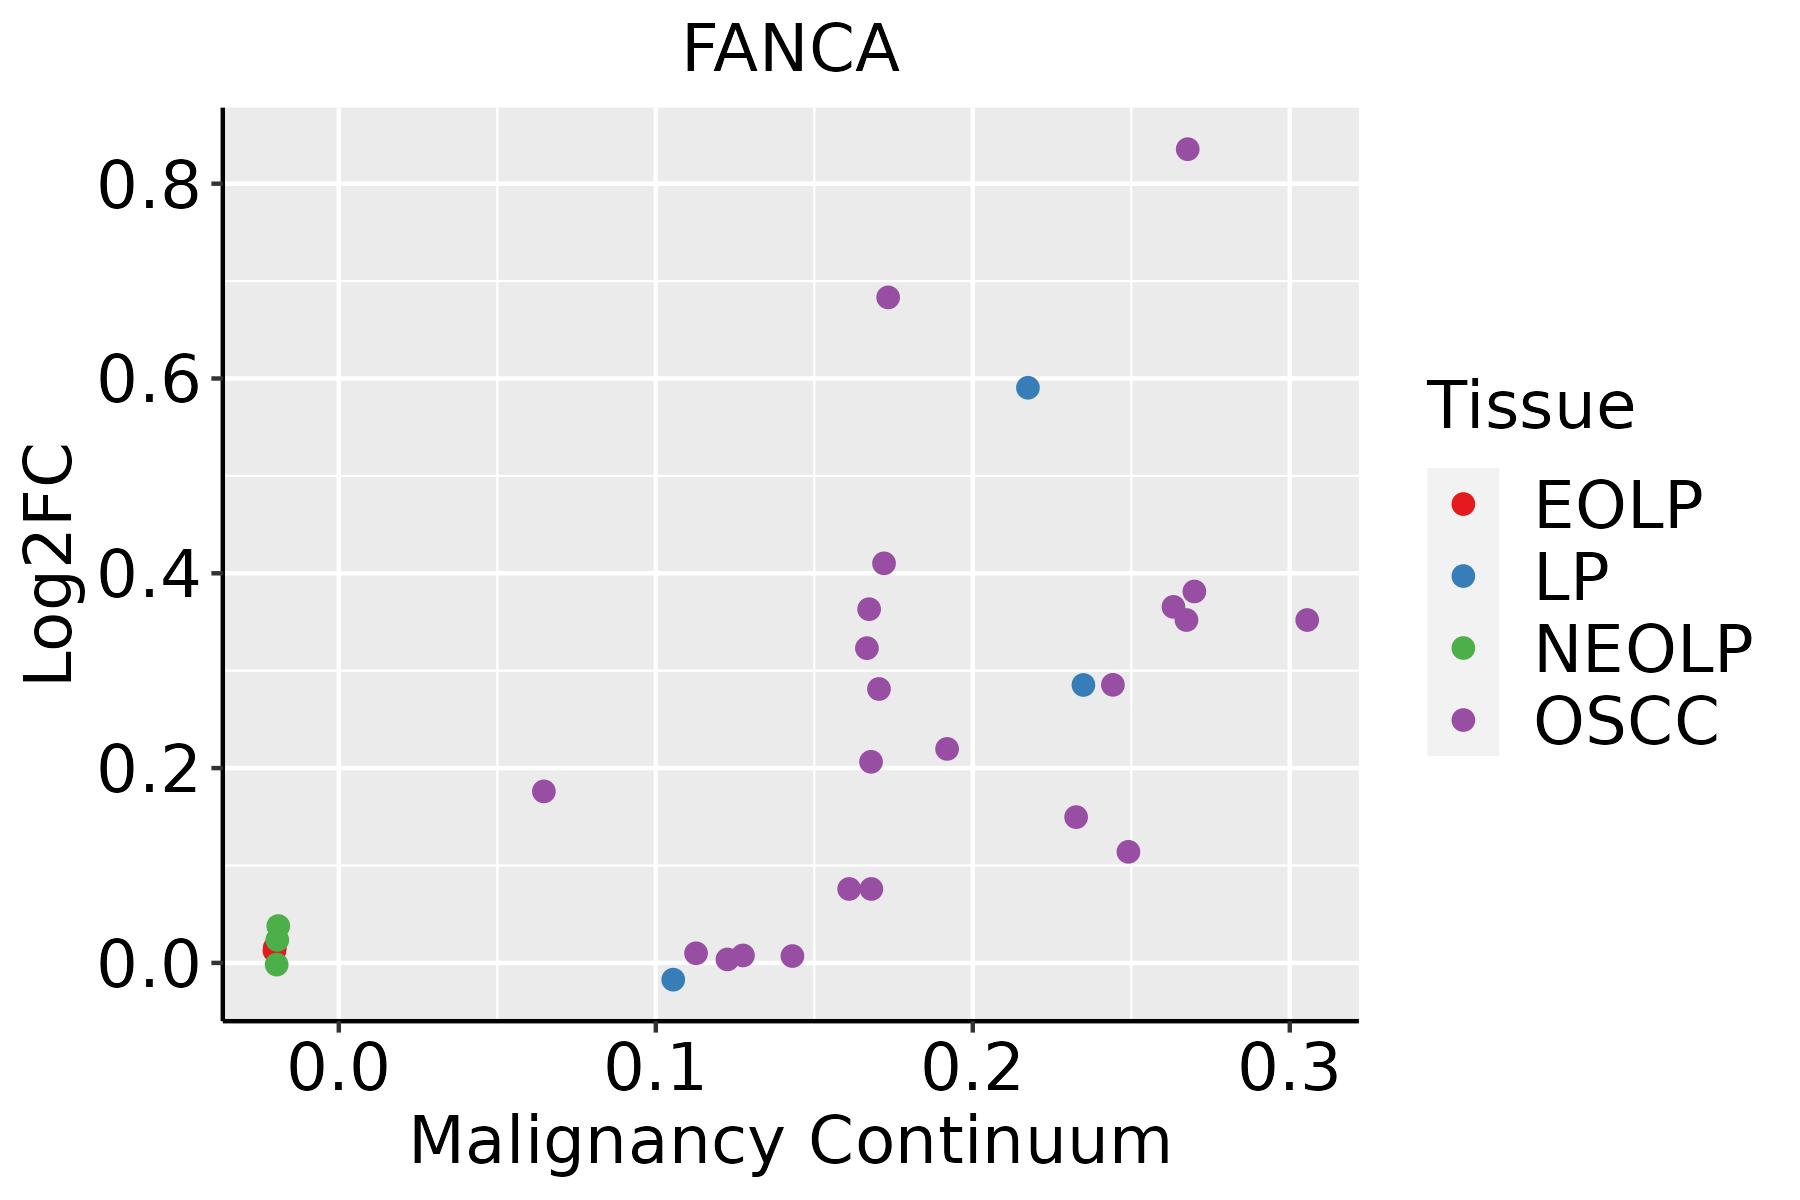
EOLP: Erosive Oral lichen planus
LP: leukoplakia
NEOLP: Non-erosive oral lichen planus
OSCC: Oral squamous cell carcinoma
ThyroidThe image shows the transcriptomic changes along malignancy continuum.log2FC in expression of this searched gene in stem-like cells from each diseased tissue sample relative to stem-like cells in normal samples in each tissue plotted against the malignancy continuum. Samples are colored based on if they are from different disease stage.ATC: Anaplastic thyroid cancer
HT: Hashimoto's thyroiditis
PTC: Papillary thyroid cancer
∗log2FC in expression of this searched gene in stem-like cells from each diseased tissue sample relative to stem-like cells in normal samples in each tissue plotted against the malignancy continuum. Samples are colored based on if they are from different disease stage.

Top

Malignant transformation related pathway analysis

check buttonFind out the enriched GO biological processes and KEGG pathways involved in transition from healthy to precancer to cancer
check button Figure of enriched GO biological processes.
TissueDisease StageEnriched GO biological Processes
ColorectumADGO analysis - Figure of enriched GO biological processes: Top 15 enriched GO BP terms are showed in the bar plot of each disease state in each tissue. Each row represents a significant GO biological process which is colored according to the -log10(p.adjust).
ColorectumSERGO analysis - Figure of enriched GO biological processes: Top 15 enriched GO BP terms are showed in the bar plot of each disease state in each tissue. Each row represents a significant GO biological process which is colored according to the -log10(p.adjust).
ColorectumMSSGO analysis - Figure of enriched GO biological processes: Top 15 enriched GO BP terms are showed in the bar plot of each disease state in each tissue. Each row represents a significant GO biological process which is colored according to the -log10(p.adjust).
ColorectumMSI-HGO analysis - Figure of enriched GO biological processes: Top 15 enriched GO BP terms are showed in the bar plot of each disease state in each tissue. Each row represents a significant GO biological process which is colored according to the -log10(p.adjust).
ColorectumFAPGO analysis - Figure of enriched GO biological processes: Top 15 enriched GO BP terms are showed in the bar plot of each disease state in each tissue. Each row represents a significant GO biological process which is colored according to the -log10(p.adjust).
∗Top 15 enriched GO BP terms are showed in the bar plot of each disease state in each tissue. Each row represents a significant GO biological process which is colored according to the -log10(p.adjust).
Page: 1 2 3 4 5 6 7 8 9 

check button Enriched GO biological processes.
GO IDTissueDisease StageDescriptionGene RatioBg Ratiopvaluep.adjustCount
GO:190210512CervixHSIL_HPVregulation of leukocyte differentiation28/737279/187235.84e-062.13e-0428
GO:005109012CervixHSIL_HPVregulation of DNA-binding transcription factor activity35/737440/187236.77e-051.58e-0335
GO:004860813CervixHSIL_HPVreproductive structure development32/737424/187233.52e-045.54e-0332
GO:006145814CervixHSIL_HPVreproductive system development32/737427/187233.98e-046.14e-0332
GO:00455891CervixHSIL_HPVregulation of regulatory T cell differentiation6/73728/187236.53e-048.92e-036
GO:00450661CervixHSIL_HPVregulatory T cell differentiation6/73731/187231.16e-031.38e-026
GO:00302171CervixHSIL_HPVT cell differentiation20/737257/187233.01e-032.78e-0220
GO:190313112CervixHSIL_HPVmononuclear cell differentiation29/737426/187233.10e-032.84e-0229
GO:00455801CervixHSIL_HPVregulation of T cell differentiation13/737146/187235.11e-034.14e-0213
GO:19037062ColorectumMSI-Hregulation of hemopoiesis41/1319367/187232.31e-033.09e-0241
GO:00614583ColorectumFAPreproductive system development85/2622427/187234.30e-045.13e-0385
GO:00486083ColorectumFAPreproductive structure development84/2622424/187235.40e-046.10e-0384
GO:1903131ColorectumFAPmononuclear cell differentiation79/2622426/187235.00e-033.33e-0279
GO:19037063ColorectumFAPregulation of hemopoiesis69/2622367/187236.01e-033.78e-0269
GO:00510901ColorectumFAPregulation of DNA-binding transcription factor activity80/2622440/187237.90e-034.67e-0280
GO:006145815EndometriumEECreproductive system development91/2168427/187234.54e-093.13e-0791
GO:004860814EndometriumEECreproductive structure development90/2168424/187236.77e-094.41e-0790
GO:004211014EndometriumEECT cell activation85/2168487/187236.81e-051.01e-0385
GO:190370615EndometriumEECregulation of hemopoiesis67/2168367/187231.01e-041.40e-0367
GO:005086313EndometriumEECregulation of T cell activation60/2168329/187232.33e-042.75e-0360
Page: 1 2 3 4 5 

check button Enriched KEGG pathways.
Pathway IDTissueDisease StageDescriptionGene RatioBg Ratiopvaluep.adjustqvalueCount
Page: 1 

Top

Cell-cell communication analysis

check buttonIdentification of potential cell-cell interactions between two cell types and their ligand-receptor pairs for different disease states
LigandReceptorLRpairPathwayTissueDisease Stage
Page: 1 

Top

Single-cell gene regulatory network inference analysis

check buttonFind out the significant the regulons (TFs) and the target genes of each regulon across cell types for different disease states
TFCell TypeTissueDisease StageTarget GeneRSSRegulon Activity
∗The dot plots of a searched regulon are shown for all cell subpopulations in each disease state of each tissue based on the regulon specific score inferred using pySCENIC and by calculating the average expression.
Page: 1 

Top

Somatic mutation of malignant transformation related genes

check buttonAnnotation of somatic variants for genes involved in malignant transformation
Hugo SymbolVariant ClassVariant ClassificationdbSNP RSHGVScHGVSpHGVSp ShortSWISSPROTBIOTYPESIFTPolyPhenTumor Sample BarcodeTissueHistologySexAgeStageTherapy TypesDrugsOutcome
FANCASNVMissense_Mutationc.502C>Gp.Gln168Glup.Q168EO15360protein_codingdeleterious(0.03)benign(0.006)TCGA-A8-A09I-01Breastbreast invasive carcinomaFemale>=65I/IIHormone TherapyanastrozoleSD
FANCASNVMissense_Mutationc.2791N>Cp.Asp931Hisp.D931HO15360protein_codingdeleterious(0)probably_damaging(0.963)TCGA-AC-A23H-01Breastbreast invasive carcinomaFemale>=65I/IIUnknownUnknownPD
FANCASNVMissense_Mutationc.112N>Ap.Glu38Lysp.E38KO15360protein_codingtolerated(0.15)benign(0.272)TCGA-AC-A23H-01Breastbreast invasive carcinomaFemale>=65I/IIUnknownUnknownPD
FANCASNVMissense_Mutationrs376103033c.3157N>Tp.Arg1053Cysp.R1053CO15360protein_codingtolerated(0.23)benign(0.015)TCGA-AN-A04A-01Breastbreast invasive carcinomaFemale<65III/IVUnknownUnknownSD
FANCASNVMissense_Mutationrs764206631c.3250N>Tp.Arg1084Cysp.R1084CO15360protein_codingtolerated(0.07)benign(0.003)TCGA-AR-A0TR-01Breastbreast invasive carcinomaFemale>=65I/IIHormone TherapytamoxiphenSD
FANCASNVMissense_Mutationc.3043G>Ap.Glu1015Lysp.E1015KO15360protein_codingtolerated(0.74)benign(0.003)TCGA-BH-A1EO-01Breastbreast invasive carcinomaFemale>=65I/IIUnknownUnknownSD
FANCASNVMissense_Mutationc.2080N>Tp.Asp694Tyrp.D694YO15360protein_codingtolerated(0.06)possibly_damaging(0.819)TCGA-C8-A26Y-01Breastbreast invasive carcinomaFemale>=65I/IIUnknownUnknownSD
FANCASNVMissense_Mutationc.155N>Tp.Arg52Leup.R52LO15360protein_codingtolerated(0.06)possibly_damaging(0.468)TCGA-D8-A1J9-01Breastbreast invasive carcinomaFemale<65I/IIUnknownUnknownSD
FANCAinsertionNonsense_Mutationnovelc.3409_3410insTCTTCCATGAGTGTGGGTAATAAATp.Gly1137ValfsTer7p.G1137Vfs*7O15360protein_codingTCGA-A2-A04Y-01Breastbreast invasive carcinomaFemale<65I/IIChemotherapycytoxanSD
FANCAinsertionNonsense_Mutationnovelc.3130_3131insTGAGAGTCTGAGCCCTTGGGAp.Gln1044delinsLeuArgValTerAlaLeuGlyLysp.Q1044delinsLRV*ALGKO15360protein_codingTCGA-A2-A0CM-01Breastbreast invasive carcinomaFemale<65I/IIChemotherapyadriamycinPD
Page: 1 2 3 4 5 6 7 8 9 10 11 12 13 

Top

Related drugs of malignant transformation related genes

check buttonIdentification of chemicals and drugs interact with genes involved in malignant transfromation
(DGIdb 4.0)
Entrez IDSymbolCategoryInteraction TypesDrug Claim NameDrug NamePMIDs
2175FANCACLINICALLY ACTIONABLE, DNA REPAIRCISPLATINCISPLATIN26181256
Page: 1