
|
|||||
|
 | |
| |
| |
| |
| |
| |
|
Gene: FAF2 |
Gene summary for FAF2 |
| Gene information | Species | Human | Gene symbol | FAF2 | Gene ID | 23197 |
| Gene name | Fas associated factor family member 2 | |
| Gene Alias | ETEA | |
| Cytomap | 5q35.2 | |
| Gene Type | protein-coding | GO ID | GO:0006508 | UniProtAcc | Q96CS3 |
Top |
Malignant transformation analysis |
| Identification of the aberrant gene expression in precancerous and cancerous lesions by comparing the gene expression of stem-like cells in diseased tissues with normal stem cells |
| Entrez ID | Symbol | Replicates | Species | Organ | Tissue | Adj P-value | Log2FC | Malignancy |
| 23197 | FAF2 | LZE4T | Human | Esophagus | ESCC | 1.26e-15 | 3.42e-01 | 0.0811 |
| 23197 | FAF2 | LZE7T | Human | Esophagus | ESCC | 1.99e-03 | 1.40e-01 | 0.0667 |
| 23197 | FAF2 | LZE8T | Human | Esophagus | ESCC | 1.25e-03 | 1.81e-01 | 0.067 |
| 23197 | FAF2 | LZE20T | Human | Esophagus | ESCC | 8.34e-05 | 1.98e-01 | 0.0662 |
| 23197 | FAF2 | LZE24T | Human | Esophagus | ESCC | 1.91e-11 | 1.92e-01 | 0.0596 |
| 23197 | FAF2 | P2T-E | Human | Esophagus | ESCC | 8.48e-56 | 8.34e-01 | 0.1177 |
| 23197 | FAF2 | P4T-E | Human | Esophagus | ESCC | 1.02e-14 | 2.90e-01 | 0.1323 |
| 23197 | FAF2 | P5T-E | Human | Esophagus | ESCC | 6.04e-26 | 5.15e-01 | 0.1327 |
| 23197 | FAF2 | P8T-E | Human | Esophagus | ESCC | 8.22e-17 | 3.24e-01 | 0.0889 |
| 23197 | FAF2 | P9T-E | Human | Esophagus | ESCC | 5.76e-18 | 2.11e-01 | 0.1131 |
| 23197 | FAF2 | P10T-E | Human | Esophagus | ESCC | 3.77e-21 | 4.05e-01 | 0.116 |
| 23197 | FAF2 | P11T-E | Human | Esophagus | ESCC | 8.53e-16 | 6.84e-01 | 0.1426 |
| 23197 | FAF2 | P12T-E | Human | Esophagus | ESCC | 2.77e-21 | 5.52e-01 | 0.1122 |
| 23197 | FAF2 | P15T-E | Human | Esophagus | ESCC | 3.93e-23 | 5.14e-01 | 0.1149 |
| 23197 | FAF2 | P16T-E | Human | Esophagus | ESCC | 1.10e-25 | 4.85e-01 | 0.1153 |
| 23197 | FAF2 | P17T-E | Human | Esophagus | ESCC | 5.55e-09 | 3.69e-01 | 0.1278 |
| 23197 | FAF2 | P19T-E | Human | Esophagus | ESCC | 6.70e-04 | 3.90e-01 | 0.1662 |
| 23197 | FAF2 | P20T-E | Human | Esophagus | ESCC | 1.52e-11 | 2.74e-01 | 0.1124 |
| 23197 | FAF2 | P21T-E | Human | Esophagus | ESCC | 1.93e-32 | 6.39e-01 | 0.1617 |
| 23197 | FAF2 | P22T-E | Human | Esophagus | ESCC | 5.97e-37 | 6.95e-01 | 0.1236 |
| Page: 1 2 3 4 5 6 |
| Tissue | Expression Dynamics | Abbreviation |
| Esophagus | 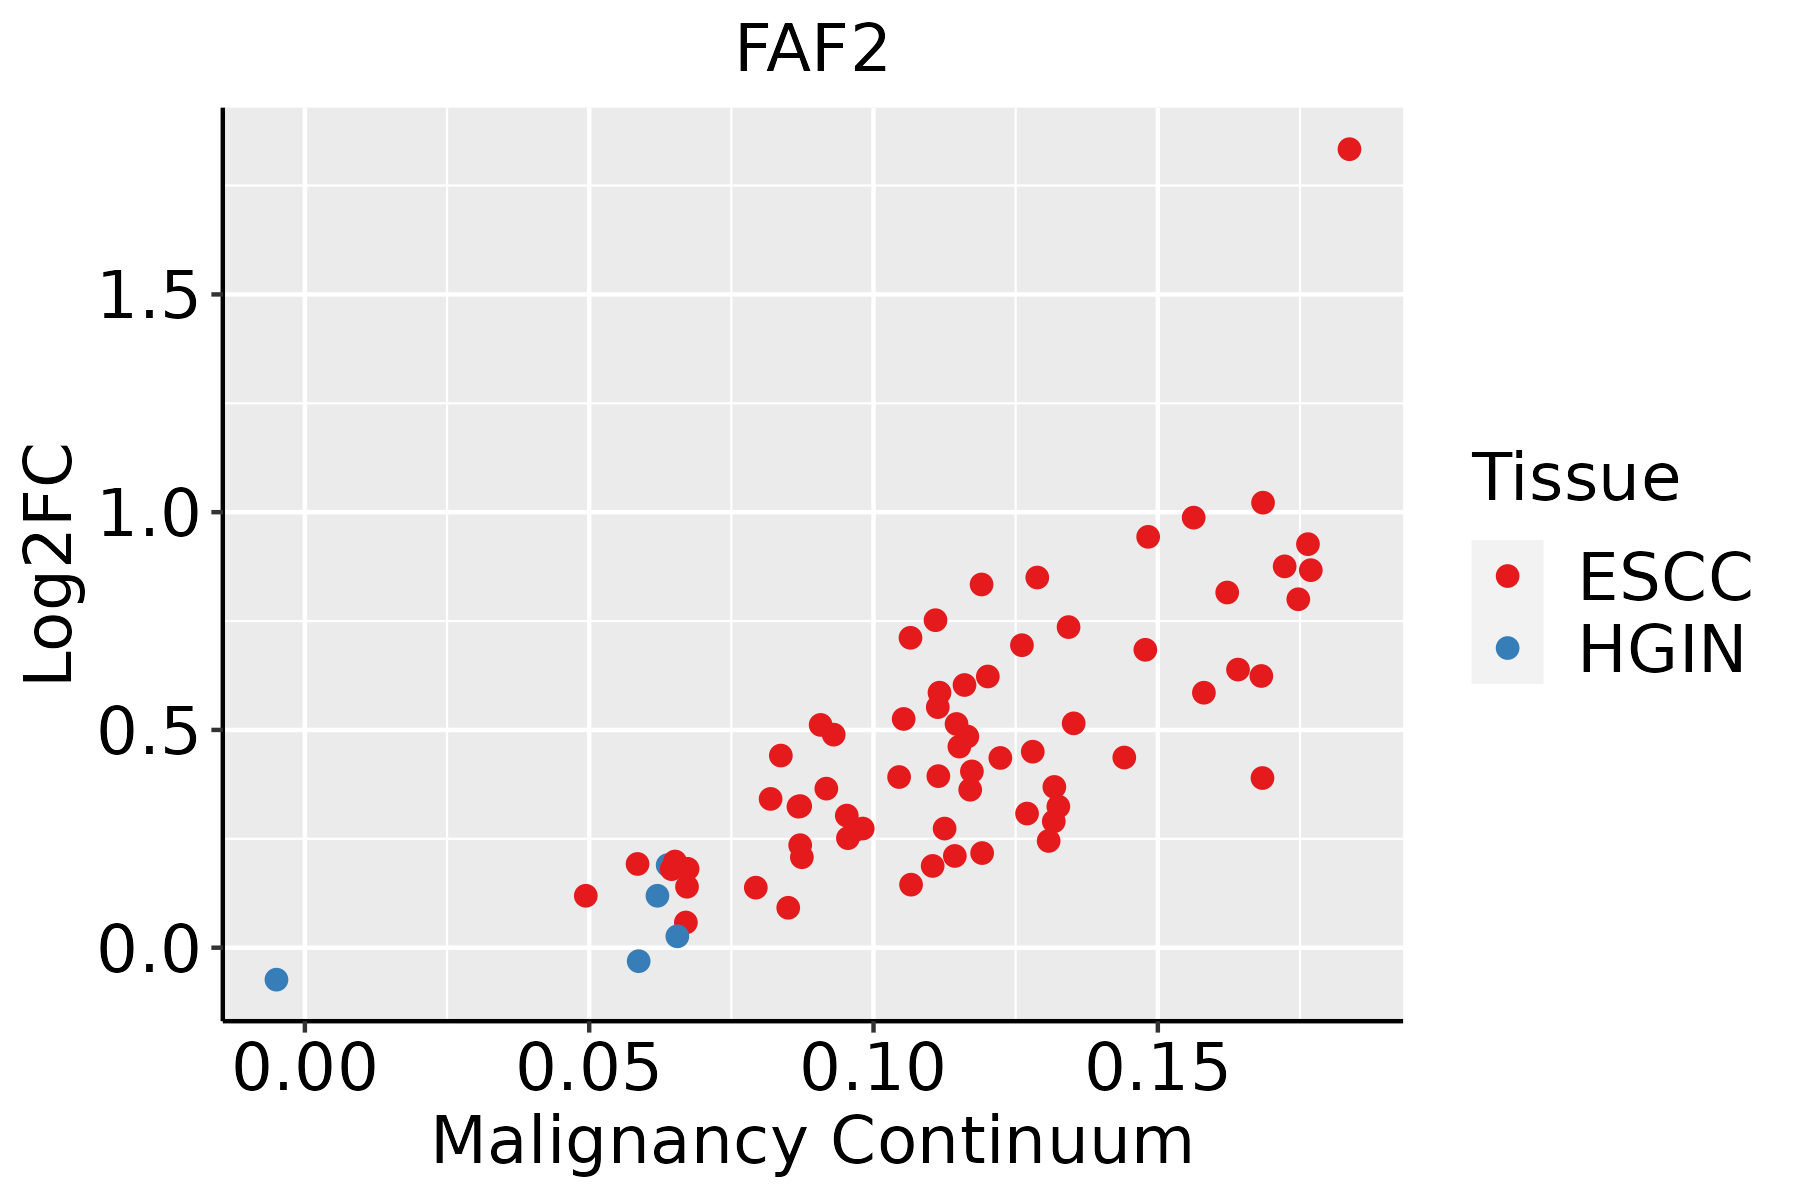 | ESCC: Esophageal squamous cell carcinoma |
| HGIN: High-grade intraepithelial neoplasias | ||
| LGIN: Low-grade intraepithelial neoplasias | ||
| Liver | 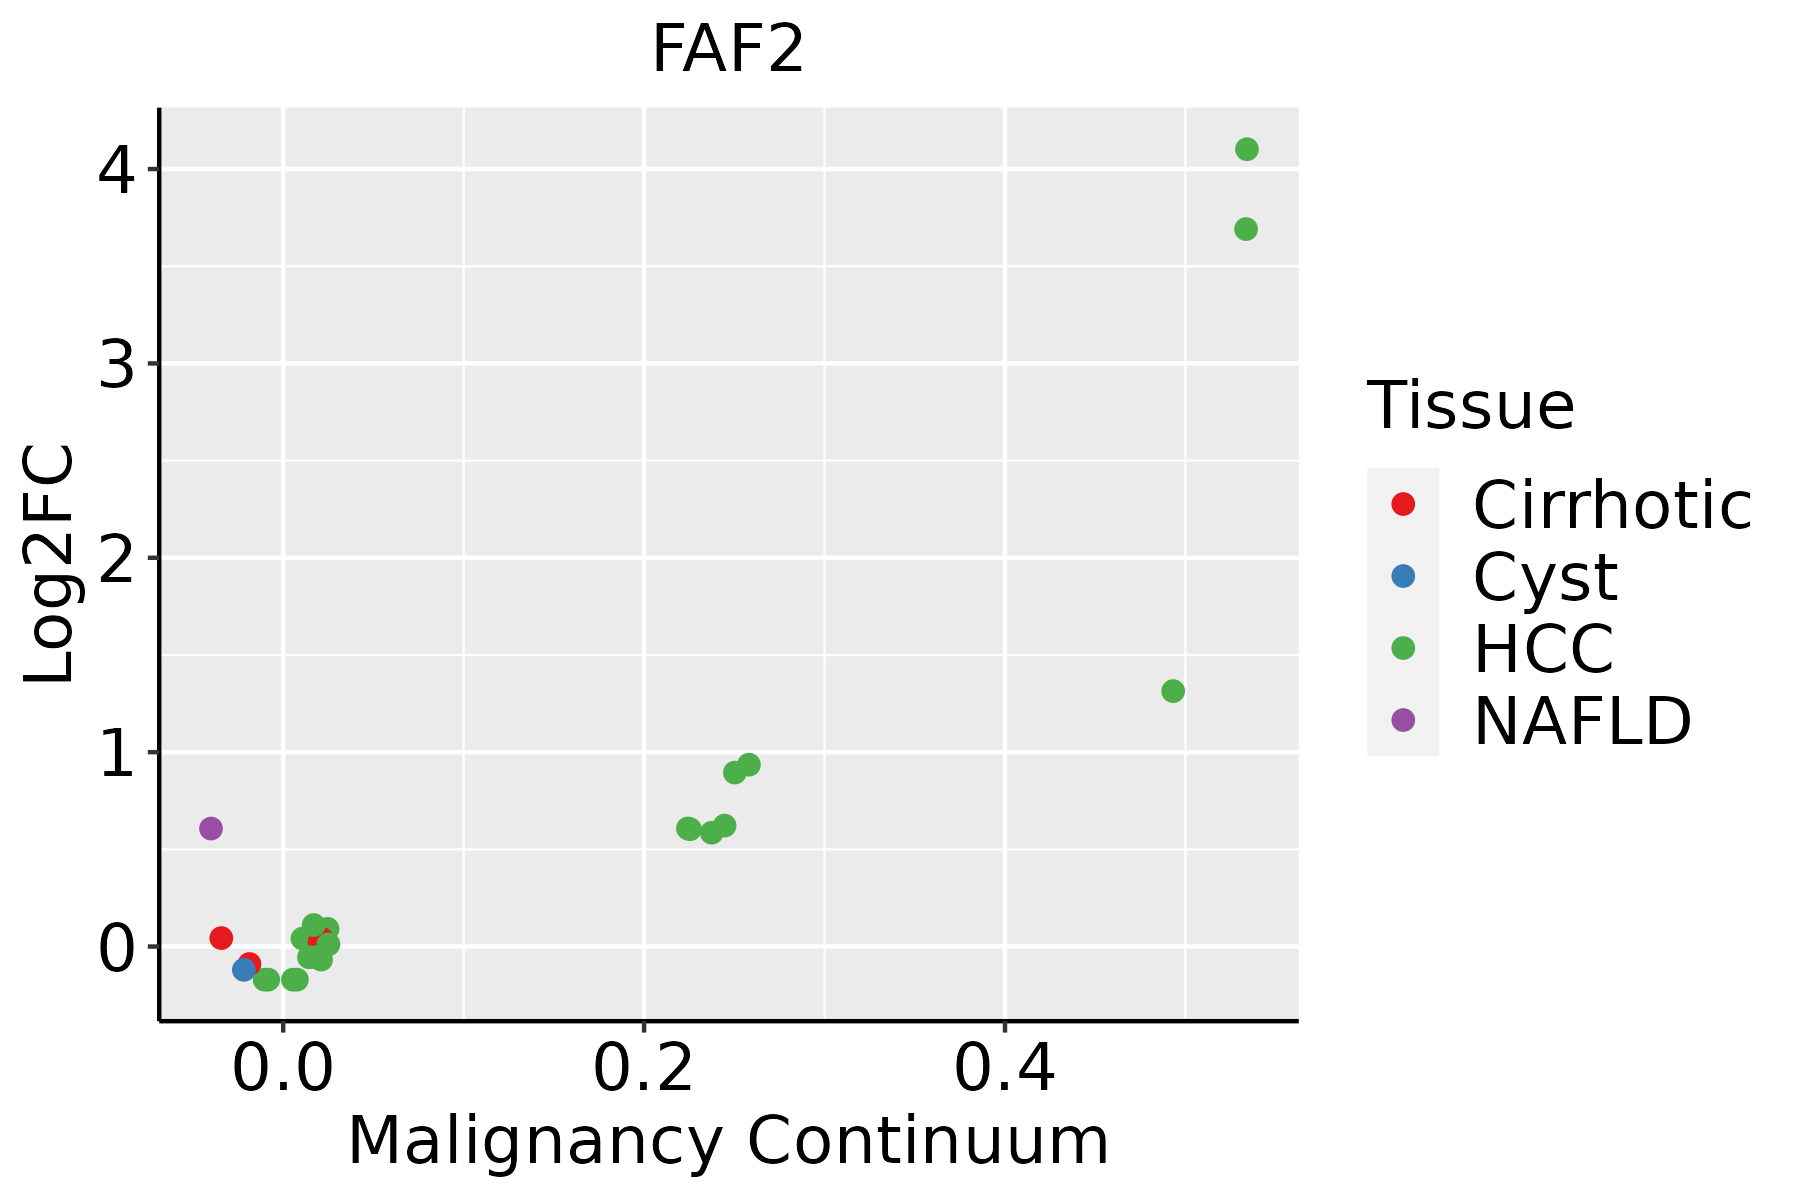 | HCC: Hepatocellular carcinoma |
| NAFLD: Non-alcoholic fatty liver disease | ||
| Oral Cavity |  | EOLP: Erosive Oral lichen planus |
| LP: leukoplakia | ||
| NEOLP: Non-erosive oral lichen planus | ||
| OSCC: Oral squamous cell carcinoma | ||
| Skin | 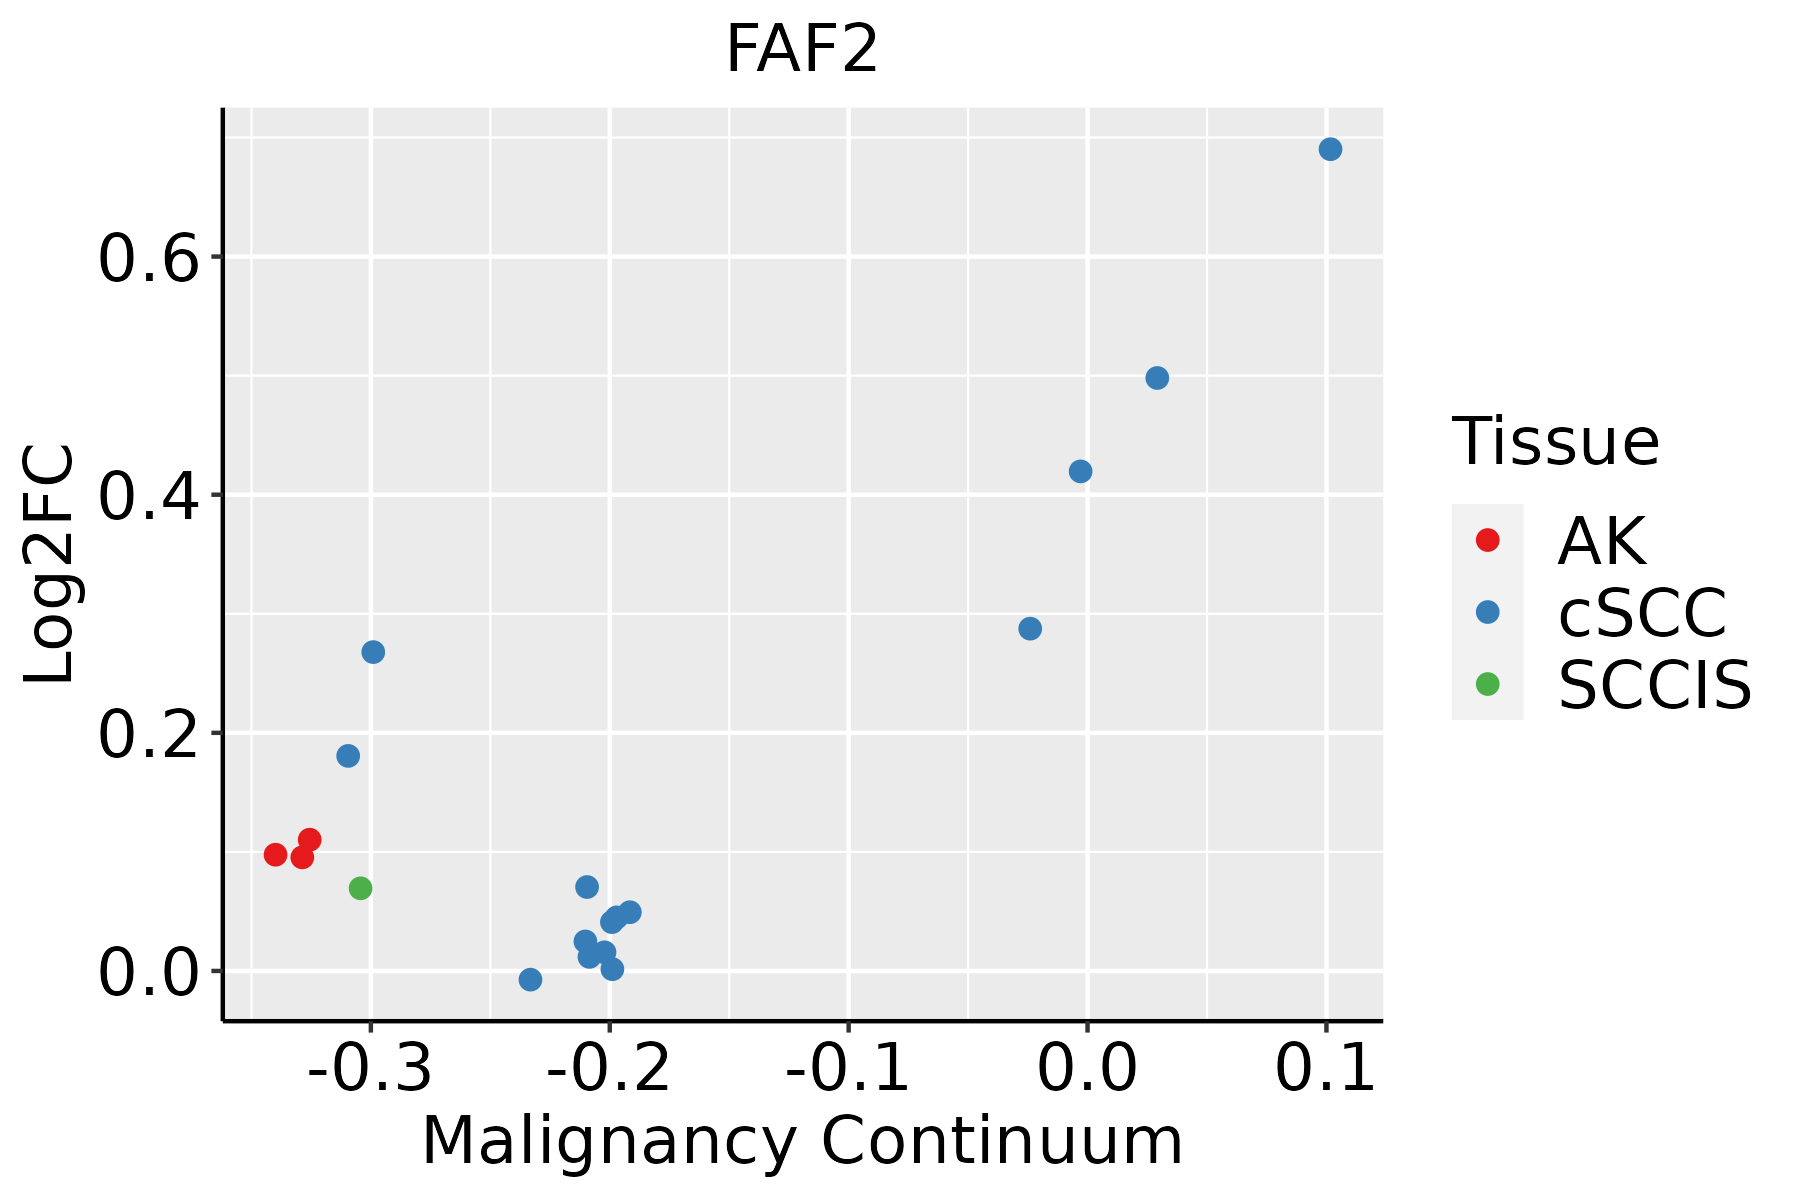 | AK: Actinic keratosis |
| cSCC: Cutaneous squamous cell carcinoma | ||
| SCCIS:squamous cell carcinoma in situ | ||
| Thyroid |  | ATC: Anaplastic thyroid cancer |
| HT: Hashimoto's thyroiditis | ||
| PTC: Papillary thyroid cancer |
| ∗log2FC in expression of this searched gene in stem-like cells from each diseased tissue sample relative to stem-like cells in normal samples in each tissue plotted against the malignancy continuum. Samples are colored based on if they are from different disease stage. |
Top |
Malignant transformation related pathway analysis |
| Find out the enriched GO biological processes and KEGG pathways involved in transition from healthy to precancer to cancer |
| Tissue | Disease Stage | Enriched GO biological Processes |
| Colorectum | AD |  |
| Colorectum | SER |  |
| Colorectum | MSS |  |
| Colorectum | MSI-H |  |
| Colorectum | FAP |  |
| ∗Top 15 enriched GO BP terms are showed in the bar plot of each disease state in each tissue. Each row represents a significant GO biological process which is colored according to the -log10(p.adjust). |
| Page: 1 2 3 4 5 6 7 8 9 |
| GO ID | Tissue | Disease Stage | Description | Gene Ratio | Bg Ratio | pvalue | p.adjust | Count |
| GO:0061178 | Colorectum | AD | regulation of insulin secretion involved in cellular response to glucose stimulus | 25/3918 | 64/18723 | 6.98e-04 | 7.10e-03 | 25 |
| GO:0015833 | Colorectum | AD | peptide transport | 77/3918 | 264/18723 | 8.90e-04 | 8.60e-03 | 77 |
| GO:0035773 | Colorectum | AD | insulin secretion involved in cellular response to glucose stimulus | 27/3918 | 73/18723 | 1.17e-03 | 1.05e-02 | 27 |
| GO:0090087 | Colorectum | AD | regulation of peptide transport | 60/3918 | 202/18723 | 1.94e-03 | 1.58e-02 | 60 |
| GO:0030072 | Colorectum | AD | peptide hormone secretion | 68/3918 | 236/18723 | 2.39e-03 | 1.85e-02 | 68 |
| GO:0002791 | Colorectum | AD | regulation of peptide secretion | 59/3918 | 200/18723 | 2.50e-03 | 1.92e-02 | 59 |
| GO:0090276 | Colorectum | AD | regulation of peptide hormone secretion | 58/3918 | 196/18723 | 2.51e-03 | 1.92e-02 | 58 |
| GO:0002790 | Colorectum | AD | peptide secretion | 69/3918 | 242/18723 | 2.97e-03 | 2.22e-02 | 69 |
| GO:0042886 | Colorectum | AD | amide transport | 83/3918 | 301/18723 | 3.37e-03 | 2.46e-02 | 83 |
| GO:0002792 | Colorectum | AD | negative regulation of peptide secretion | 17/3918 | 44/18723 | 5.46e-03 | 3.56e-02 | 17 |
| GO:0046676 | Colorectum | AD | negative regulation of insulin secretion | 15/3918 | 38/18723 | 7.01e-03 | 4.31e-02 | 15 |
| GO:0061179 | Colorectum | AD | negative regulation of insulin secretion involved in cellular response to glucose stimulus | 6/3918 | 10/18723 | 8.03e-03 | 4.73e-02 | 6 |
| GO:00102571 | Colorectum | SER | NADH dehydrogenase complex assembly | 30/2897 | 57/18723 | 7.92e-11 | 1.19e-08 | 30 |
| GO:00329811 | Colorectum | SER | mitochondrial respiratory chain complex I assembly | 30/2897 | 57/18723 | 7.92e-11 | 1.19e-08 | 30 |
| GO:00331081 | Colorectum | SER | mitochondrial respiratory chain complex assembly | 39/2897 | 93/18723 | 8.13e-10 | 8.74e-08 | 39 |
| GO:00342841 | Colorectum | SER | response to monosaccharide | 56/2897 | 225/18723 | 1.52e-04 | 2.98e-03 | 56 |
| GO:00507081 | Colorectum | SER | regulation of protein secretion | 63/2897 | 268/18723 | 3.42e-04 | 5.39e-03 | 63 |
| GO:00097431 | Colorectum | SER | response to carbohydrate | 60/2897 | 253/18723 | 3.66e-04 | 5.67e-03 | 60 |
| GO:00097491 | Colorectum | SER | response to glucose | 52/2897 | 212/18723 | 3.75e-04 | 5.74e-03 | 52 |
| GO:00097461 | Colorectum | SER | response to hexose | 53/2897 | 219/18723 | 4.69e-04 | 6.76e-03 | 53 |
| Page: 1 2 3 4 5 6 7 8 9 10 11 12 13 14 15 16 17 |
| Pathway ID | Tissue | Disease Stage | Description | Gene Ratio | Bg Ratio | pvalue | p.adjust | qvalue | Count |
| Page: 1 |
Top |
Cell-cell communication analysis |
| Identification of potential cell-cell interactions between two cell types and their ligand-receptor pairs for different disease states |
| Ligand | Receptor | LRpair | Pathway | Tissue | Disease Stage |
| Page: 1 |
Top |
Single-cell gene regulatory network inference analysis |
| Find out the significant the regulons (TFs) and the target genes of each regulon across cell types for different disease states |
| TF | Cell Type | Tissue | Disease Stage | Target Gene | RSS | Regulon Activity |
| ∗The dot plots of a searched regulon are shown for all cell subpopulations in each disease state of each tissue based on the regulon specific score inferred using pySCENIC and by calculating the average expression. |
| Page: 1 |
Top |
Somatic mutation of malignant transformation related genes |
| Annotation of somatic variants for genes involved in malignant transformation |
| Hugo Symbol | Variant Class | Variant Classification | dbSNP RS | HGVSc | HGVSp | HGVSp Short | SWISSPROT | BIOTYPE | SIFT | PolyPhen | Tumor Sample Barcode | Tissue | Histology | Sex | Age | Stage | Therapy Types | Drugs | Outcome |
| FAF2 | SNV | Missense_Mutation | c.55N>A | p.Gln19Lys | p.Q19K | Q96CS3 | protein_coding | deleterious(0.02) | benign(0.21) | TCGA-A1-A0SJ-01 | Breast | breast invasive carcinoma | Female | <65 | III/IV | Unknown | Unknown | SD | |
| FAF2 | SNV | Missense_Mutation | c.344G>T | p.Arg115Met | p.R115M | Q96CS3 | protein_coding | tolerated(0.08) | benign(0.031) | TCGA-BH-A18G-01 | Breast | breast invasive carcinoma | Female | >=65 | I/II | Unknown | Unknown | SD | |
| FAF2 | SNV | Missense_Mutation | novel | c.995N>G | p.Glu332Gly | p.E332G | Q96CS3 | protein_coding | tolerated(0.11) | benign(0.159) | TCGA-S3-AA17-01 | Breast | breast invasive carcinoma | Female | <65 | I/II | Hormone Therapy | anastrozole | SD |
| FAF2 | SNV | Missense_Mutation | c.130N>C | p.Glu44Gln | p.E44Q | Q96CS3 | protein_coding | deleterious(0) | probably_damaging(1) | TCGA-C5-A1MH-01 | Cervix | cervical & endocervical cancer | Female | >=65 | III/IV | Chemotherapy | cisplatin | PD | |
| FAF2 | SNV | Missense_Mutation | novel | c.1123N>C | p.Glu375Gln | p.E375Q | Q96CS3 | protein_coding | deleterious(0) | probably_damaging(0.914) | TCGA-MA-AA41-01 | Cervix | cervical & endocervical cancer | Female | <65 | I/II | Unknown | Unknown | SD |
| FAF2 | SNV | Missense_Mutation | novel | c.1082N>A | p.Ser361Asn | p.S361N | Q96CS3 | protein_coding | tolerated(0.13) | benign(0.025) | TCGA-A6-2672-01 | Colorectum | colon adenocarcinoma | Female | >=65 | III/IV | Unknown | Unknown | SD |
| FAF2 | SNV | Missense_Mutation | rs146584253 | c.512G>A | p.Arg171His | p.R171H | Q96CS3 | protein_coding | deleterious(0) | probably_damaging(0.98) | TCGA-AA-3864-01 | Colorectum | colon adenocarcinoma | Male | >=65 | I/II | Unknown | Unknown | SD |
| FAF2 | SNV | Missense_Mutation | novel | c.79N>A | p.Glu27Lys | p.E27K | Q96CS3 | protein_coding | deleterious(0.01) | possibly_damaging(0.663) | TCGA-CA-6717-01 | Colorectum | colon adenocarcinoma | Male | <65 | I/II | Chemotherapy | oxaliplatin | CR |
| FAF2 | SNV | Missense_Mutation | rs755730334 | c.955N>T | p.Arg319Trp | p.R319W | Q96CS3 | protein_coding | deleterious(0.01) | possibly_damaging(0.702) | TCGA-A5-A0G2-01 | Endometrium | uterine corpus endometrioid carcinoma | Female | <65 | III/IV | Unknown | Unknown | SD |
| FAF2 | SNV | Missense_Mutation | novel | c.583N>A | p.Ala195Thr | p.A195T | Q96CS3 | protein_coding | tolerated(0.44) | benign(0) | TCGA-AP-A059-01 | Endometrium | uterine corpus endometrioid carcinoma | Female | >=65 | I/II | Unknown | Unknown | SD |
| Page: 1 2 3 4 5 |
Top |
Related drugs of malignant transformation related genes |
| Identification of chemicals and drugs interact with genes involved in malignant transfromation |
| (DGIdb 4.0) |
| Entrez ID | Symbol | Category | Interaction Types | Drug Claim Name | Drug Name | PMIDs |
| Page: 1 |

Copyright 2023-Present -The University of Texas Health Science Center at Houston |