| Tissue | Expression Dynamics | Abbreviation |
| Cervix | 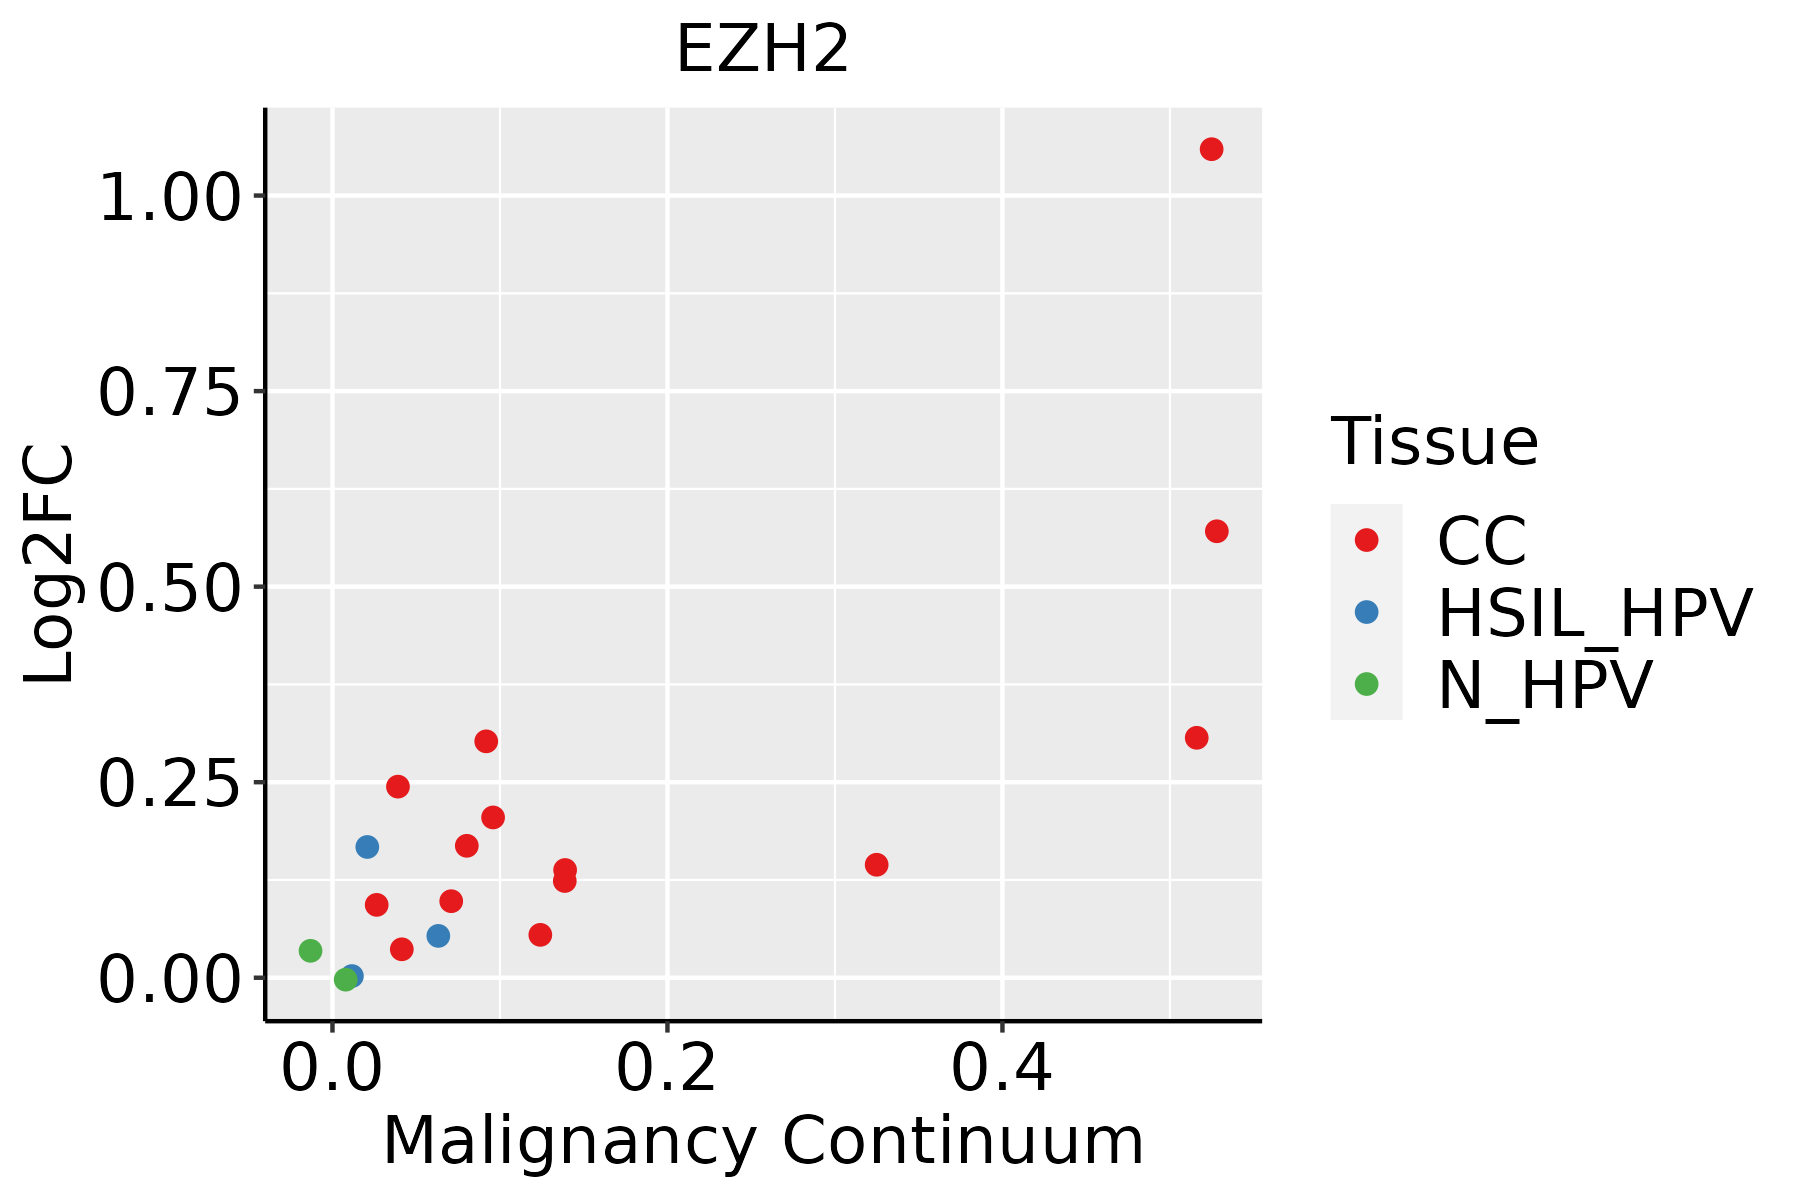 | CC: Cervix cancer |
| HSIL_HPV: HPV-infected high-grade squamous intraepithelial lesions |
| N_HPV: HPV-infected normal cervix |
| Endometrium | 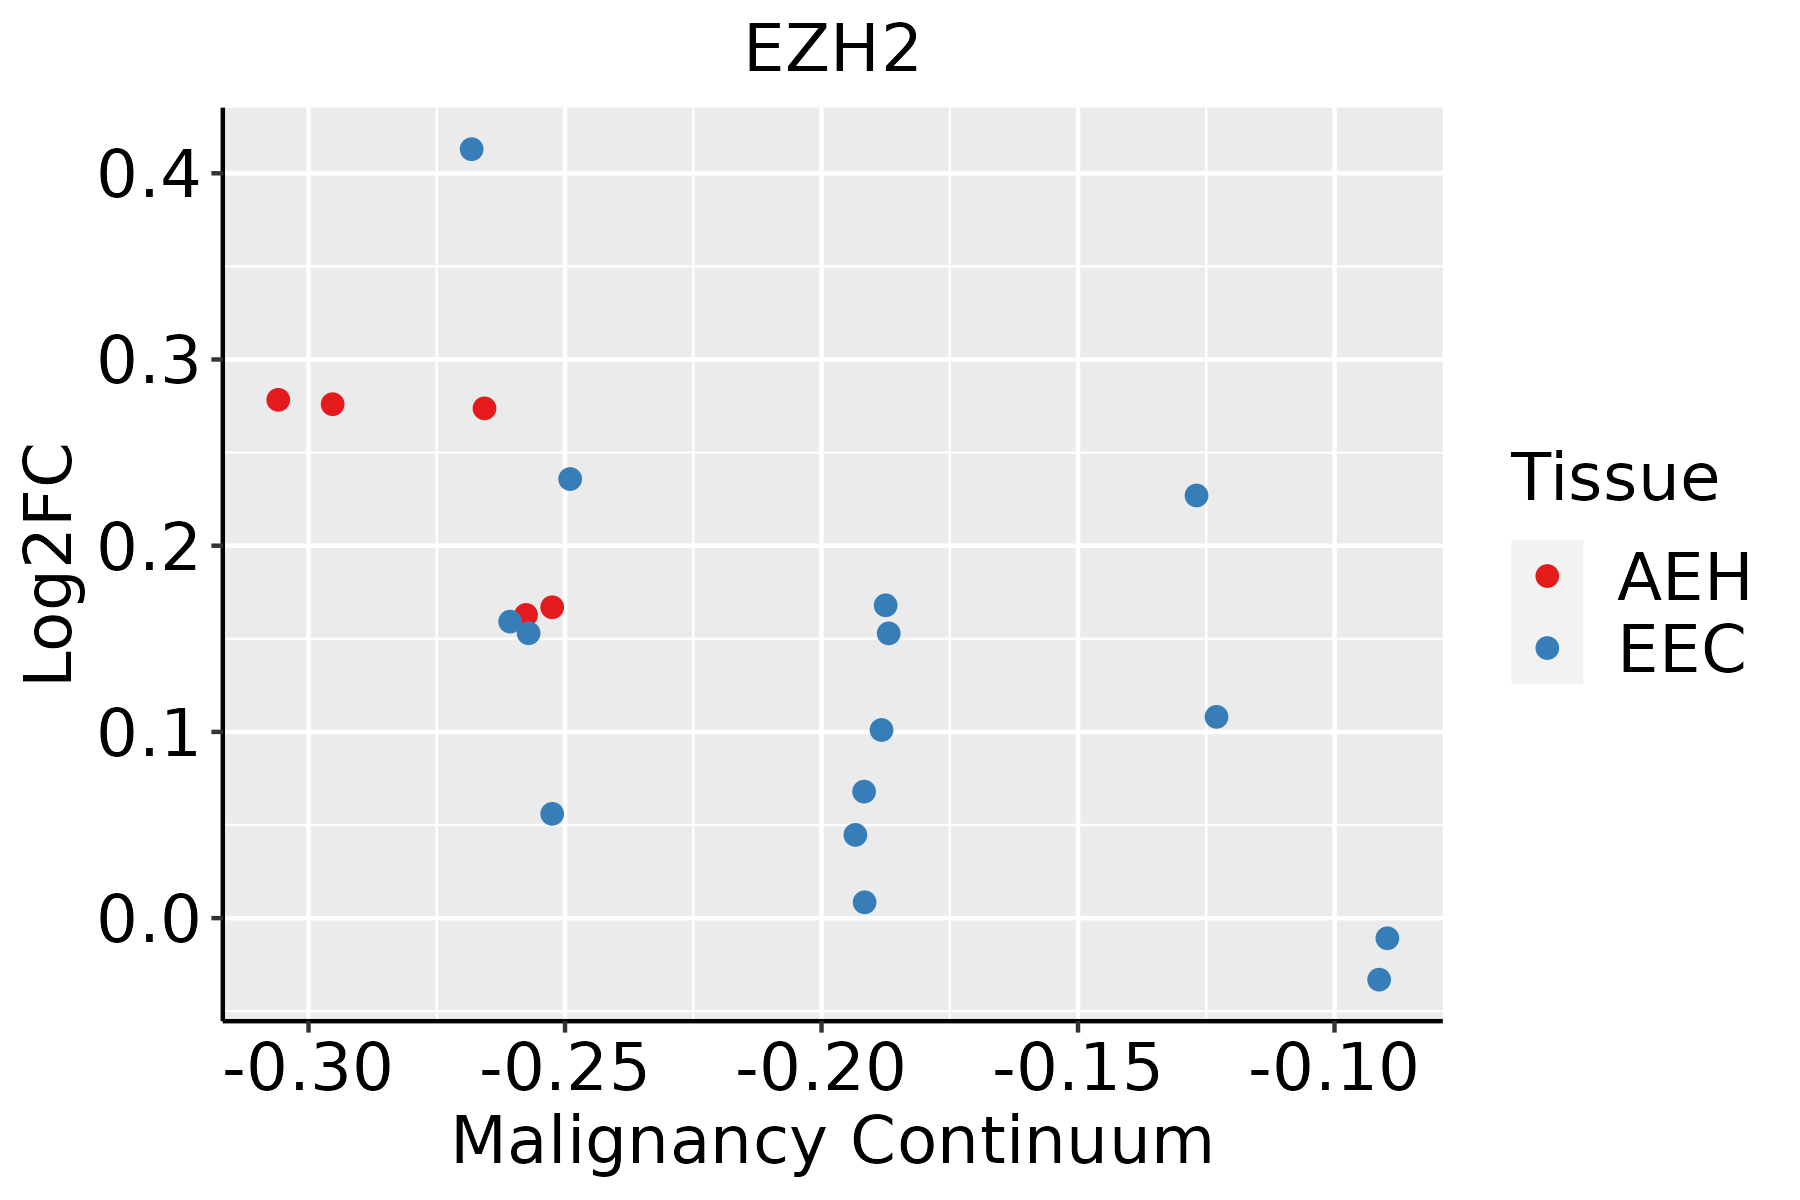 | AEH: Atypical endometrial hyperplasia |
| EEC: Endometrioid Cancer |
| Esophagus | 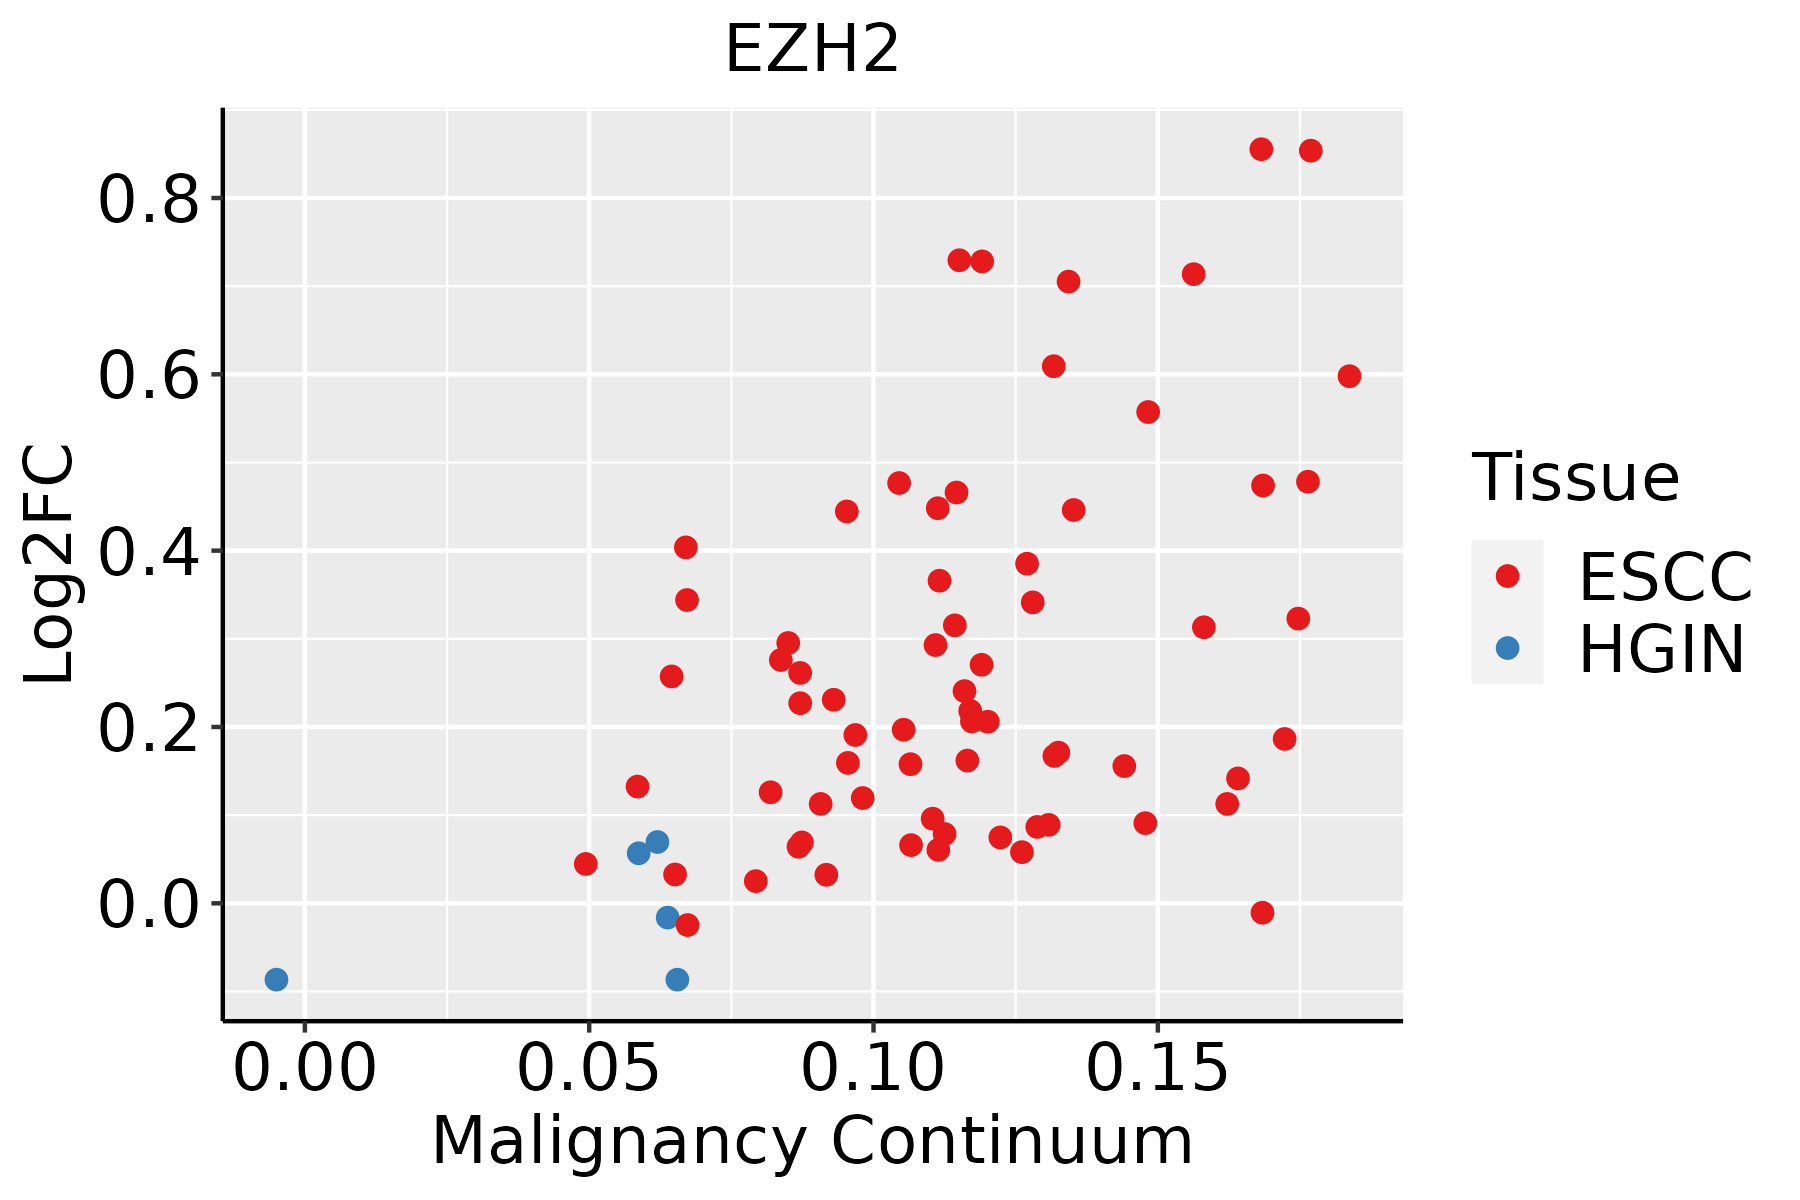 | ESCC: Esophageal squamous cell carcinoma |
| HGIN: High-grade intraepithelial neoplasias |
| LGIN: Low-grade intraepithelial neoplasias |
| Liver |  | HCC: Hepatocellular carcinoma |
| NAFLD: Non-alcoholic fatty liver disease |
| Lung | 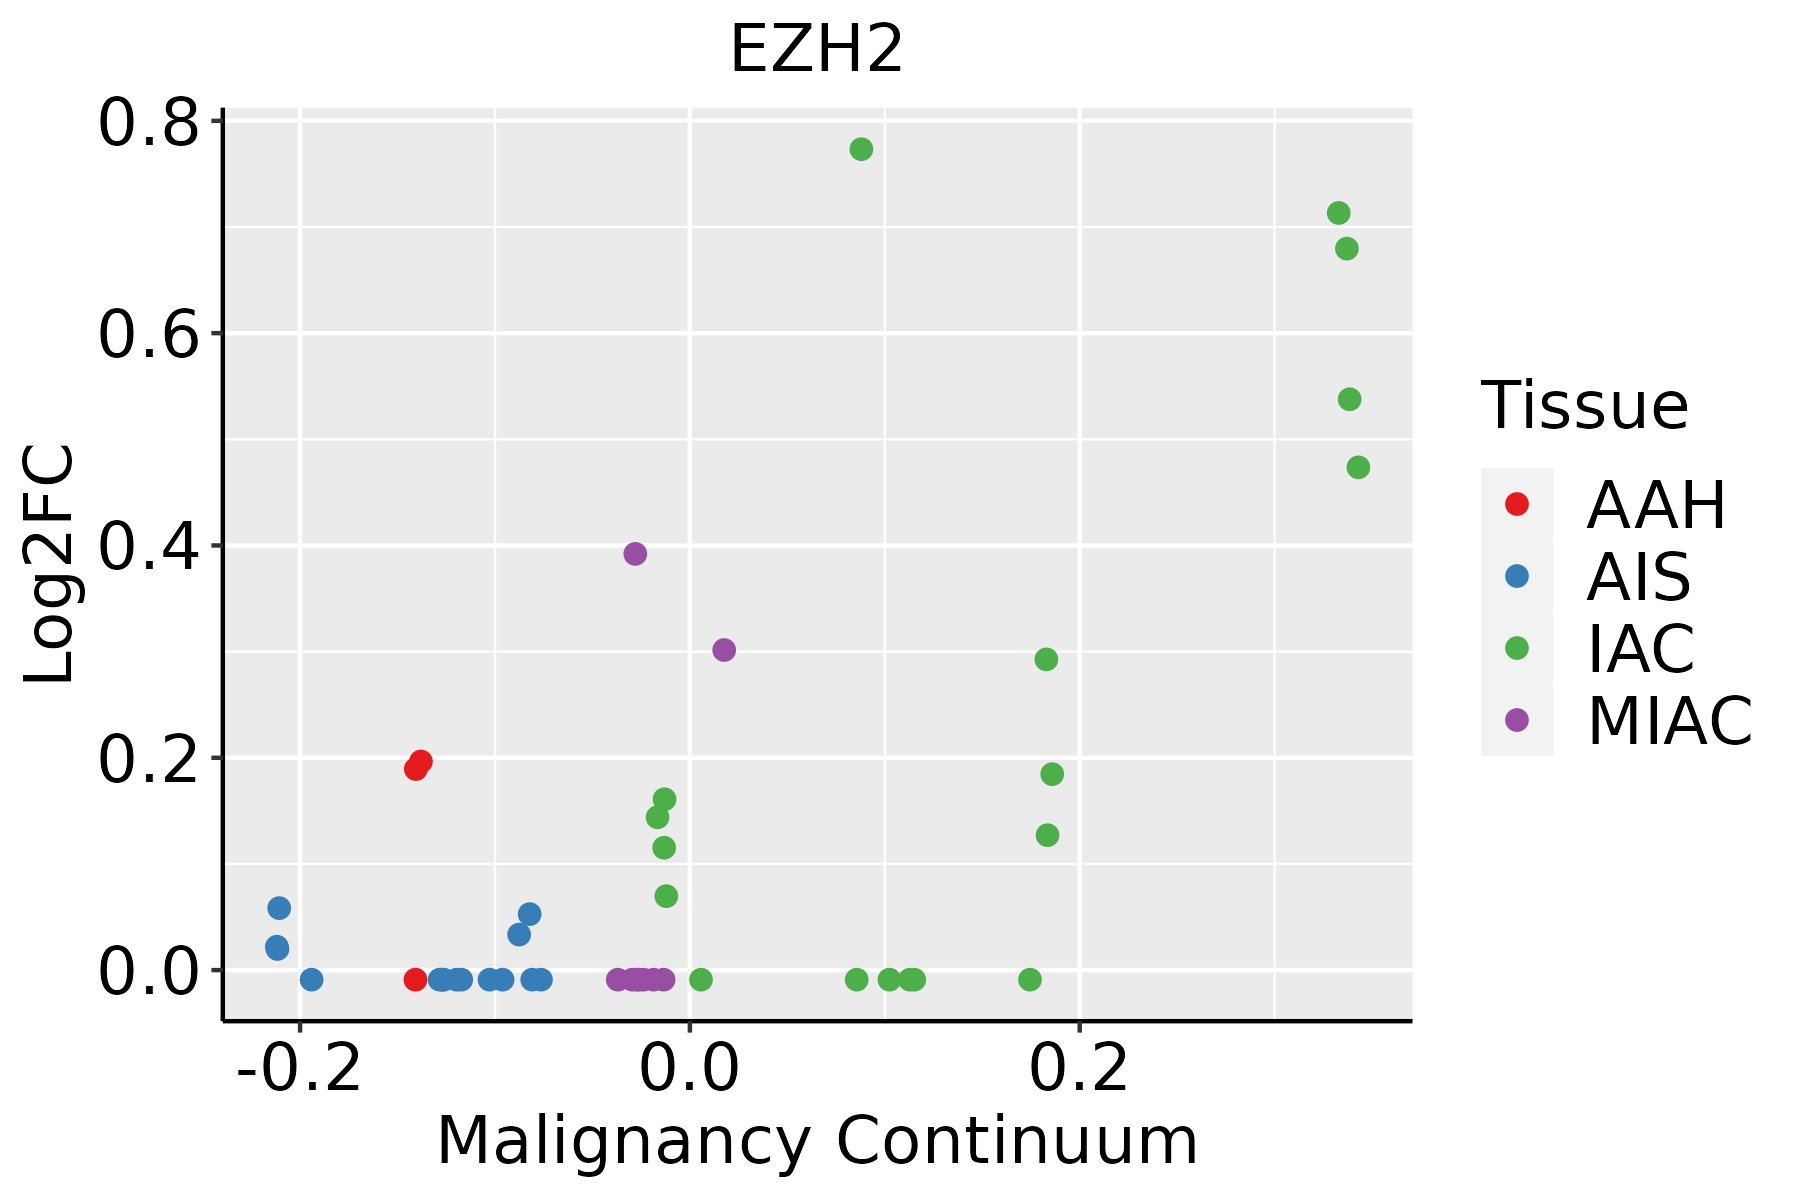 | AAH: Atypical adenomatous hyperplasia |
| AIS: Adenocarcinoma in situ |
| IAC: Invasive lung adenocarcinoma |
| MIA: Minimally invasive adenocarcinoma |
| Oral Cavity |  | EOLP: Erosive Oral lichen planus |
| LP: leukoplakia |
| NEOLP: Non-erosive oral lichen planus |
| OSCC: Oral squamous cell carcinoma |
| Thyroid | 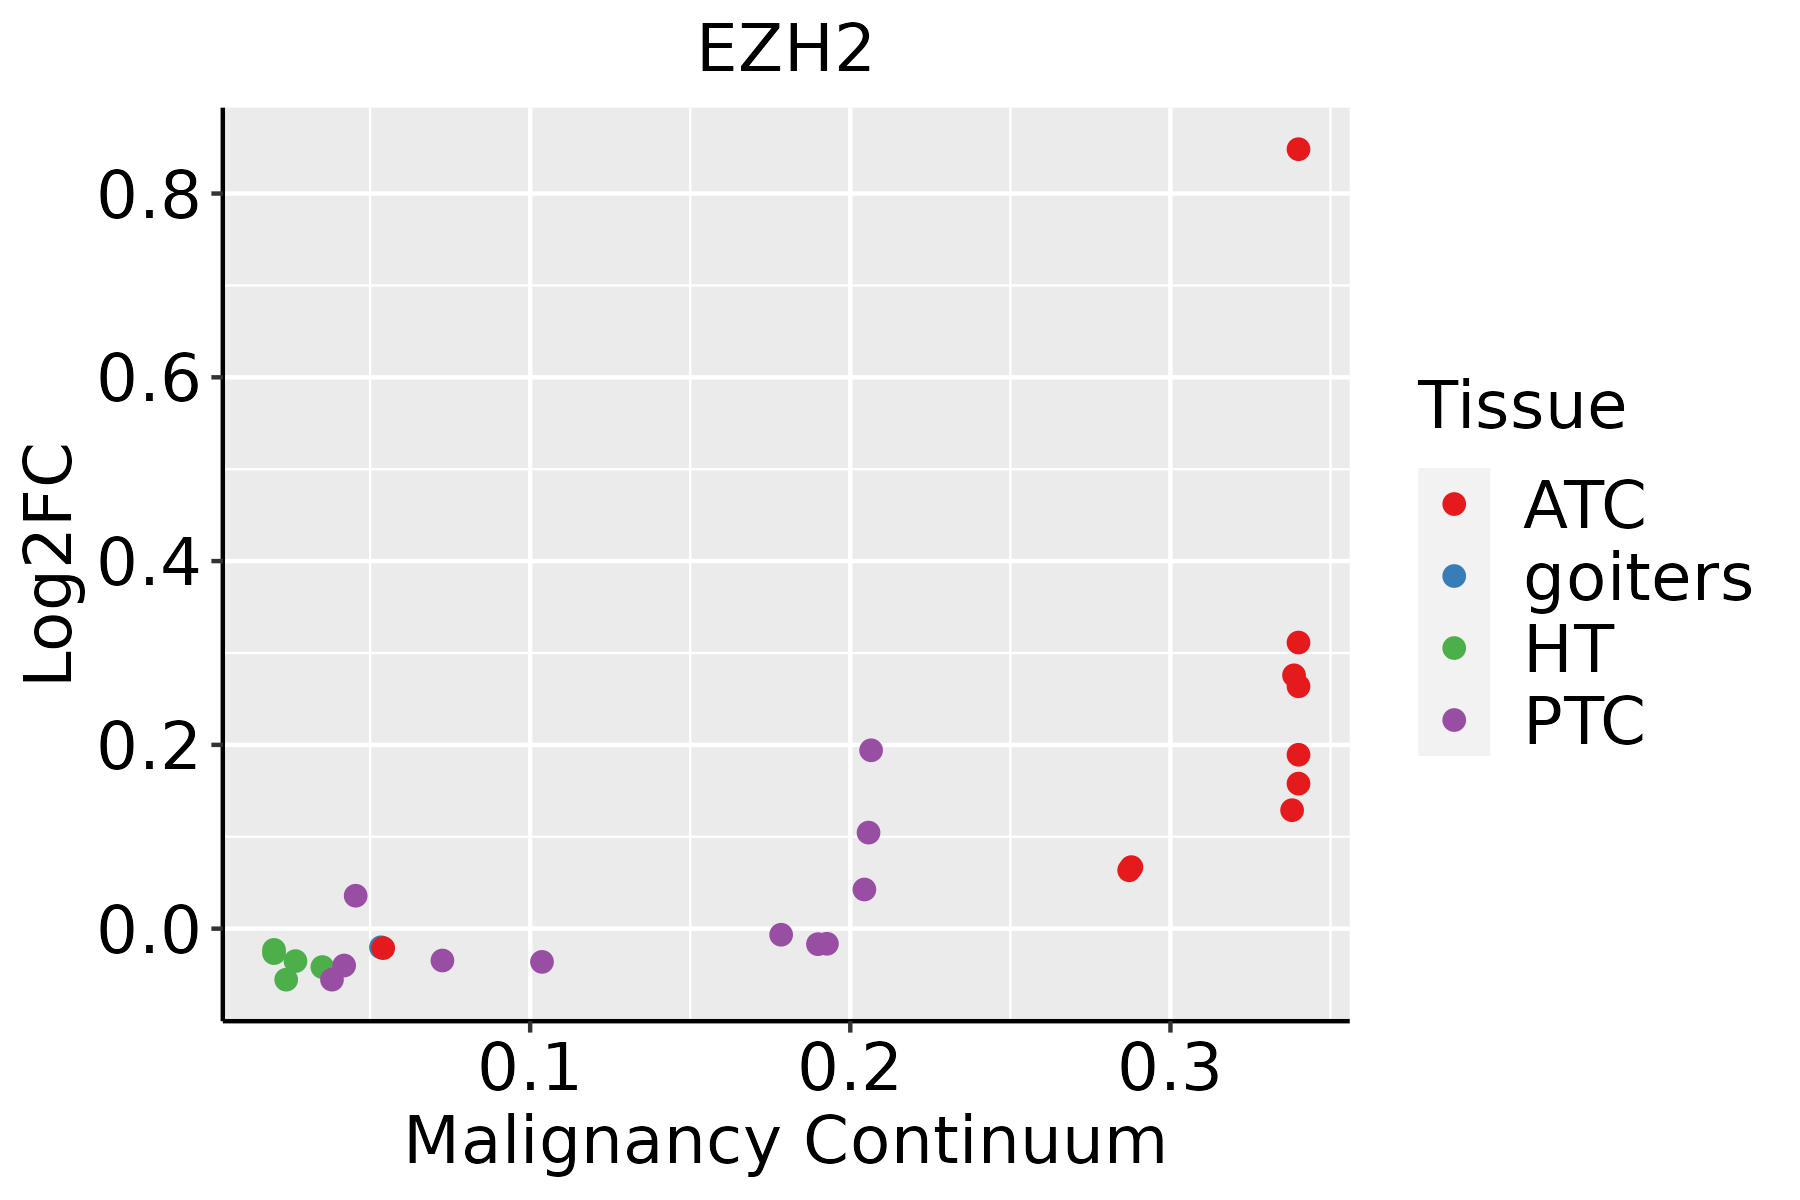 | ATC: Anaplastic thyroid cancer |
| HT: Hashimoto's thyroiditis |
| PTC: Papillary thyroid cancer |
| GO ID | Tissue | Disease Stage | Description | Gene Ratio | Bg Ratio | pvalue | p.adjust | Count |
| GO:00457876 | Cervix | CC | positive regulation of cell cycle | 66/2311 | 313/18723 | 7.78e-06 | 1.81e-04 | 66 |
| GO:00313467 | Cervix | CC | positive regulation of cell projection organization | 72/2311 | 353/18723 | 1.04e-05 | 2.32e-04 | 72 |
| GO:00456042 | Cervix | CC | regulation of epidermal cell differentiation | 20/2311 | 58/18723 | 1.07e-05 | 2.33e-04 | 20 |
| GO:00000824 | Cervix | CC | G1/S transition of mitotic cell cycle | 49/2311 | 214/18723 | 1.16e-05 | 2.48e-04 | 49 |
| GO:19028062 | Cervix | CC | regulation of cell cycle G1/S phase transition | 41/2311 | 168/18723 | 1.18e-05 | 2.51e-04 | 41 |
| GO:00073466 | Cervix | CC | regulation of mitotic cell cycle | 88/2311 | 457/18723 | 1.26e-05 | 2.60e-04 | 88 |
| GO:19019903 | Cervix | CC | regulation of mitotic cell cycle phase transition | 63/2311 | 299/18723 | 1.27e-05 | 2.60e-04 | 63 |
| GO:00310996 | Cervix | CC | regeneration | 46/2311 | 198/18723 | 1.43e-05 | 2.84e-04 | 46 |
| GO:00448434 | Cervix | CC | cell cycle G1/S phase transition | 53/2311 | 241/18723 | 1.76e-05 | 3.32e-04 | 53 |
| GO:00719025 | Cervix | CC | positive regulation of protein serine/threonine kinase activity | 46/2311 | 200/18723 | 1.87e-05 | 3.47e-04 | 46 |
| GO:004873210 | Cervix | CC | gland development | 84/2311 | 436/18723 | 1.93e-05 | 3.54e-04 | 84 |
| GO:00434104 | Cervix | CC | positive regulation of MAPK cascade | 90/2311 | 480/18723 | 2.92e-05 | 4.83e-04 | 90 |
| GO:00063257 | Cervix | CC | chromatin organization | 78/2311 | 409/18723 | 5.40e-05 | 8.02e-04 | 78 |
| GO:00076238 | Cervix | CC | circadian rhythm | 46/2311 | 210/18723 | 6.76e-05 | 9.60e-04 | 46 |
| GO:00323556 | Cervix | CC | response to estradiol | 34/2311 | 141/18723 | 8.19e-05 | 1.11e-03 | 34 |
| GO:00900685 | Cervix | CC | positive regulation of cell cycle process | 50/2311 | 236/18723 | 8.25e-05 | 1.11e-03 | 50 |
| GO:00435476 | Cervix | CC | positive regulation of GTPase activity | 53/2311 | 255/18723 | 8.72e-05 | 1.16e-03 | 53 |
| GO:19019873 | Cervix | CC | regulation of cell cycle phase transition | 74/2311 | 390/18723 | 9.80e-05 | 1.27e-03 | 74 |
| GO:00308563 | Cervix | CC | regulation of epithelial cell differentiation | 36/2311 | 154/18723 | 1.02e-04 | 1.31e-03 | 36 |
| GO:00165705 | Cervix | CC | histone modification | 84/2311 | 463/18723 | 1.70e-04 | 2.01e-03 | 84 |
| Hugo Symbol | Variant Class | Variant Classification | dbSNP RS | HGVSc | HGVSp | HGVSp Short | SWISSPROT | BIOTYPE | SIFT | PolyPhen | Tumor Sample Barcode | Tissue | Histology | Sex | Age | Stage | Therapy Types | Drugs | Outcome |
| EZH2 | SNV | Missense_Mutation | | c.2168N>T | p.Thr723Ile | p.T723I | Q15910 | protein_coding | deleterious(0.02) | probably_damaging(0.997) | TCGA-A2-A0YE-01 | Breast | breast invasive carcinoma | Female | <65 | I/II | Unspecific | Taxotere | SD |
| EZH2 | SNV | Missense_Mutation | novel | c.1475N>A | p.Thr492Asn | p.T492N | Q15910 | protein_coding | tolerated(0.27) | probably_damaging(0.997) | TCGA-E9-A1N5-01 | Breast | breast invasive carcinoma | Female | <65 | I/II | Chemotherapy | doxorubicin | SD |
| EZH2 | insertion | In_Frame_Ins | novel | c.940_941insGAACAAGAATATTAACAAAAATAAAACGAACATTAG | p.Lys314delinsArgThrArgIleLeuThrLysIleLysArgThrLeuGlu | p.K314delinsRTRILTKIKRTLE | Q15910 | protein_coding | | | TCGA-AO-A128-01 | Breast | breast invasive carcinoma | Female | <65 | I/II | Chemotherapy | doxorubicin | SD |
| EZH2 | SNV | Missense_Mutation | novel | c.1903G>T | p.Asp635Tyr | p.D635Y | Q15910 | protein_coding | deleterious(0.05) | probably_damaging(0.94) | TCGA-2W-A8YY-01 | Cervix | cervical & endocervical cancer | Female | <65 | I/II | Chemotherapy | cisplatin | CR |
| EZH2 | SNV | Missense_Mutation | | c.1090N>T | p.Pro364Ser | p.P364S | Q15910 | protein_coding | tolerated(0.48) | benign(0.178) | TCGA-C5-A1M9-01 | Cervix | cervical & endocervical cancer | Female | <65 | I/II | Chemotherapy | cisplatin | PD |
| EZH2 | SNV | Missense_Mutation | | c.877N>C | p.Asp293His | p.D293H | Q15910 | protein_coding | deleterious(0) | probably_damaging(0.999) | TCGA-EX-A69L-01 | Cervix | cervical & endocervical cancer | Female | <65 | I/II | Unknown | Unknown | SD |
| EZH2 | SNV | Missense_Mutation | | c.2084C>T | p.Ser695Leu | p.S695L | Q15910 | protein_coding | deleterious(0.05) | probably_damaging(0.994) | TCGA-IR-A3LA-01 | Cervix | cervical & endocervical cancer | Female | <65 | I/II | Chemotherapy | cisplatin | CR |
| EZH2 | SNV | Missense_Mutation | | c.1760C>T | p.Pro587Leu | p.P587L | Q15910 | protein_coding | deleterious(0) | probably_damaging(0.999) | TCGA-A6-2679-01 | Colorectum | colon adenocarcinoma | Female | >=65 | I/II | Unknown | Unknown | SD |
| EZH2 | SNV | Missense_Mutation | | c.926N>G | p.Asn309Ser | p.N309S | Q15910 | protein_coding | tolerated(0.17) | possibly_damaging(0.881) | TCGA-A6-3809-01 | Colorectum | colon adenocarcinoma | Female | >=65 | I/II | Unknown | Unknown | SD |
| EZH2 | SNV | Missense_Mutation | | c.451N>C | p.Lys151Gln | p.K151Q | Q15910 | protein_coding | deleterious(0.01) | possibly_damaging(0.727) | TCGA-A6-6141-01 | Colorectum | colon adenocarcinoma | Male | <65 | I/II | Chemotherapy | 5-fu | SD |
| Entrez ID | Symbol | Category | Interaction Types | Drug Claim Name | Drug Name | PMIDs |
| 2146 | EZH2 | CLINICALLY ACTIONABLE, ENZYME, METHYL TRANSFERASE, NUCLEAR HORMONE RECEPTOR, TRANSCRIPTION FACTOR | | GSK2816126 | | |
| 2146 | EZH2 | CLINICALLY ACTIONABLE, ENZYME, METHYL TRANSFERASE, NUCLEAR HORMONE RECEPTOR, TRANSCRIPTION FACTOR | | PMID28394193-Compound-55 | | |
| 2146 | EZH2 | CLINICALLY ACTIONABLE, ENZYME, METHYL TRANSFERASE, NUCLEAR HORMONE RECEPTOR, TRANSCRIPTION FACTOR | inhibitor | 178103592 | | |
| 2146 | EZH2 | CLINICALLY ACTIONABLE, ENZYME, METHYL TRANSFERASE, NUCLEAR HORMONE RECEPTOR, TRANSCRIPTION FACTOR | | PMID28394193-Compound-54 | | |
| 2146 | EZH2 | CLINICALLY ACTIONABLE, ENZYME, METHYL TRANSFERASE, NUCLEAR HORMONE RECEPTOR, TRANSCRIPTION FACTOR | | PMID28394193-Compound-20 | | |
| 2146 | EZH2 | CLINICALLY ACTIONABLE, ENZYME, METHYL TRANSFERASE, NUCLEAR HORMONE RECEPTOR, TRANSCRIPTION FACTOR | | DZNeP | | 25605023 |
| 2146 | EZH2 | CLINICALLY ACTIONABLE, ENZYME, METHYL TRANSFERASE, NUCLEAR HORMONE RECEPTOR, TRANSCRIPTION FACTOR | | PMID28394193-Compound-17 | | |
| 2146 | EZH2 | CLINICALLY ACTIONABLE, ENZYME, METHYL TRANSFERASE, NUCLEAR HORMONE RECEPTOR, TRANSCRIPTION FACTOR | | PMID28394193-Compound-40 | | |
| 2146 | EZH2 | CLINICALLY ACTIONABLE, ENZYME, METHYL TRANSFERASE, NUCLEAR HORMONE RECEPTOR, TRANSCRIPTION FACTOR | | PMID28394193-Compound-12 | | |
| 2146 | EZH2 | CLINICALLY ACTIONABLE, ENZYME, METHYL TRANSFERASE, NUCLEAR HORMONE RECEPTOR, TRANSCRIPTION FACTOR | inhibitor | 178103590 | TAZEMETOSTAT | |


