
|
|||||
|
 | |
| |
| |
| |
| |
| |
|
Gene: EXOC2 |
Gene summary for EXOC2 |
| Gene information | Species | Human | Gene symbol | EXOC2 | Gene ID | 55770 |
| Gene name | exocyst complex component 2 | |
| Gene Alias | NEDFACH | |
| Cytomap | 6p25.3 | |
| Gene Type | protein-coding | GO ID | GO:0006810 | UniProtAcc | A0A024QZT2 |
Top |
Malignant transformation analysis |
| Identification of the aberrant gene expression in precancerous and cancerous lesions by comparing the gene expression of stem-like cells in diseased tissues with normal stem cells |
| Entrez ID | Symbol | Replicates | Species | Organ | Tissue | Adj P-value | Log2FC | Malignancy |
| 55770 | EXOC2 | CCI_1 | Human | Cervix | CC | 4.95e-10 | 6.45e-01 | 0.528 |
| 55770 | EXOC2 | CCI_2 | Human | Cervix | CC | 2.44e-12 | 9.15e-01 | 0.5249 |
| 55770 | EXOC2 | CCI_3 | Human | Cervix | CC | 1.51e-08 | 5.56e-01 | 0.516 |
| 55770 | EXOC2 | LZE4T | Human | Esophagus | ESCC | 9.80e-03 | 1.44e-01 | 0.0811 |
| 55770 | EXOC2 | LZE7T | Human | Esophagus | ESCC | 9.28e-03 | 2.93e-01 | 0.0667 |
| 55770 | EXOC2 | LZE24T | Human | Esophagus | ESCC | 2.30e-06 | 2.11e-01 | 0.0596 |
| 55770 | EXOC2 | LZE21T | Human | Esophagus | ESCC | 1.14e-02 | 2.46e-01 | 0.0655 |
| 55770 | EXOC2 | LZE6T | Human | Esophagus | ESCC | 5.61e-03 | 1.48e-01 | 0.0845 |
| 55770 | EXOC2 | P2T-E | Human | Esophagus | ESCC | 3.52e-19 | 3.17e-01 | 0.1177 |
| 55770 | EXOC2 | P4T-E | Human | Esophagus | ESCC | 5.60e-07 | 1.42e-01 | 0.1323 |
| 55770 | EXOC2 | P5T-E | Human | Esophagus | ESCC | 2.15e-03 | 6.18e-02 | 0.1327 |
| 55770 | EXOC2 | P8T-E | Human | Esophagus | ESCC | 2.06e-08 | 1.71e-01 | 0.0889 |
| 55770 | EXOC2 | P9T-E | Human | Esophagus | ESCC | 3.03e-06 | 1.07e-01 | 0.1131 |
| 55770 | EXOC2 | P10T-E | Human | Esophagus | ESCC | 8.40e-04 | 1.05e-01 | 0.116 |
| 55770 | EXOC2 | P11T-E | Human | Esophagus | ESCC | 9.52e-17 | 5.88e-01 | 0.1426 |
| 55770 | EXOC2 | P12T-E | Human | Esophagus | ESCC | 4.40e-09 | 1.44e-01 | 0.1122 |
| 55770 | EXOC2 | P15T-E | Human | Esophagus | ESCC | 5.91e-05 | 1.38e-01 | 0.1149 |
| 55770 | EXOC2 | P16T-E | Human | Esophagus | ESCC | 4.30e-10 | 1.71e-01 | 0.1153 |
| 55770 | EXOC2 | P17T-E | Human | Esophagus | ESCC | 4.65e-07 | 3.36e-01 | 0.1278 |
| 55770 | EXOC2 | P19T-E | Human | Esophagus | ESCC | 3.20e-07 | 3.37e-01 | 0.1662 |
| Page: 1 2 3 4 |
| Tissue | Expression Dynamics | Abbreviation |
| Cervix |  | CC: Cervix cancer |
| HSIL_HPV: HPV-infected high-grade squamous intraepithelial lesions | ||
| N_HPV: HPV-infected normal cervix | ||
| Esophagus | 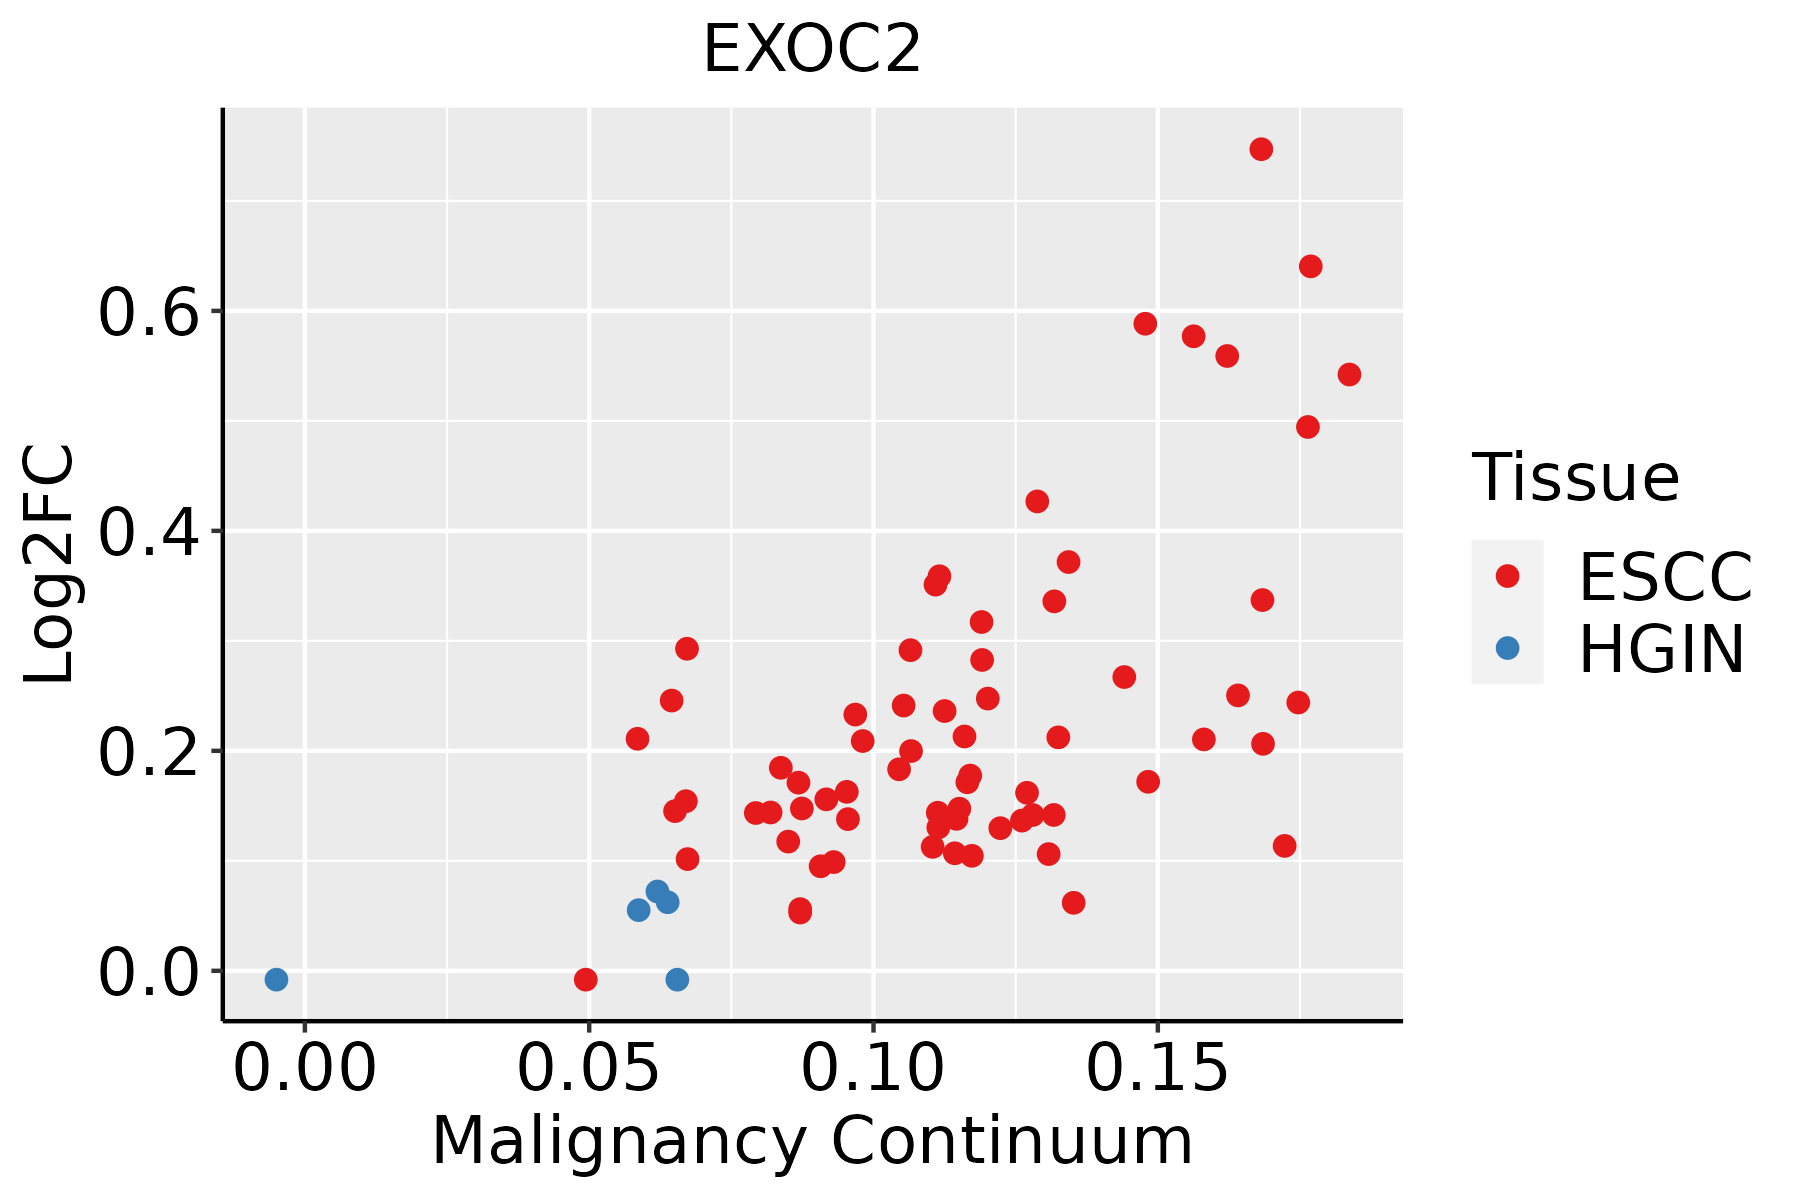 | ESCC: Esophageal squamous cell carcinoma |
| HGIN: High-grade intraepithelial neoplasias | ||
| LGIN: Low-grade intraepithelial neoplasias | ||
| Liver |  | HCC: Hepatocellular carcinoma |
| NAFLD: Non-alcoholic fatty liver disease |
| ∗log2FC in expression of this searched gene in stem-like cells from each diseased tissue sample relative to stem-like cells in normal samples in each tissue plotted against the malignancy continuum. Samples are colored based on if they are from different disease stage. |
Top |
Malignant transformation related pathway analysis |
| Find out the enriched GO biological processes and KEGG pathways involved in transition from healthy to precancer to cancer |
| Tissue | Disease Stage | Enriched GO biological Processes |
| Colorectum | AD |  |
| Colorectum | SER |  |
| Colorectum | MSS |  |
| Colorectum | MSI-H |  |
| Colorectum | FAP |  |
| ∗Top 15 enriched GO BP terms are showed in the bar plot of each disease state in each tissue. Each row represents a significant GO biological process which is colored according to the -log10(p.adjust). |
| Page: 1 2 3 4 5 6 7 8 9 |
| GO ID | Tissue | Disease Stage | Description | Gene Ratio | Bg Ratio | pvalue | p.adjust | Count |
| GO:005237219 | Esophagus | ESCC | modulation by symbiont of entry into host | 32/8552 | 49/18723 | 4.39e-03 | 1.73e-02 | 32 |
| GO:00481936 | Liver | NAFLD | Golgi vesicle transport | 66/1882 | 296/18723 | 3.66e-10 | 9.30e-08 | 66 |
| GO:00068925 | Liver | NAFLD | post-Golgi vesicle-mediated transport | 31/1882 | 104/18723 | 1.70e-08 | 2.03e-06 | 31 |
| GO:00068934 | Liver | NAFLD | Golgi to plasma membrane transport | 19/1882 | 60/18723 | 3.60e-06 | 1.42e-04 | 19 |
| GO:00988765 | Liver | NAFLD | vesicle-mediated transport to the plasma membrane | 30/1882 | 136/18723 | 2.76e-05 | 7.39e-04 | 30 |
| GO:00444037 | Liver | NAFLD | biological process involved in symbiotic interaction | 50/1882 | 290/18723 | 1.03e-04 | 2.04e-03 | 50 |
| GO:00517017 | Liver | NAFLD | biological process involved in interaction with host | 32/1882 | 203/18723 | 6.90e-03 | 4.87e-02 | 32 |
| GO:004819321 | Liver | HCC | Golgi vesicle transport | 217/7958 | 296/18723 | 2.58e-27 | 1.02e-24 | 217 |
| GO:004440322 | Liver | HCC | biological process involved in symbiotic interaction | 183/7958 | 290/18723 | 9.13e-13 | 4.59e-11 | 183 |
| GO:000689221 | Liver | HCC | post-Golgi vesicle-mediated transport | 77/7958 | 104/18723 | 6.14e-11 | 2.24e-09 | 77 |
| GO:005170122 | Liver | HCC | biological process involved in interaction with host | 128/7958 | 203/18723 | 2.51e-09 | 6.91e-08 | 128 |
| GO:009887621 | Liver | HCC | vesicle-mediated transport to the plasma membrane | 92/7958 | 136/18723 | 2.57e-09 | 7.07e-08 | 92 |
| GO:005212612 | Liver | HCC | movement in host environment | 109/7958 | 175/18723 | 9.58e-08 | 1.89e-06 | 109 |
| GO:000689321 | Liver | HCC | Golgi to plasma membrane transport | 44/7958 | 60/18723 | 1.24e-06 | 1.81e-05 | 44 |
| GO:004440912 | Liver | HCC | entry into host | 88/7958 | 151/18723 | 6.47e-05 | 5.91e-04 | 88 |
| GO:004390311 | Liver | HCC | regulation of biological process involved in symbiotic interaction | 45/7958 | 72/18723 | 4.86e-04 | 3.19e-03 | 45 |
| GO:005237211 | Liver | HCC | modulation by symbiont of entry into host | 29/7958 | 49/18723 | 1.37e-02 | 4.86e-02 | 29 |
| Page: 1 2 |
| Pathway ID | Tissue | Disease Stage | Description | Gene Ratio | Bg Ratio | pvalue | p.adjust | qvalue | Count |
| hsa0513220 | Cervix | CC | Salmonella infection | 74/1267 | 249/8465 | 1.33e-09 | 2.54e-08 | 1.50e-08 | 74 |
| hsa040142 | Cervix | CC | Ras signaling pathway | 51/1267 | 236/8465 | 3.55e-03 | 1.34e-02 | 7.91e-03 | 51 |
| hsa05132110 | Cervix | CC | Salmonella infection | 74/1267 | 249/8465 | 1.33e-09 | 2.54e-08 | 1.50e-08 | 74 |
| hsa0401411 | Cervix | CC | Ras signaling pathway | 51/1267 | 236/8465 | 3.55e-03 | 1.34e-02 | 7.91e-03 | 51 |
| hsa05132211 | Esophagus | ESCC | Salmonella infection | 191/4205 | 249/8465 | 6.51e-19 | 5.45e-17 | 2.79e-17 | 191 |
| hsa05132310 | Esophagus | ESCC | Salmonella infection | 191/4205 | 249/8465 | 6.51e-19 | 5.45e-17 | 2.79e-17 | 191 |
| hsa0513214 | Liver | NAFLD | Salmonella infection | 55/1043 | 249/8465 | 8.48e-06 | 3.09e-04 | 2.49e-04 | 55 |
| hsa0513215 | Liver | NAFLD | Salmonella infection | 55/1043 | 249/8465 | 8.48e-06 | 3.09e-04 | 2.49e-04 | 55 |
| hsa0513242 | Liver | HCC | Salmonella infection | 178/4020 | 249/8465 | 5.90e-15 | 1.98e-13 | 1.10e-13 | 178 |
| hsa0513252 | Liver | HCC | Salmonella infection | 178/4020 | 249/8465 | 5.90e-15 | 1.98e-13 | 1.10e-13 | 178 |
| Page: 1 |
Top |
Cell-cell communication analysis |
| Identification of potential cell-cell interactions between two cell types and their ligand-receptor pairs for different disease states |
| Ligand | Receptor | LRpair | Pathway | Tissue | Disease Stage |
| Page: 1 |
Top |
Single-cell gene regulatory network inference analysis |
| Find out the significant the regulons (TFs) and the target genes of each regulon across cell types for different disease states |
| TF | Cell Type | Tissue | Disease Stage | Target Gene | RSS | Regulon Activity |
| ∗The dot plots of a searched regulon are shown for all cell subpopulations in each disease state of each tissue based on the regulon specific score inferred using pySCENIC and by calculating the average expression. |
| Page: 1 |
Top |
Somatic mutation of malignant transformation related genes |
| Annotation of somatic variants for genes involved in malignant transformation |
| Hugo Symbol | Variant Class | Variant Classification | dbSNP RS | HGVSc | HGVSp | HGVSp Short | SWISSPROT | BIOTYPE | SIFT | PolyPhen | Tumor Sample Barcode | Tissue | Histology | Sex | Age | Stage | Therapy Types | Drugs | Outcome |
| EXOC2 | SNV | Missense_Mutation | c.22N>T | p.Pro8Ser | p.P8S | Q96KP1 | protein_coding | deleterious(0) | probably_damaging(1) | TCGA-A8-A076-01 | Breast | breast invasive carcinoma | Female | >=65 | I/II | Hormone Therapy | anastrozole | SD | |
| EXOC2 | SNV | Missense_Mutation | c.862C>G | p.Leu288Val | p.L288V | Q96KP1 | protein_coding | tolerated(0.16) | benign(0.009) | TCGA-AC-A23H-01 | Breast | breast invasive carcinoma | Female | >=65 | I/II | Unknown | Unknown | PD | |
| EXOC2 | SNV | Missense_Mutation | rs572181971 | c.507N>T | p.Trp169Cys | p.W169C | Q96KP1 | protein_coding | deleterious(0) | possibly_damaging(0.781) | TCGA-BH-A18U-01 | Breast | breast invasive carcinoma | Female | >=65 | III/IV | Unknown | Unknown | SD |
| EXOC2 | SNV | Missense_Mutation | c.2437N>A | p.Val813Met | p.V813M | Q96KP1 | protein_coding | deleterious(0) | probably_damaging(0.972) | TCGA-C8-A278-01 | Breast | breast invasive carcinoma | Female | <65 | III/IV | Hormone Therapy | tamoxiphen | SD | |
| EXOC2 | SNV | Missense_Mutation | rs772355029 | c.1295G>T | p.Ser432Ile | p.S432I | Q96KP1 | protein_coding | tolerated(0.09) | benign(0.009) | TCGA-D8-A142-01 | Breast | breast invasive carcinoma | Female | >=65 | I/II | Chemotherapy | cyclophosphamid | SD |
| EXOC2 | SNV | Missense_Mutation | c.1357N>A | p.Glu453Lys | p.E453K | Q96KP1 | protein_coding | deleterious(0.01) | possibly_damaging(0.722) | TCGA-D8-A1Y1-01 | Breast | breast invasive carcinoma | Female | >=65 | III/IV | Hormone Therapy | tamoxiphen | PD | |
| EXOC2 | SNV | Missense_Mutation | c.2549N>C | p.Gly850Ala | p.G850A | Q96KP1 | protein_coding | deleterious(0.02) | benign(0.4) | TCGA-E2-A14V-01 | Breast | breast invasive carcinoma | Female | <65 | I/II | Chemotherapy | cyclophosphamide | SD | |
| EXOC2 | SNV | Missense_Mutation | c.1372C>T | p.Leu458Phe | p.L458F | Q96KP1 | protein_coding | deleterious(0.02) | possibly_damaging(0.564) | TCGA-GM-A2D9-01 | Breast | breast invasive carcinoma | Female | >=65 | I/II | Hormone Therapy | arimidex | SD | |
| EXOC2 | insertion | Frame_Shift_Ins | novel | c.1597_1598insT | p.Gln533LeufsTer28 | p.Q533Lfs*28 | Q96KP1 | protein_coding | TCGA-AO-A0JB-01 | Breast | breast invasive carcinoma | Female | <65 | III/IV | Chemotherapy | cyclophosphamide | SD | ||
| EXOC2 | insertion | Nonsense_Mutation | novel | c.1596_1597insAAGACTGGATTGTTGACAATGAAGGACTGACTTCT | p.Gln533LysfsTer10 | p.Q533Kfs*10 | Q96KP1 | protein_coding | TCGA-AO-A0JB-01 | Breast | breast invasive carcinoma | Female | <65 | III/IV | Chemotherapy | cyclophosphamide | SD |
| Page: 1 2 3 4 5 6 7 8 9 10 |
Top |
Related drugs of malignant transformation related genes |
| Identification of chemicals and drugs interact with genes involved in malignant transfromation |
| (DGIdb 4.0) |
| Entrez ID | Symbol | Category | Interaction Types | Drug Claim Name | Drug Name | PMIDs |
| Page: 1 |

Copyright 2023-Present -The University of Texas Health Science Center at Houston |