| Tissue | Expression Dynamics | Abbreviation |
| Cervix | 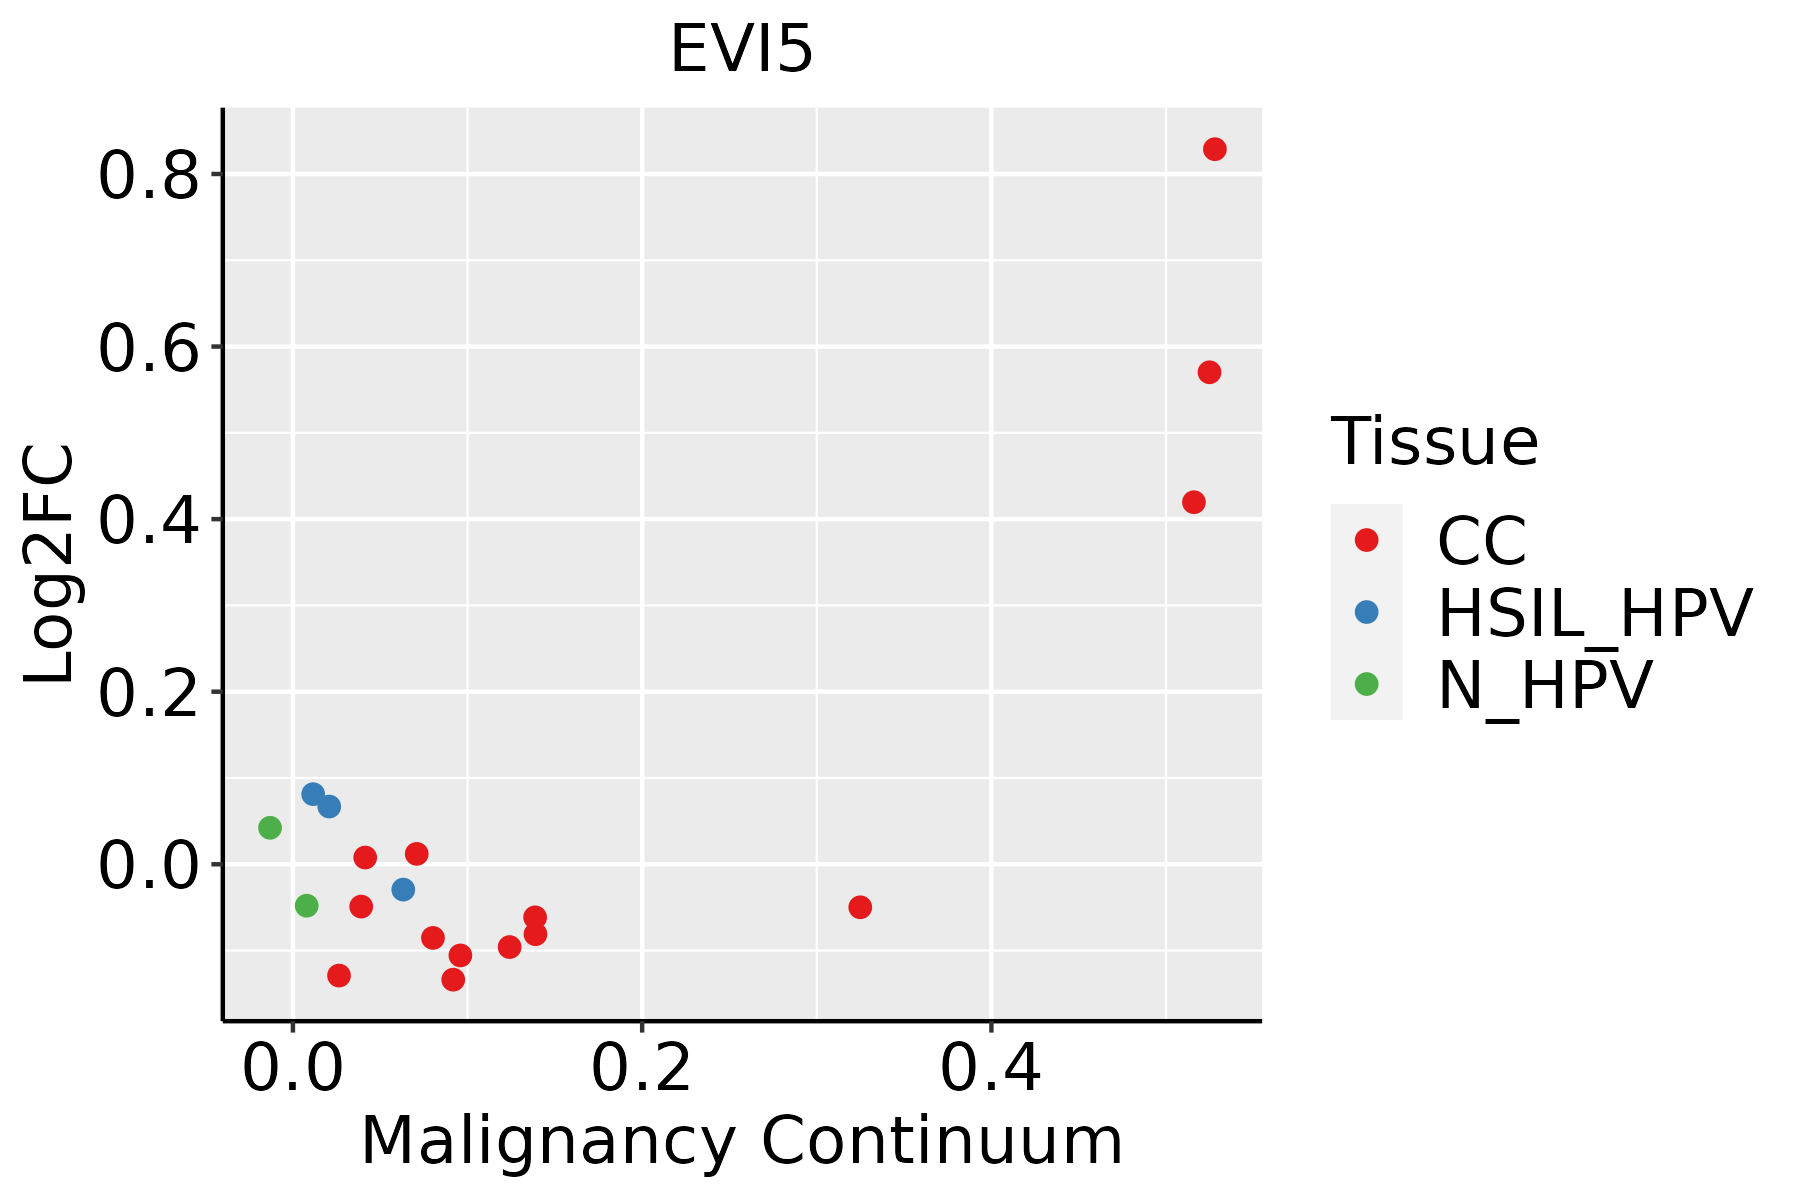 | CC: Cervix cancer |
| HSIL_HPV: HPV-infected high-grade squamous intraepithelial lesions |
| N_HPV: HPV-infected normal cervix |
| Colorectum (GSE201348) |  | FAP: Familial adenomatous polyposis |
| CRC: Colorectal cancer |
| Colorectum (HTA11) |  | AD: Adenomas |
| SER: Sessile serrated lesions |
| MSI-H: Microsatellite-high colorectal cancer |
| MSS: Microsatellite stable colorectal cancer |
| Endometrium |  | AEH: Atypical endometrial hyperplasia |
| EEC: Endometrioid Cancer |
| Esophagus | 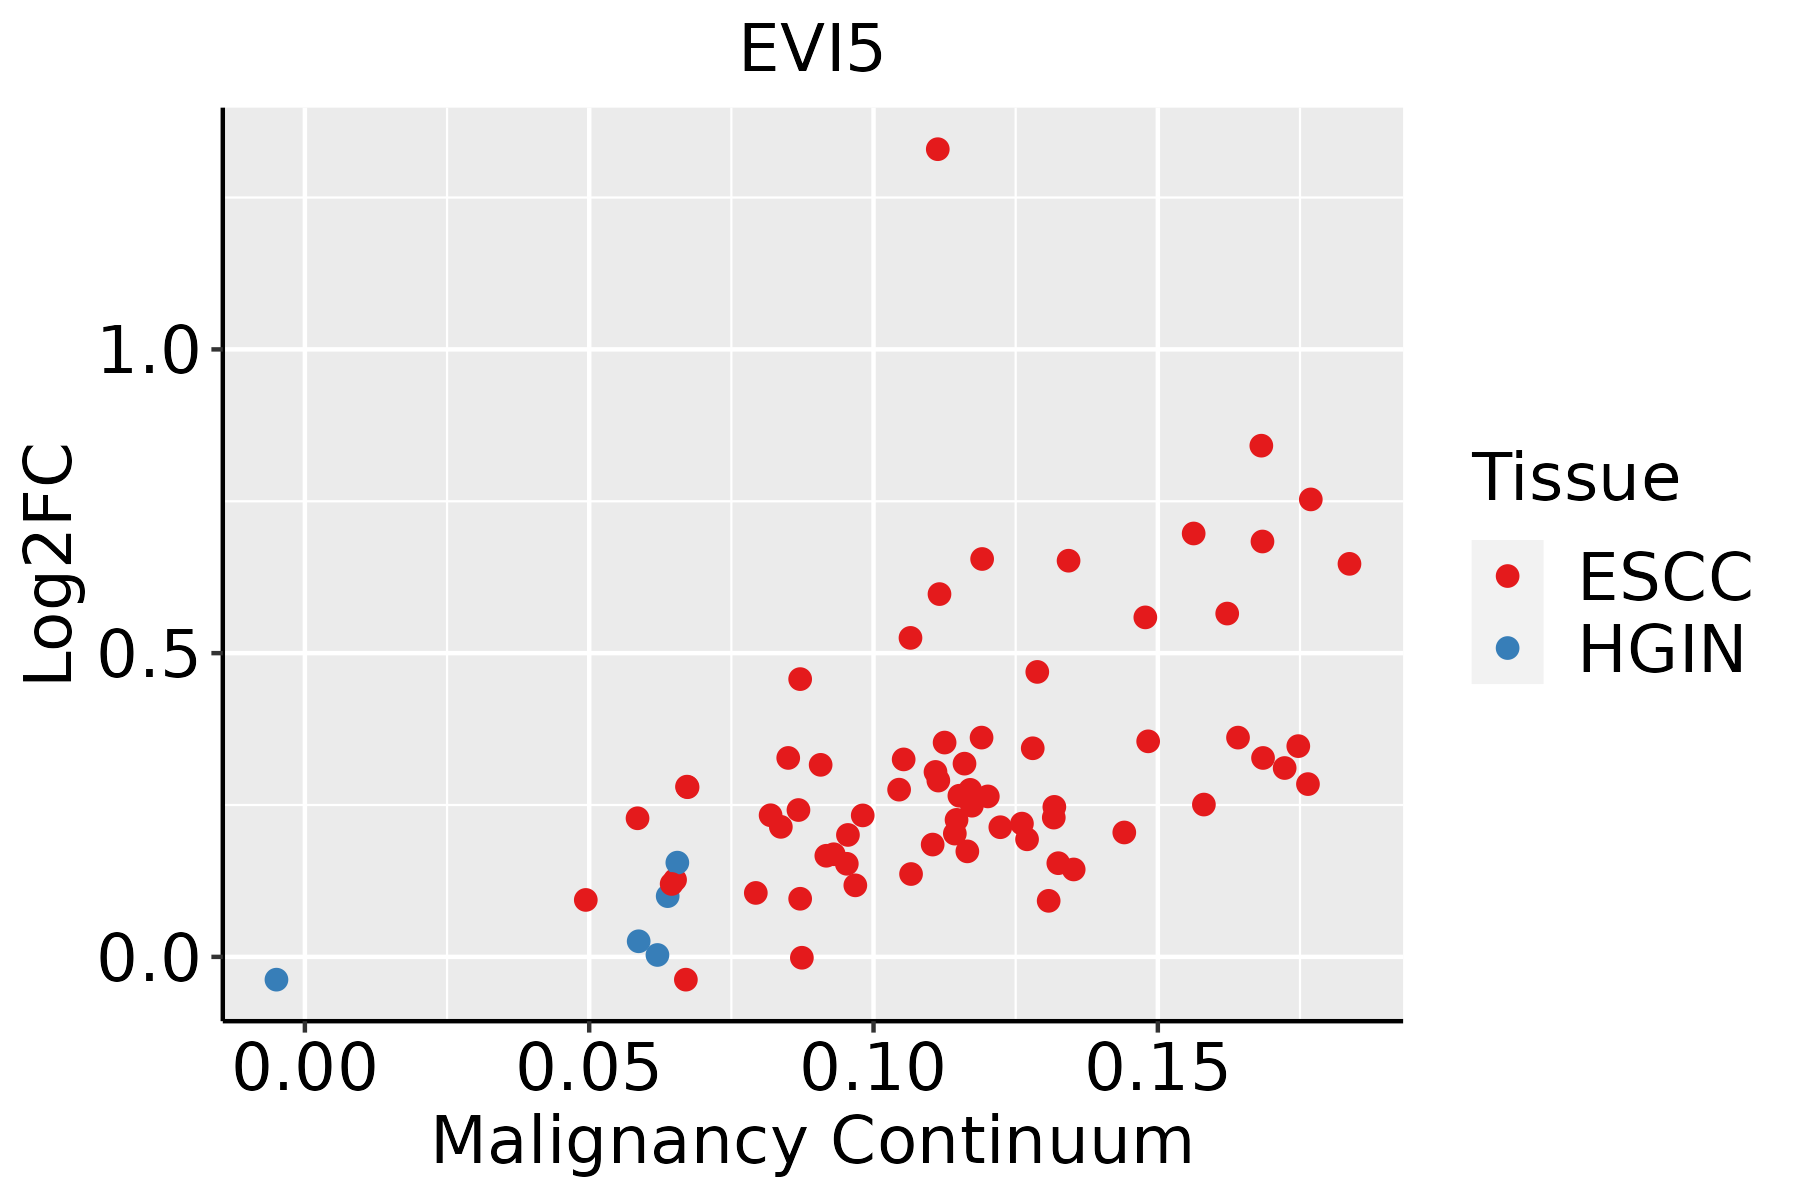 | ESCC: Esophageal squamous cell carcinoma |
| HGIN: High-grade intraepithelial neoplasias |
| LGIN: Low-grade intraepithelial neoplasias |
| Liver | 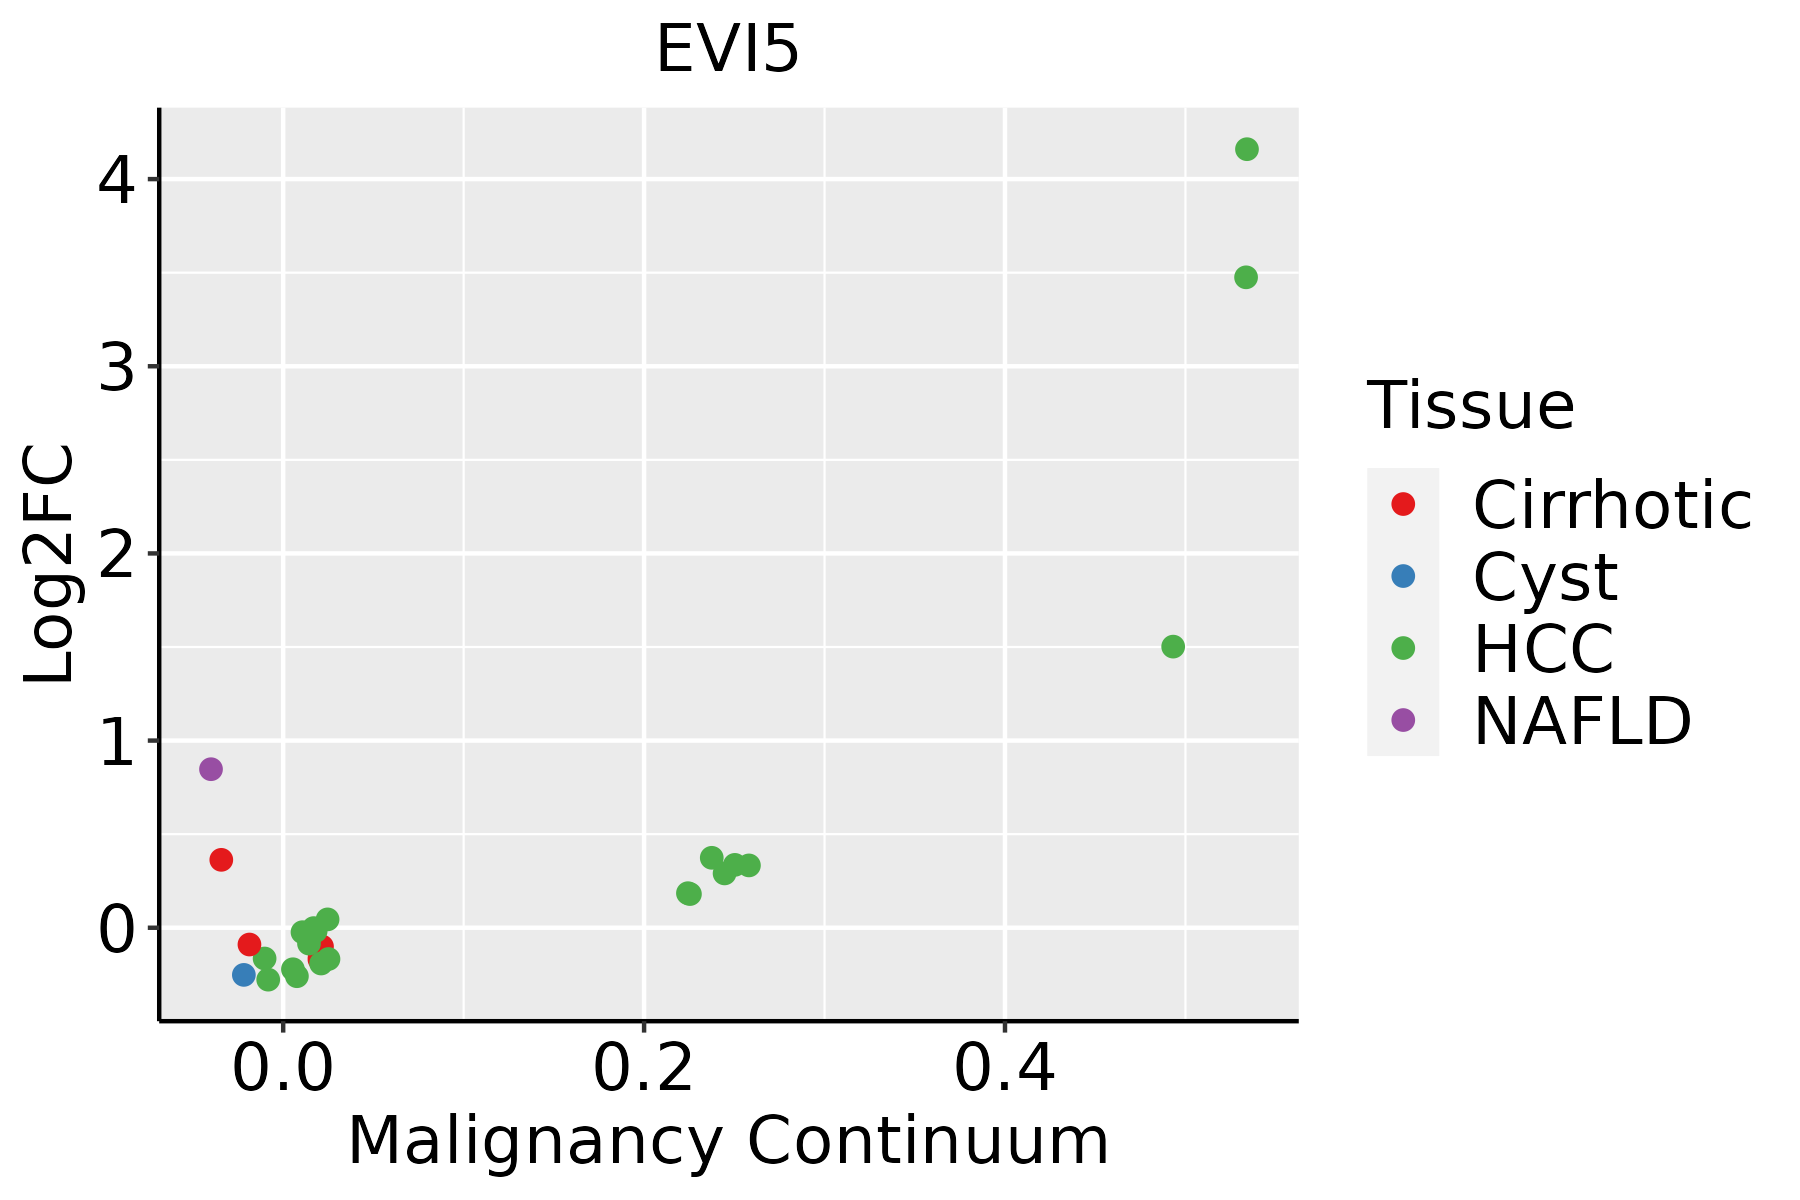 | HCC: Hepatocellular carcinoma |
| NAFLD: Non-alcoholic fatty liver disease |
| Lung |  | AAH: Atypical adenomatous hyperplasia |
| AIS: Adenocarcinoma in situ |
| IAC: Invasive lung adenocarcinoma |
| MIA: Minimally invasive adenocarcinoma |
| Skin |  | AK: Actinic keratosis |
| cSCC: Cutaneous squamous cell carcinoma |
| SCCIS:squamous cell carcinoma in situ |
| Thyroid | 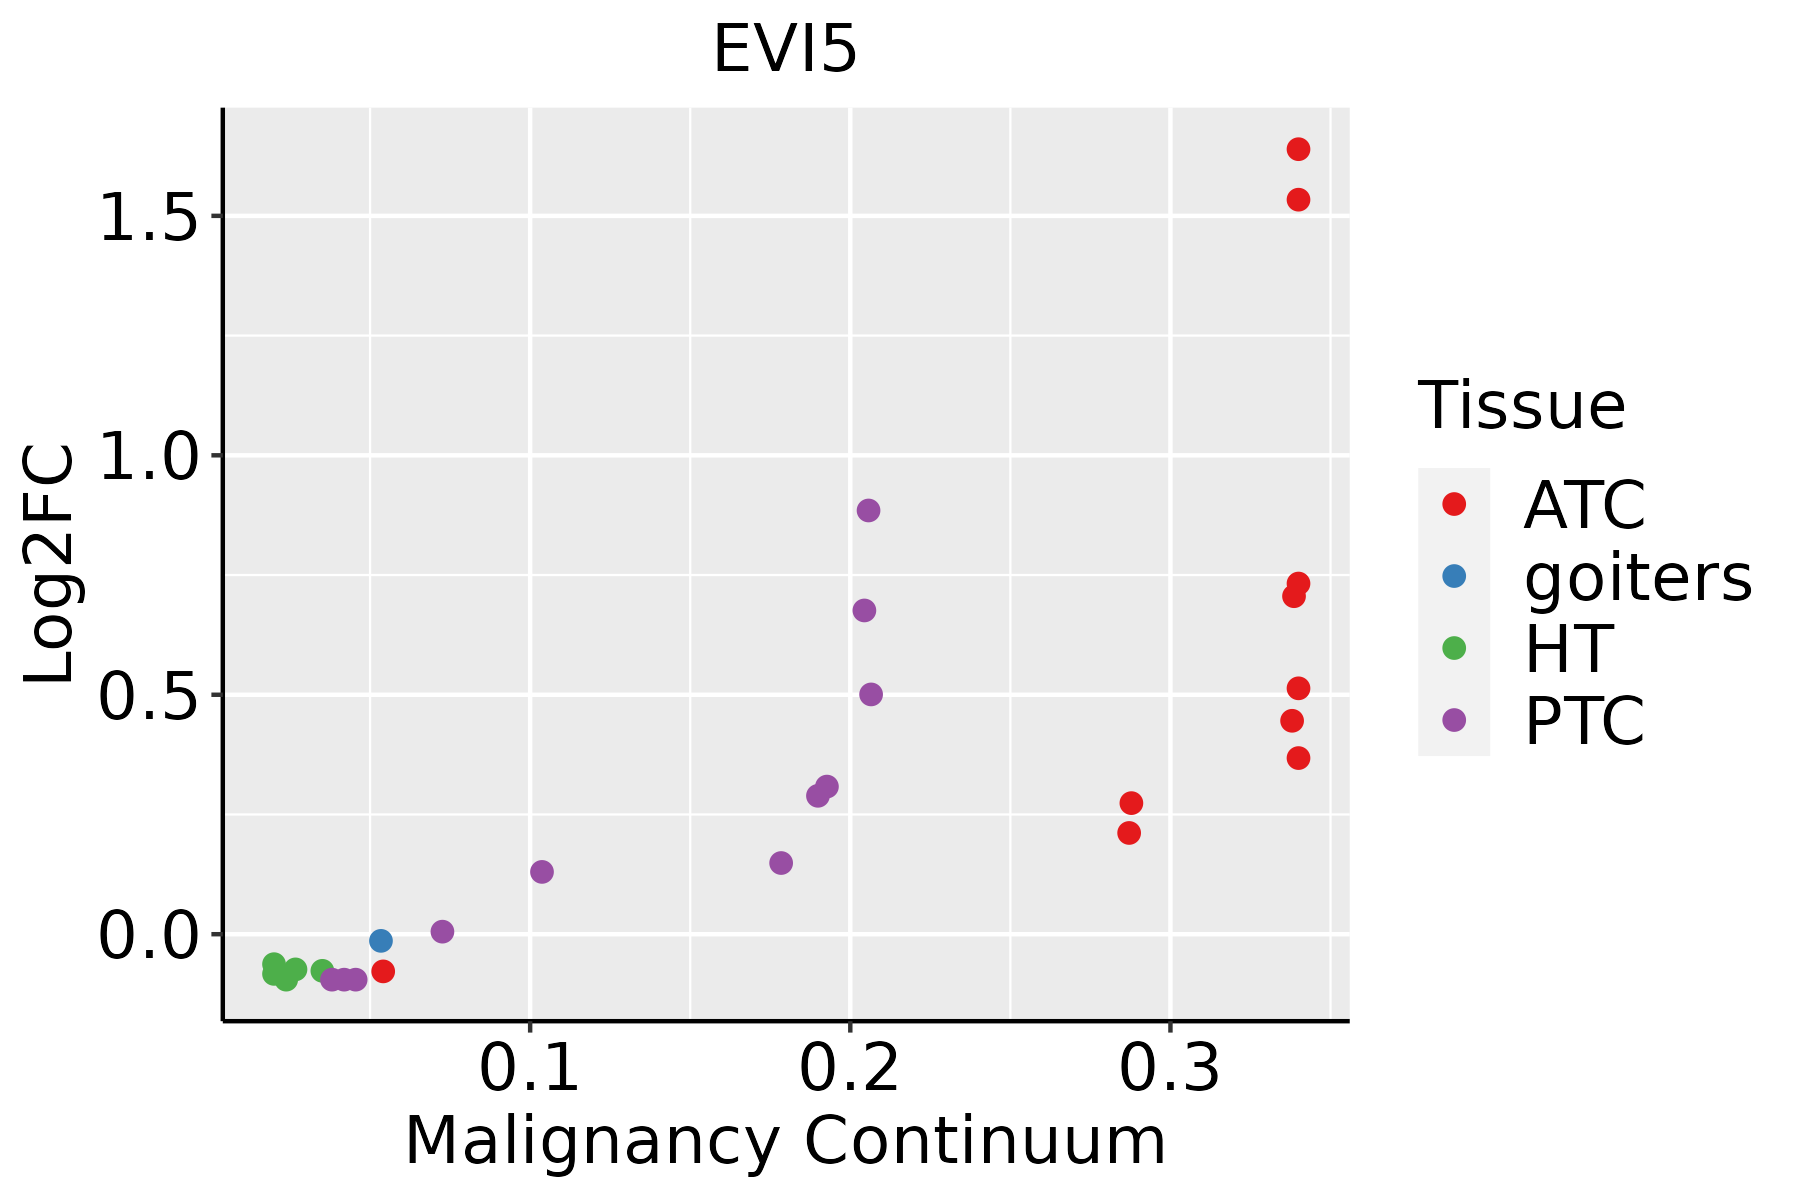 | ATC: Anaplastic thyroid cancer |
| HT: Hashimoto's thyroiditis |
| PTC: Papillary thyroid cancer |
| GO ID | Tissue | Disease Stage | Description | Gene Ratio | Bg Ratio | pvalue | p.adjust | Count |
| GO:00161973 | Colorectum | FAP | endosomal transport | 56/2622 | 230/18723 | 1.79e-05 | 4.53e-04 | 56 |
| GO:00421472 | Colorectum | FAP | retrograde transport, endosome to Golgi | 26/2622 | 91/18723 | 2.21e-04 | 3.14e-03 | 26 |
| GO:0090630 | Colorectum | FAP | activation of GTPase activity | 27/2622 | 115/18723 | 4.23e-03 | 2.90e-02 | 27 |
| GO:00164824 | Colorectum | CRC | cytosolic transport | 45/2078 | 168/18723 | 1.22e-08 | 2.52e-06 | 45 |
| GO:00430874 | Colorectum | CRC | regulation of GTPase activity | 69/2078 | 348/18723 | 1.11e-06 | 6.69e-05 | 69 |
| GO:00161974 | Colorectum | CRC | endosomal transport | 49/2078 | 230/18723 | 5.07e-06 | 2.05e-04 | 49 |
| GO:00421473 | Colorectum | CRC | retrograde transport, endosome to Golgi | 24/2078 | 91/18723 | 3.88e-05 | 9.49e-04 | 24 |
| GO:00435473 | Colorectum | CRC | positive regulation of GTPase activity | 49/2078 | 255/18723 | 8.67e-05 | 1.77e-03 | 49 |
| GO:00430878 | Endometrium | AEH | regulation of GTPase activity | 66/2100 | 348/18723 | 1.26e-05 | 2.77e-04 | 66 |
| GO:00435477 | Endometrium | AEH | positive regulation of GTPase activity | 48/2100 | 255/18723 | 2.18e-04 | 2.67e-03 | 48 |
| GO:00906304 | Endometrium | AEH | activation of GTPase activity | 22/2100 | 115/18723 | 8.42e-03 | 4.60e-02 | 22 |
| GO:004308712 | Endometrium | EEC | regulation of GTPase activity | 67/2168 | 348/18723 | 1.84e-05 | 3.43e-04 | 67 |
| GO:004354712 | Endometrium | EEC | positive regulation of GTPase activity | 50/2168 | 255/18723 | 1.26e-04 | 1.66e-03 | 50 |
| GO:009063012 | Endometrium | EEC | activation of GTPase activity | 23/2168 | 115/18723 | 6.04e-03 | 3.57e-02 | 23 |
| GO:001619715 | Esophagus | ESCC | endosomal transport | 168/8552 | 230/18723 | 2.28e-17 | 1.93e-15 | 168 |
| GO:001648210 | Esophagus | ESCC | cytosolic transport | 124/8552 | 168/18723 | 9.69e-14 | 4.69e-12 | 124 |
| GO:00421477 | Esophagus | ESCC | retrograde transport, endosome to Golgi | 63/8552 | 91/18723 | 4.58e-06 | 4.87e-05 | 63 |
| GO:004308715 | Esophagus | ESCC | regulation of GTPase activity | 183/8552 | 348/18723 | 5.34e-03 | 2.00e-02 | 183 |
| GO:00430875 | Liver | NAFLD | regulation of GTPase activity | 62/1882 | 348/18723 | 5.65e-06 | 2.03e-04 | 62 |
| GO:00164825 | Liver | NAFLD | cytosolic transport | 34/1882 | 168/18723 | 5.52e-05 | 1.25e-03 | 34 |
| Hugo Symbol | Variant Class | Variant Classification | dbSNP RS | HGVSc | HGVSp | HGVSp Short | SWISSPROT | BIOTYPE | SIFT | PolyPhen | Tumor Sample Barcode | Tissue | Histology | Sex | Age | Stage | Therapy Types | Drugs | Outcome |
| EVI5 | SNV | Missense_Mutation | | c.663N>G | p.Ser221Arg | p.S221R | O60447 | protein_coding | tolerated(0.06) | probably_damaging(0.962) | TCGA-A8-A092-01 | Breast | breast invasive carcinoma | Female | <65 | III/IV | Chemotherapy | paclitaxel | CR |
| EVI5 | SNV | Missense_Mutation | novel | c.1155N>A | p.His385Gln | p.H385Q | O60447 | protein_coding | tolerated(0.2) | probably_damaging(0.948) | TCGA-AC-A2BK-01 | Breast | breast invasive carcinoma | Female | >=65 | III/IV | Chemotherapy | cytoxan | CR |
| EVI5 | SNV | Missense_Mutation | | c.365C>T | p.Ser122Leu | p.S122L | O60447 | protein_coding | deleterious(0.02) | probably_damaging(0.945) | TCGA-AR-A0TX-01 | Breast | breast invasive carcinoma | Female | <65 | I/II | Unknown | Unknown | SD |
| EVI5 | insertion | Frame_Shift_Ins | novel | c.2416_2417insTGCGTGTCACAGCAACACTCTGTCTCAA | p.Gln806LeufsTer32 | p.Q806Lfs*32 | O60447 | protein_coding | | | TCGA-AC-A8OQ-01 | Breast | breast invasive carcinoma | Female | >=65 | I/II | Unknown | Unknown | SD |
| EVI5 | insertion | Nonsense_Mutation | novel | c.1736_1737insATCCCTGGCCTCTACCCACTAGATGCCAGTAACGGCTCTCCTACCT | p.Ile580SerfsTer7 | p.I580Sfs*7 | O60447 | protein_coding | | | TCGA-AN-A041-01 | Breast | breast invasive carcinoma | Female | <65 | I/II | Unknown | Unknown | SD |
| EVI5 | deletion | Frame_Shift_Del | novel | c.902delA | p.His301LeufsTer25 | p.H301Lfs*25 | O60447 | protein_coding | | | TCGA-D8-A27V-01 | Breast | breast invasive carcinoma | Female | <65 | I/II | Hormone Therapy | tamoxiphen | SD |
| EVI5 | SNV | Missense_Mutation | rs771345036 | c.2003G>A | p.Ser668Asn | p.S668N | O60447 | protein_coding | tolerated(0.27) | benign(0.018) | TCGA-2W-A8YY-01 | Cervix | cervical & endocervical cancer | Female | <65 | I/II | Chemotherapy | cisplatin | CR |
| EVI5 | SNV | Missense_Mutation | novel | c.1425G>T | p.Glu475Asp | p.E475D | O60447 | protein_coding | deleterious(0.03) | possibly_damaging(0.669) | TCGA-2W-A8YY-01 | Cervix | cervical & endocervical cancer | Female | <65 | I/II | Chemotherapy | cisplatin | CR |
| EVI5 | SNV | Missense_Mutation | novel | c.675G>T | p.Glu225Asp | p.E225D | O60447 | protein_coding | deleterious(0) | probably_damaging(0.999) | TCGA-2W-A8YY-01 | Cervix | cervical & endocervical cancer | Female | <65 | I/II | Chemotherapy | cisplatin | CR |
| EVI5 | SNV | Missense_Mutation | | c.2441G>C | p.Arg814Thr | p.R814T | O60447 | protein_coding | tolerated_low_confidence(0.6) | benign(0.017) | TCGA-EK-A2IP-01 | Cervix | cervical & endocervical cancer | Female | <65 | I/II | Unknown | Unknown | SD |


