
|
|||||
|
 | |
| |
| |
| |
| |
| |
|
Gene: ESRP2 |
Gene summary for ESRP2 |
| Gene information | Species | Human | Gene symbol | ESRP2 | Gene ID | 80004 |
| Gene name | epithelial splicing regulatory protein 2 | |
| Gene Alias | RBM35B | |
| Cytomap | 16q22.1 | |
| Gene Type | protein-coding | GO ID | GO:0000375 | UniProtAcc | Q9H6T0 |
Top |
Malignant transformation analysis |
| Identification of the aberrant gene expression in precancerous and cancerous lesions by comparing the gene expression of stem-like cells in diseased tissues with normal stem cells |
| Entrez ID | Symbol | Replicates | Species | Organ | Tissue | Adj P-value | Log2FC | Malignancy |
| 80004 | ESRP2 | LZE4T | Human | Esophagus | ESCC | 1.04e-04 | 2.15e-01 | 0.0811 |
| 80004 | ESRP2 | LZE7T | Human | Esophagus | ESCC | 4.75e-03 | 1.86e-01 | 0.0667 |
| 80004 | ESRP2 | LZE24T | Human | Esophagus | ESCC | 9.81e-13 | 3.63e-01 | 0.0596 |
| 80004 | ESRP2 | P1T-E | Human | Esophagus | ESCC | 7.12e-12 | 4.80e-01 | 0.0875 |
| 80004 | ESRP2 | P2T-E | Human | Esophagus | ESCC | 8.15e-05 | 1.01e-01 | 0.1177 |
| 80004 | ESRP2 | P4T-E | Human | Esophagus | ESCC | 1.13e-08 | 2.33e-01 | 0.1323 |
| 80004 | ESRP2 | P5T-E | Human | Esophagus | ESCC | 2.90e-07 | 1.33e-01 | 0.1327 |
| 80004 | ESRP2 | P8T-E | Human | Esophagus | ESCC | 8.09e-30 | 5.78e-01 | 0.0889 |
| 80004 | ESRP2 | P10T-E | Human | Esophagus | ESCC | 1.72e-02 | 1.68e-02 | 0.116 |
| 80004 | ESRP2 | P12T-E | Human | Esophagus | ESCC | 4.15e-15 | 2.67e-01 | 0.1122 |
| 80004 | ESRP2 | P15T-E | Human | Esophagus | ESCC | 3.57e-05 | 1.57e-01 | 0.1149 |
| 80004 | ESRP2 | P16T-E | Human | Esophagus | ESCC | 4.26e-03 | 1.94e-02 | 0.1153 |
| 80004 | ESRP2 | P20T-E | Human | Esophagus | ESCC | 5.24e-13 | 3.28e-01 | 0.1124 |
| 80004 | ESRP2 | P21T-E | Human | Esophagus | ESCC | 4.04e-02 | 1.37e-01 | 0.1617 |
| 80004 | ESRP2 | P22T-E | Human | Esophagus | ESCC | 1.80e-07 | 1.36e-01 | 0.1236 |
| 80004 | ESRP2 | P23T-E | Human | Esophagus | ESCC | 2.09e-25 | 6.37e-01 | 0.108 |
| 80004 | ESRP2 | P24T-E | Human | Esophagus | ESCC | 4.60e-06 | 1.46e-01 | 0.1287 |
| 80004 | ESRP2 | P26T-E | Human | Esophagus | ESCC | 1.99e-14 | 3.88e-01 | 0.1276 |
| 80004 | ESRP2 | P27T-E | Human | Esophagus | ESCC | 6.42e-09 | 2.36e-01 | 0.1055 |
| 80004 | ESRP2 | P28T-E | Human | Esophagus | ESCC | 2.20e-22 | 4.38e-01 | 0.1149 |
| Page: 1 2 3 |
| Tissue | Expression Dynamics | Abbreviation |
| Esophagus | 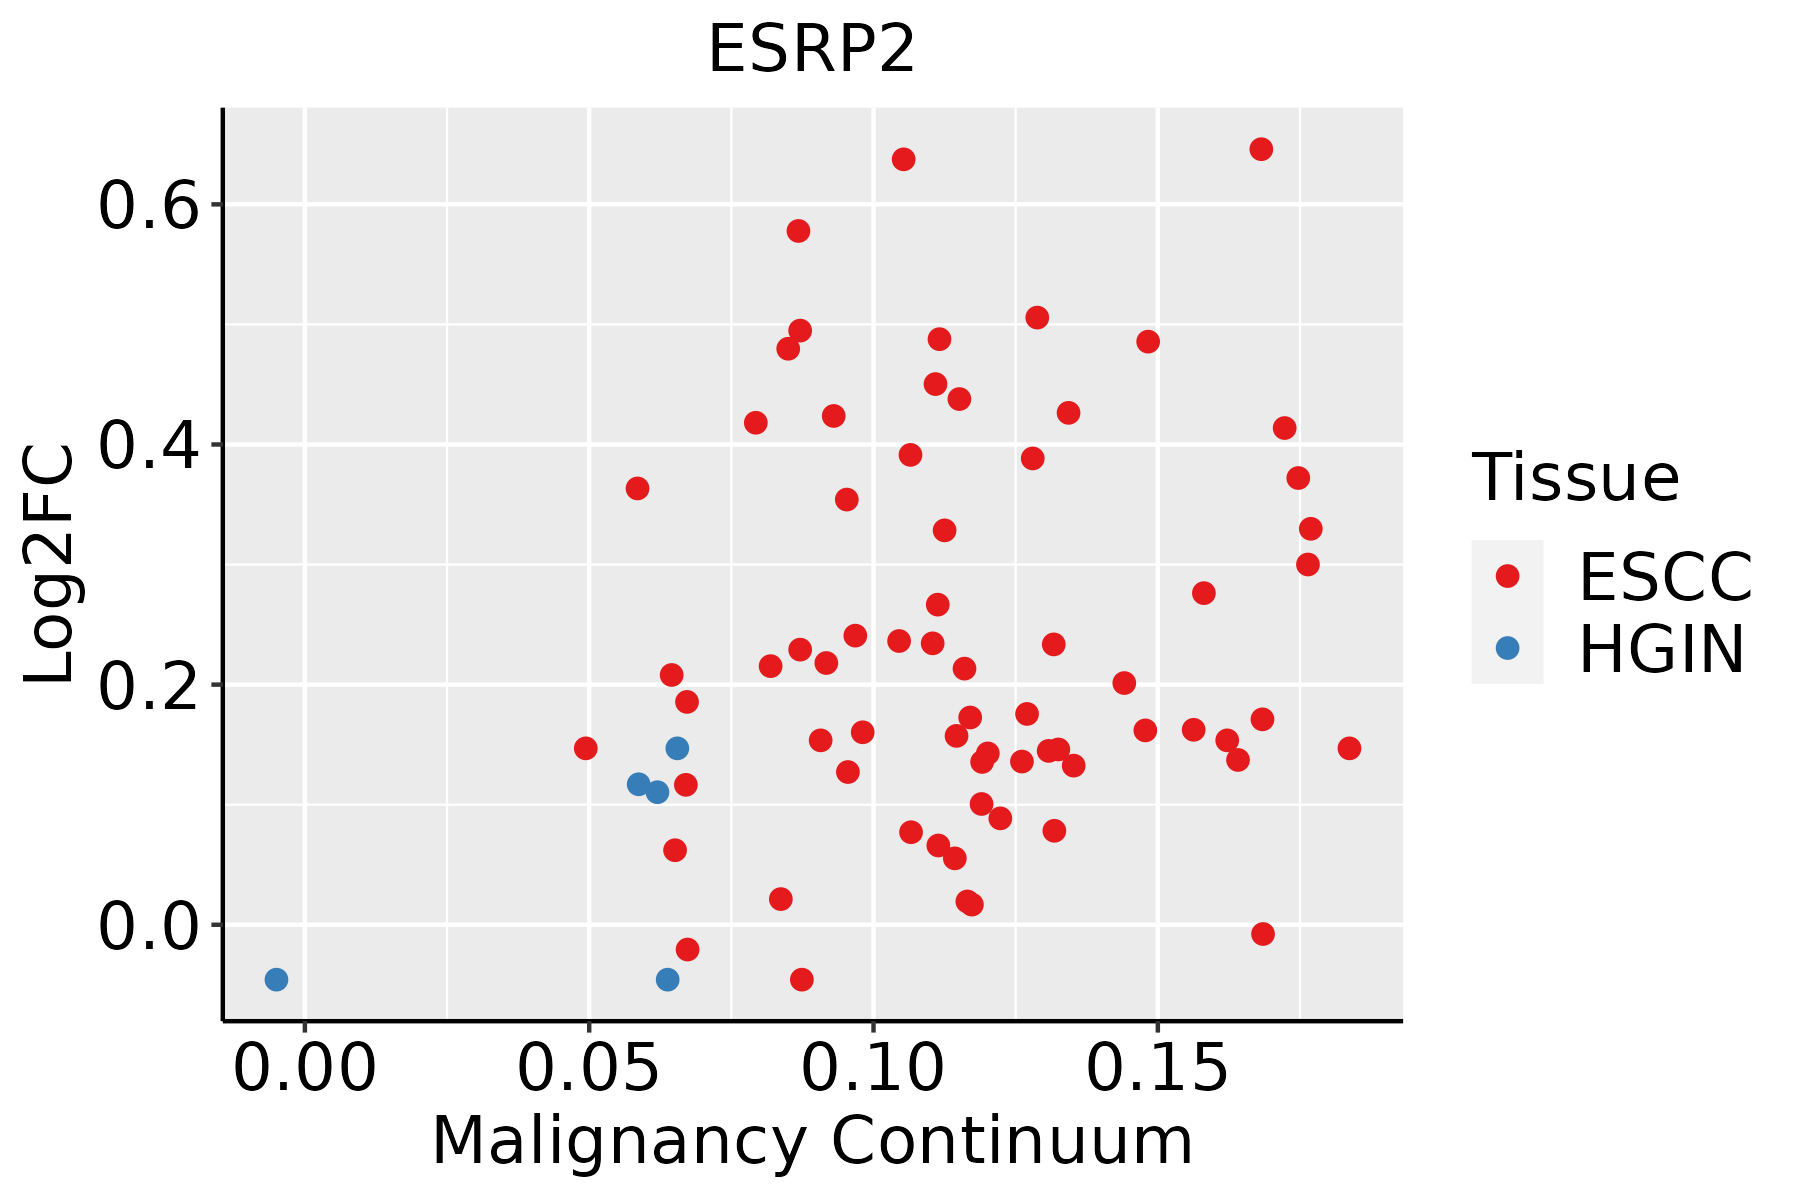 | ESCC: Esophageal squamous cell carcinoma |
| HGIN: High-grade intraepithelial neoplasias | ||
| LGIN: Low-grade intraepithelial neoplasias | ||
| Liver | 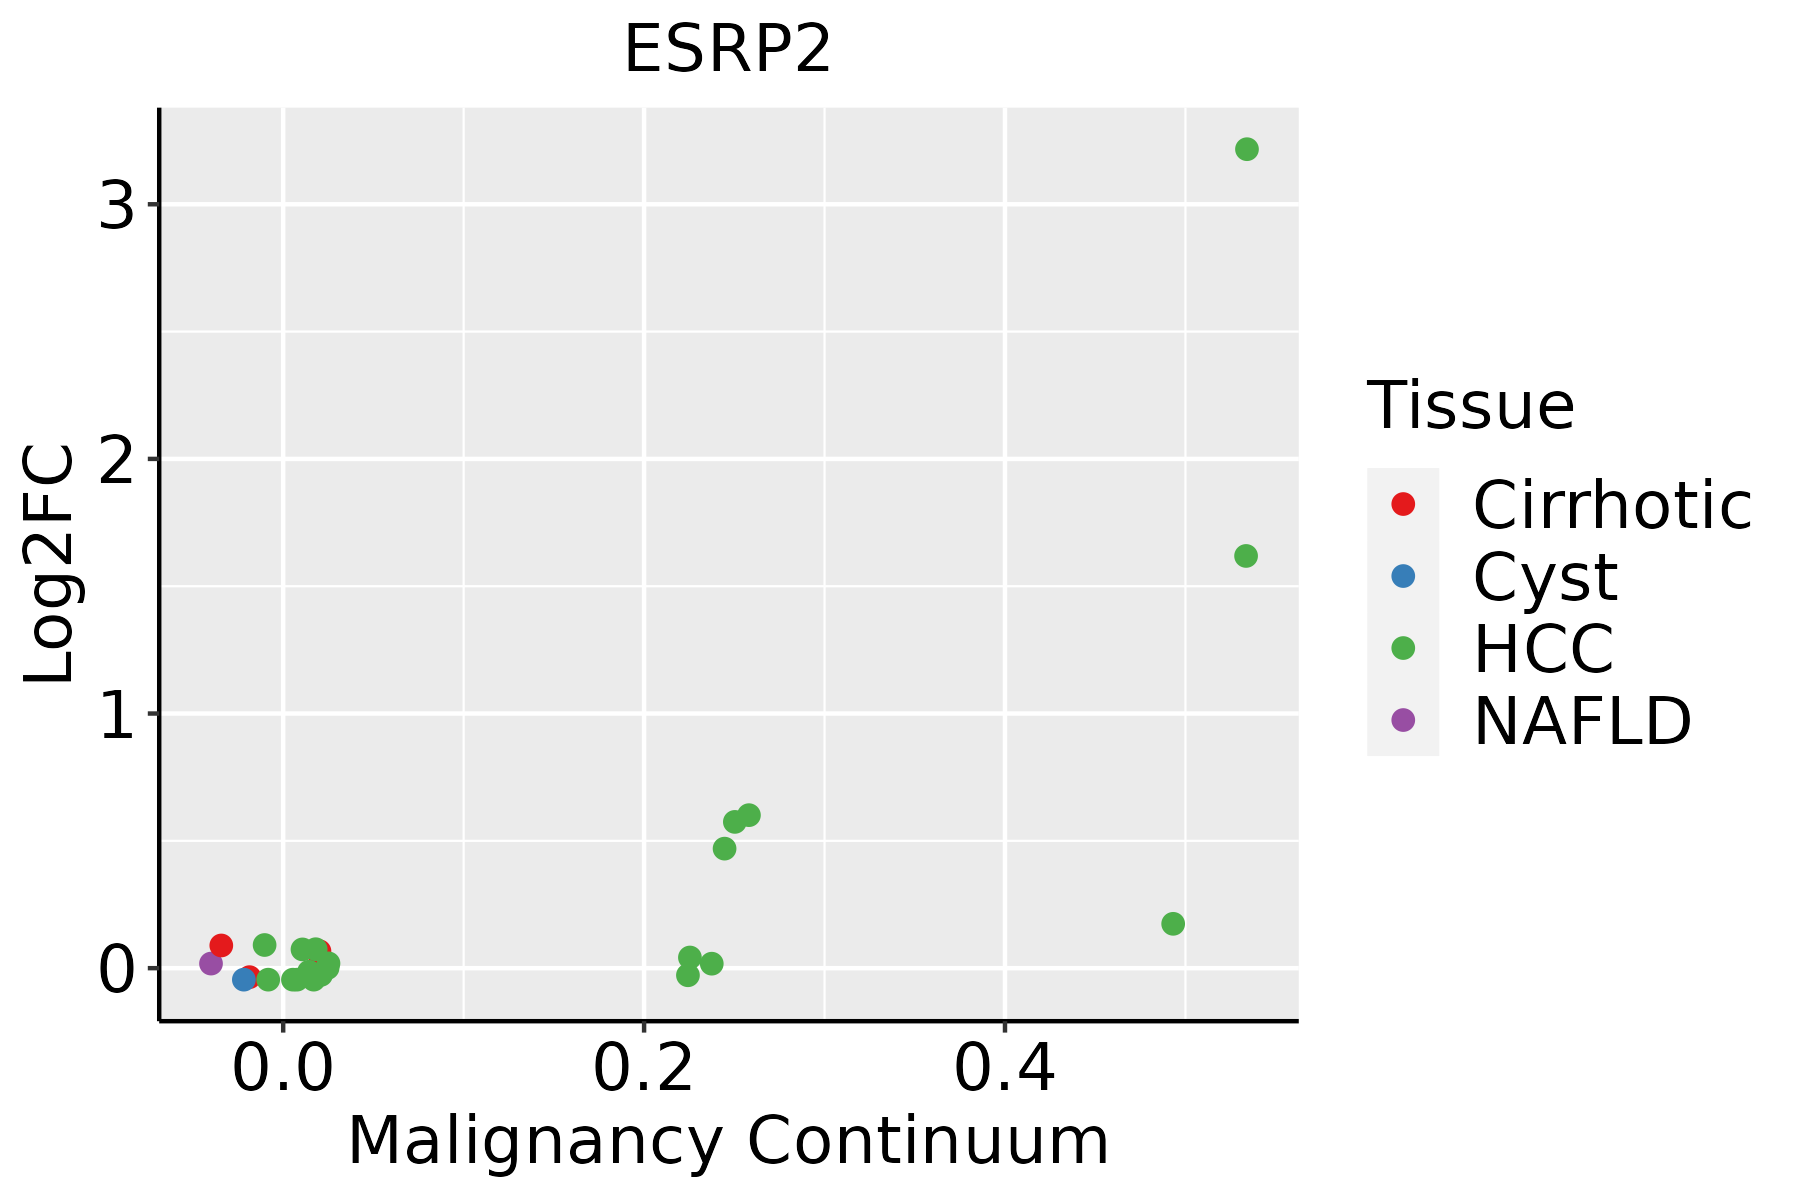 | HCC: Hepatocellular carcinoma |
| NAFLD: Non-alcoholic fatty liver disease |
| ∗log2FC in expression of this searched gene in stem-like cells from each diseased tissue sample relative to stem-like cells in normal samples in each tissue plotted against the malignancy continuum. Samples are colored based on if they are from different disease stage. |
Top |
Malignant transformation related pathway analysis |
| Find out the enriched GO biological processes and KEGG pathways involved in transition from healthy to precancer to cancer |
| Tissue | Disease Stage | Enriched GO biological Processes |
| Colorectum | AD |  |
| Colorectum | SER |  |
| Colorectum | MSS |  |
| Colorectum | MSI-H |  |
| Colorectum | FAP |  |
| ∗Top 15 enriched GO BP terms are showed in the bar plot of each disease state in each tissue. Each row represents a significant GO biological process which is colored according to the -log10(p.adjust). |
| Page: 1 2 3 4 5 6 7 8 9 |
| GO ID | Tissue | Disease Stage | Description | Gene Ratio | Bg Ratio | pvalue | p.adjust | Count |
| GO:000039822 | Liver | HCC | mRNA splicing, via spliceosome | 224/7958 | 320/18723 | 1.16e-23 | 2.62e-21 | 224 |
| GO:004348422 | Liver | HCC | regulation of RNA splicing | 113/7958 | 148/18723 | 4.32e-17 | 4.15e-15 | 113 |
| GO:004873222 | Liver | HCC | gland development | 242/7958 | 436/18723 | 2.26e-08 | 5.28e-07 | 242 |
| GO:000038021 | Liver | HCC | alternative mRNA splicing, via spliceosome | 52/7958 | 77/18723 | 7.87e-06 | 9.27e-05 | 52 |
| GO:003032311 | Liver | HCC | respiratory tube development | 95/7958 | 181/18723 | 4.15e-03 | 1.81e-02 | 95 |
| GO:003032411 | Liver | HCC | lung development | 91/7958 | 177/18723 | 1.01e-02 | 3.80e-02 | 91 |
| Page: 1 2 |
| Pathway ID | Tissue | Disease Stage | Description | Gene Ratio | Bg Ratio | pvalue | p.adjust | qvalue | Count |
| Page: 1 |
Top |
Cell-cell communication analysis |
| Identification of potential cell-cell interactions between two cell types and their ligand-receptor pairs for different disease states |
| Ligand | Receptor | LRpair | Pathway | Tissue | Disease Stage |
| Page: 1 |
Top |
Single-cell gene regulatory network inference analysis |
| Find out the significant the regulons (TFs) and the target genes of each regulon across cell types for different disease states |
| TF | Cell Type | Tissue | Disease Stage | Target Gene | RSS | Regulon Activity |
| ∗The dot plots of a searched regulon are shown for all cell subpopulations in each disease state of each tissue based on the regulon specific score inferred using pySCENIC and by calculating the average expression. |
| Page: 1 |
Top |
Somatic mutation of malignant transformation related genes |
| Annotation of somatic variants for genes involved in malignant transformation |
| Hugo Symbol | Variant Class | Variant Classification | dbSNP RS | HGVSc | HGVSp | HGVSp Short | SWISSPROT | BIOTYPE | SIFT | PolyPhen | Tumor Sample Barcode | Tissue | Histology | Sex | Age | Stage | Therapy Types | Drugs | Outcome |
| ESRP2 | SNV | Missense_Mutation | c.1305N>C | p.Leu435Phe | p.L435F | Q9H6T0 | protein_coding | deleterious(0) | probably_damaging(0.979) | TCGA-A1-A0SI-01 | Breast | breast invasive carcinoma | Female | <65 | I/II | Unknown | Unknown | SD | |
| ESRP2 | SNV | Missense_Mutation | c.833C>A | p.Ala278Glu | p.A278E | Q9H6T0 | protein_coding | deleterious(0) | probably_damaging(0.98) | TCGA-AN-A0FN-01 | Breast | breast invasive carcinoma | Female | <65 | I/II | Unknown | Unknown | SD | |
| ESRP2 | SNV | Missense_Mutation | c.1379N>A | p.Pro460His | p.P460H | Q9H6T0 | protein_coding | deleterious(0.04) | possibly_damaging(0.482) | TCGA-AO-A128-01 | Breast | breast invasive carcinoma | Female | <65 | I/II | Chemotherapy | doxorubicin | SD | |
| ESRP2 | SNV | Missense_Mutation | c.1678A>G | p.Ser560Gly | p.S560G | Q9H6T0 | protein_coding | tolerated(0.13) | benign(0.03) | TCGA-BH-A18G-01 | Breast | breast invasive carcinoma | Female | >=65 | I/II | Unknown | Unknown | SD | |
| ESRP2 | SNV | Missense_Mutation | rs372908528 | c.1477N>T | p.Arg493Trp | p.R493W | Q9H6T0 | protein_coding | deleterious(0.03) | possibly_damaging(0.761) | TCGA-C8-A1HG-01 | Breast | breast invasive carcinoma | Female | <65 | I/II | Unknown | Unknown | SD |
| ESRP2 | SNV | Missense_Mutation | novel | c.1361T>G | p.Ile454Ser | p.I454S | Q9H6T0 | protein_coding | tolerated(0.11) | benign(0.052) | TCGA-LL-A740-01 | Breast | breast invasive carcinoma | Female | <65 | I/II | Chemotherapy | adriamycin | CR |
| ESRP2 | deletion | Frame_Shift_Del | novel | c.2018delA | p.Tyr673SerfsTer5 | p.Y673Sfs*5 | Q9H6T0 | protein_coding | TCGA-EW-A2FV-01 | Breast | breast invasive carcinoma | Female | <65 | III/IV | Chemotherapy | docetaxel | SD | ||
| ESRP2 | SNV | Missense_Mutation | c.1273N>T | p.Arg425Trp | p.R425W | Q9H6T0 | protein_coding | deleterious(0) | probably_damaging(0.996) | TCGA-EA-A5O9-01 | Cervix | cervical & endocervical cancer | Female | <65 | I/II | Unknown | Unknown | SD | |
| ESRP2 | SNV | Missense_Mutation | c.1676G>A | p.Arg559His | p.R559H | Q9H6T0 | protein_coding | tolerated(0.08) | benign(0.36) | TCGA-EK-A2RK-01 | Cervix | cervical & endocervical cancer | Female | >=65 | I/II | Unknown | Unknown | SD | |
| ESRP2 | SNV | Missense_Mutation | rs569178519 | c.2113N>T | p.Arg705Cys | p.R705C | Q9H6T0 | protein_coding | deleterious_low_confidence(0) | probably_damaging(0.984) | TCGA-AA-3815-01 | Colorectum | colon adenocarcinoma | Female | >=65 | I/II | Unknown | Unknown | SD |
| Page: 1 2 3 4 5 6 |
Top |
Related drugs of malignant transformation related genes |
| Identification of chemicals and drugs interact with genes involved in malignant transfromation |
| (DGIdb 4.0) |
| Entrez ID | Symbol | Category | Interaction Types | Drug Claim Name | Drug Name | PMIDs |
| Page: 1 |

Copyright 2023-Present -The University of Texas Health Science Center at Houston |