
|
|||||
|
 | |
| |
| |
| |
| |
| |
|
Gene: EPB41 |
Gene summary for EPB41 |
| Gene information | Species | Human | Gene symbol | EPB41 | Gene ID | 2035 |
| Gene name | erythrocyte membrane protein band 4.1 | |
| Gene Alias | 4.1R | |
| Cytomap | 1p35.3 | |
| Gene Type | protein-coding | GO ID | GO:0000902 | UniProtAcc | P11171 |
Top |
Malignant transformation analysis |
| Identification of the aberrant gene expression in precancerous and cancerous lesions by comparing the gene expression of stem-like cells in diseased tissues with normal stem cells |
| Entrez ID | Symbol | Replicates | Species | Organ | Tissue | Adj P-value | Log2FC | Malignancy |
| 2035 | EPB41 | CCI_1 | Human | Cervix | CC | 6.89e-07 | 7.71e-01 | 0.528 |
| 2035 | EPB41 | CCI_2 | Human | Cervix | CC | 2.53e-02 | 5.81e-01 | 0.5249 |
| 2035 | EPB41 | CCI_3 | Human | Cervix | CC | 3.01e-08 | 7.06e-01 | 0.516 |
| 2035 | EPB41 | HTA11_3410_2000001011 | Human | Colorectum | AD | 3.98e-13 | -5.53e-01 | 0.0155 |
| 2035 | EPB41 | HTA11_347_2000001011 | Human | Colorectum | AD | 1.05e-02 | 3.71e-01 | -0.1954 |
| 2035 | EPB41 | HTA11_9408_2000001011 | Human | Colorectum | AD | 5.05e-03 | -3.42e-01 | 0.0451 |
| 2035 | EPB41 | HTA11_99999965062_69753 | Human | Colorectum | MSI-H | 2.66e-02 | 7.23e-01 | 0.3487 |
| 2035 | EPB41 | HTA11_99999974143_84620 | Human | Colorectum | MSS | 2.80e-02 | -2.03e-01 | 0.3005 |
| 2035 | EPB41 | F007 | Human | Colorectum | FAP | 7.07e-04 | -5.02e-01 | 0.1176 |
| 2035 | EPB41 | A002-C-010 | Human | Colorectum | FAP | 1.20e-04 | -3.53e-01 | 0.242 |
| 2035 | EPB41 | A001-C-207 | Human | Colorectum | FAP | 8.23e-04 | -4.23e-01 | 0.1278 |
| 2035 | EPB41 | A015-C-203 | Human | Colorectum | FAP | 6.10e-39 | -4.26e-01 | -0.1294 |
| 2035 | EPB41 | A015-C-204 | Human | Colorectum | FAP | 3.07e-05 | -2.82e-01 | -0.0228 |
| 2035 | EPB41 | A014-C-040 | Human | Colorectum | FAP | 2.84e-09 | -7.47e-01 | -0.1184 |
| 2035 | EPB41 | A002-C-201 | Human | Colorectum | FAP | 6.18e-23 | -6.21e-01 | 0.0324 |
| 2035 | EPB41 | A002-C-203 | Human | Colorectum | FAP | 8.52e-18 | -4.23e-01 | 0.2786 |
| 2035 | EPB41 | A001-C-119 | Human | Colorectum | FAP | 6.99e-07 | -2.48e-01 | -0.1557 |
| 2035 | EPB41 | A001-C-108 | Human | Colorectum | FAP | 6.79e-29 | -3.54e-01 | -0.0272 |
| 2035 | EPB41 | A002-C-205 | Human | Colorectum | FAP | 1.60e-24 | -4.78e-01 | -0.1236 |
| 2035 | EPB41 | A001-C-104 | Human | Colorectum | FAP | 3.05e-08 | -2.77e-01 | 0.0184 |
| Page: 1 2 3 4 5 |
| Tissue | Expression Dynamics | Abbreviation |
| Cervix |  | CC: Cervix cancer |
| HSIL_HPV: HPV-infected high-grade squamous intraepithelial lesions | ||
| N_HPV: HPV-infected normal cervix | ||
| Colorectum (GSE201348) | 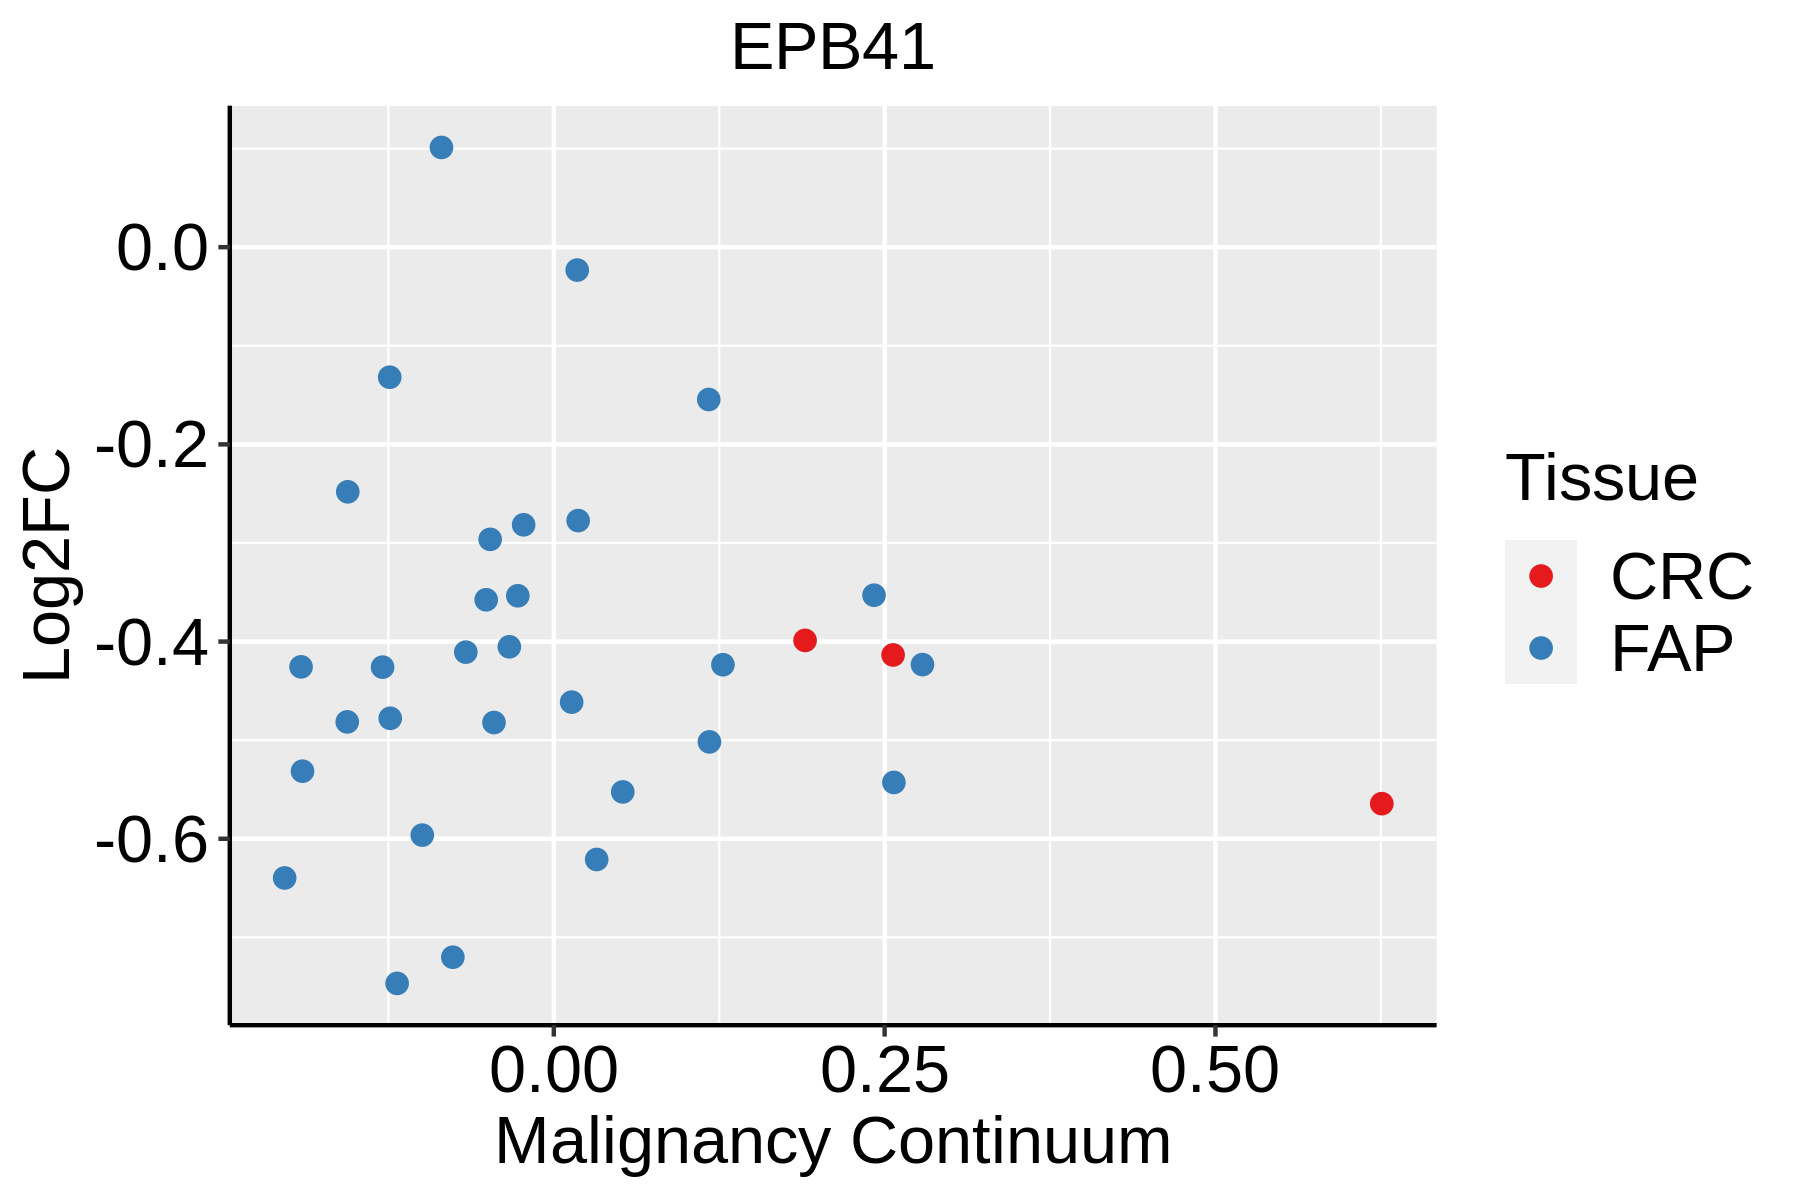 | FAP: Familial adenomatous polyposis |
| CRC: Colorectal cancer | ||
| Colorectum (HTA11) |  | AD: Adenomas |
| SER: Sessile serrated lesions | ||
| MSI-H: Microsatellite-high colorectal cancer | ||
| MSS: Microsatellite stable colorectal cancer | ||
| Endometrium | 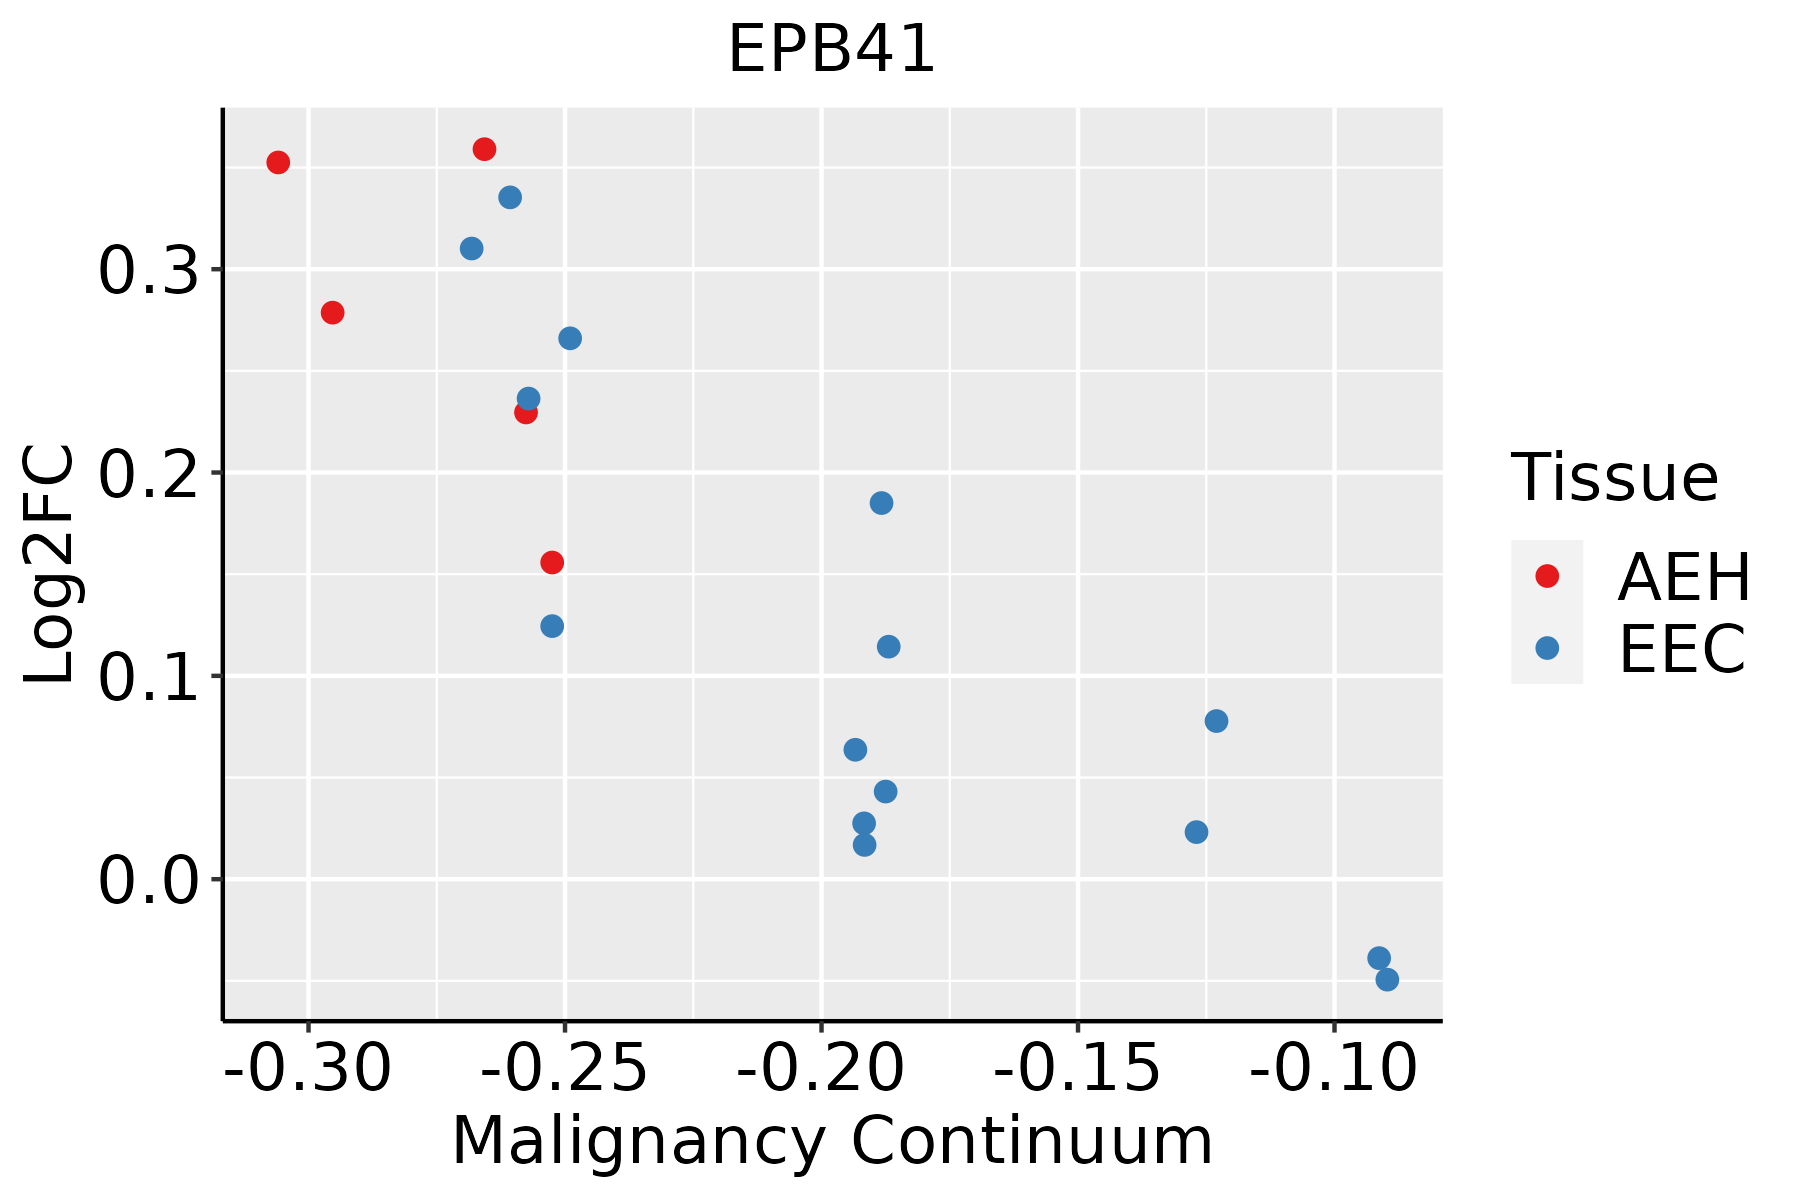 | AEH: Atypical endometrial hyperplasia |
| EEC: Endometrioid Cancer | ||
| Liver |  | HCC: Hepatocellular carcinoma |
| NAFLD: Non-alcoholic fatty liver disease | ||
| Lung | 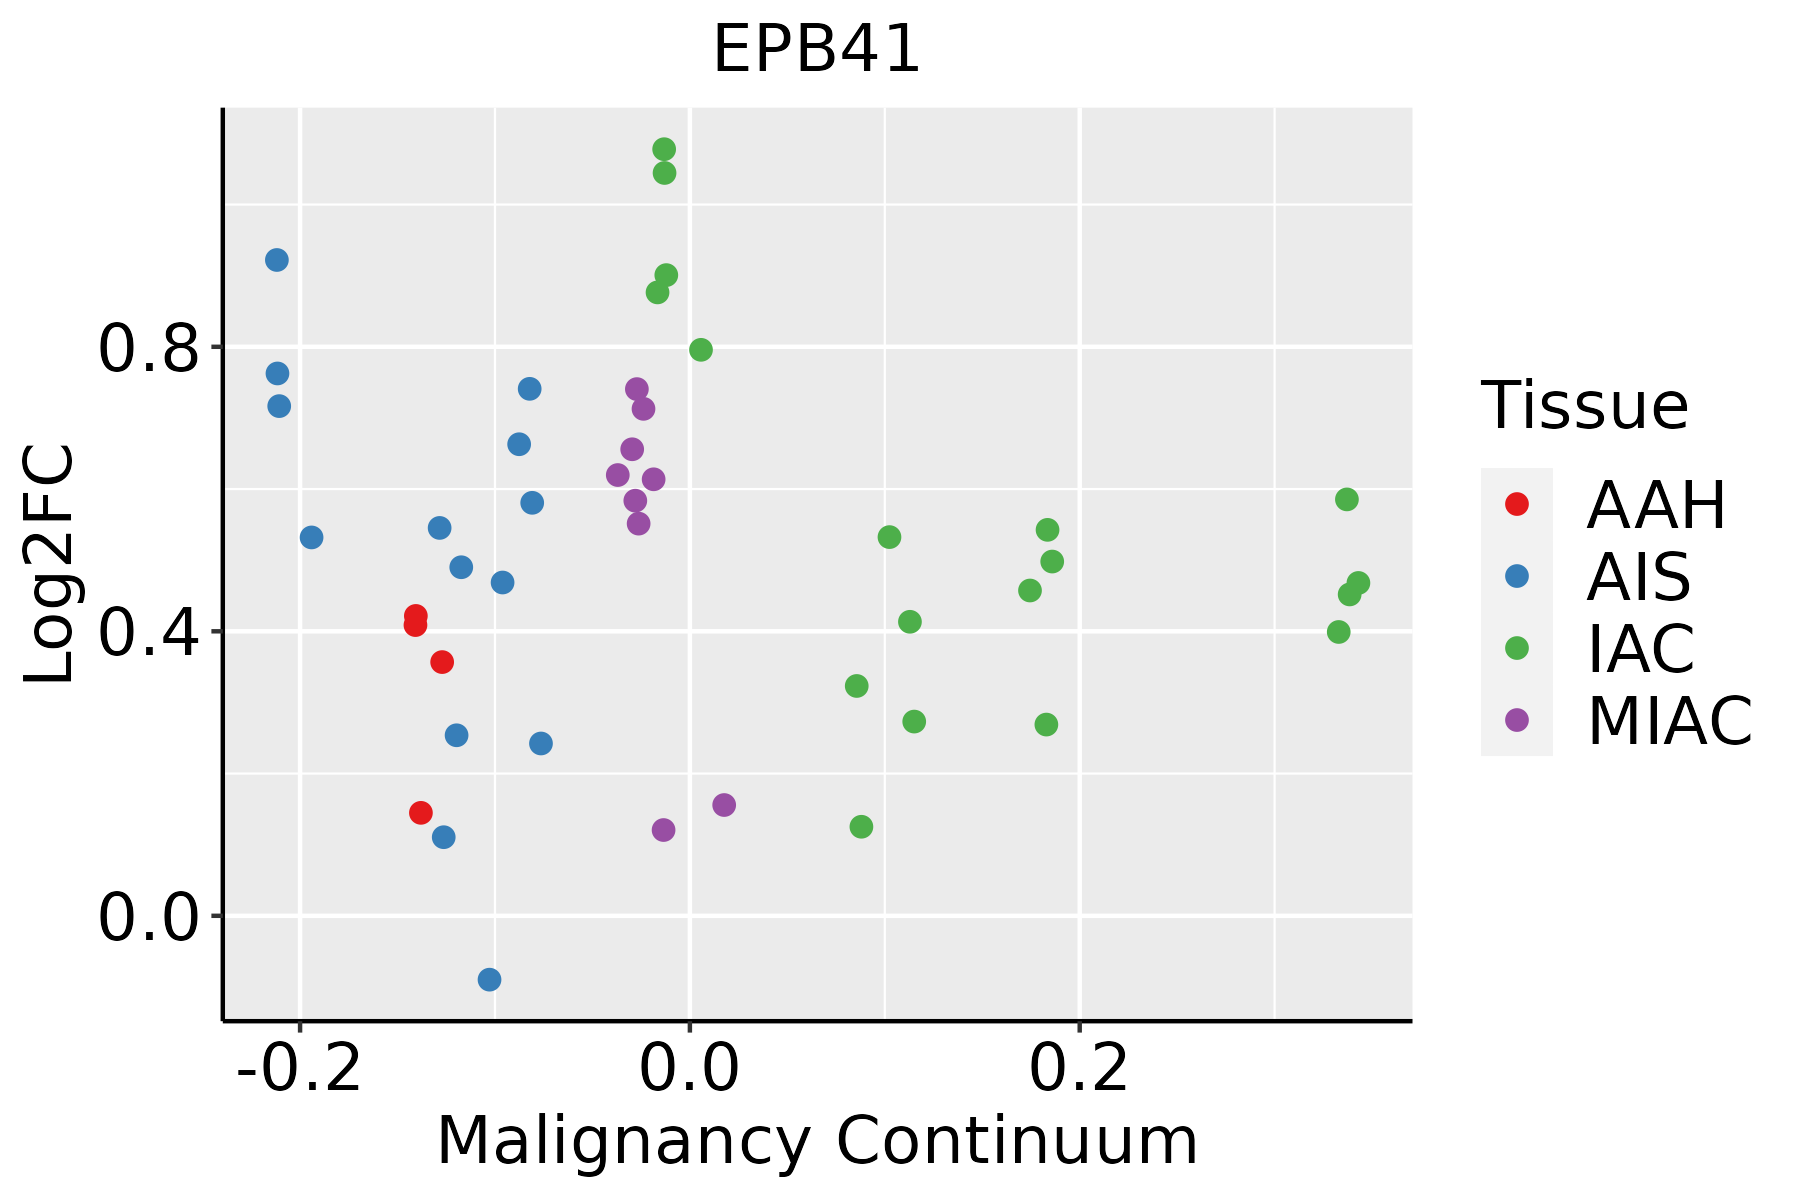 | AAH: Atypical adenomatous hyperplasia |
| AIS: Adenocarcinoma in situ | ||
| IAC: Invasive lung adenocarcinoma | ||
| MIA: Minimally invasive adenocarcinoma | ||
| Thyroid |  | ATC: Anaplastic thyroid cancer |
| HT: Hashimoto's thyroiditis | ||
| PTC: Papillary thyroid cancer |
| ∗log2FC in expression of this searched gene in stem-like cells from each diseased tissue sample relative to stem-like cells in normal samples in each tissue plotted against the malignancy continuum. Samples are colored based on if they are from different disease stage. |
Top |
Malignant transformation related pathway analysis |
| Find out the enriched GO biological processes and KEGG pathways involved in transition from healthy to precancer to cancer |
| Tissue | Disease Stage | Enriched GO biological Processes |
| Colorectum | AD |  |
| Colorectum | SER |  |
| Colorectum | MSS |  |
| Colorectum | MSI-H |  |
| Colorectum | FAP |  |
| ∗Top 15 enriched GO BP terms are showed in the bar plot of each disease state in each tissue. Each row represents a significant GO biological process which is colored according to the -log10(p.adjust). |
| Page: 1 2 3 4 5 6 7 8 9 |
| GO ID | Tissue | Disease Stage | Description | Gene Ratio | Bg Ratio | pvalue | p.adjust | Count |
| GO:01501169 | Cervix | CC | regulation of cell-substrate junction organization | 25/2311 | 71/18723 | 5.58e-07 | 2.06e-05 | 25 |
| GO:00480417 | Cervix | CC | focal adhesion assembly | 28/2311 | 87/18723 | 9.86e-07 | 3.45e-05 | 28 |
| GO:19043779 | Cervix | CC | positive regulation of protein localization to cell periphery | 24/2311 | 69/18723 | 1.21e-06 | 4.15e-05 | 24 |
| GO:00224084 | Cervix | CC | negative regulation of cell-cell adhesion | 48/2311 | 196/18723 | 1.99e-06 | 6.18e-05 | 48 |
| GO:001081110 | Cervix | CC | positive regulation of cell-substrate adhesion | 34/2311 | 123/18723 | 3.66e-06 | 9.68e-05 | 34 |
| GO:00518938 | Cervix | CC | regulation of focal adhesion assembly | 22/2311 | 66/18723 | 7.37e-06 | 1.73e-04 | 22 |
| GO:00901098 | Cervix | CC | regulation of cell-substrate junction assembly | 22/2311 | 66/18723 | 7.37e-06 | 1.73e-04 | 22 |
| GO:005109910 | Cervix | CC | positive regulation of binding | 42/2311 | 173/18723 | 1.07e-05 | 2.33e-04 | 42 |
| GO:00160498 | Cervix | CC | cell growth | 92/2311 | 482/18723 | 1.16e-05 | 2.49e-04 | 92 |
| GO:00083608 | Cervix | CC | regulation of cell shape | 38/2311 | 154/18723 | 1.86e-05 | 3.46e-04 | 38 |
| GO:00073695 | Cervix | CC | gastrulation | 42/2311 | 185/18723 | 5.83e-05 | 8.46e-04 | 42 |
| GO:00017018 | Cervix | CC | in utero embryonic development | 71/2311 | 367/18723 | 7.21e-05 | 1.00e-03 | 71 |
| GO:00308657 | Cervix | CC | cortical cytoskeleton organization | 19/2311 | 61/18723 | 8.72e-05 | 1.16e-03 | 19 |
| GO:00310329 | Cervix | CC | actomyosin structure organization | 43/2311 | 196/18723 | 1.11e-04 | 1.40e-03 | 43 |
| GO:00433939 | Cervix | CC | regulation of protein binding | 42/2311 | 196/18723 | 2.27e-04 | 2.55e-03 | 42 |
| GO:19043758 | Cervix | CC | regulation of protein localization to cell periphery | 30/2311 | 125/18723 | 2.28e-04 | 2.56e-03 | 30 |
| GO:000206410 | Cervix | CC | epithelial cell development | 45/2311 | 220/18723 | 4.14e-04 | 4.21e-03 | 45 |
| GO:19018886 | Cervix | CC | regulation of cell junction assembly | 42/2311 | 204/18723 | 5.50e-04 | 5.29e-03 | 42 |
| GO:00715595 | Cervix | CC | response to transforming growth factor beta | 50/2311 | 256/18723 | 6.31e-04 | 5.91e-03 | 50 |
| GO:00715605 | Cervix | CC | cellular response to transforming growth factor beta stimulus | 49/2311 | 250/18723 | 6.55e-04 | 6.05e-03 | 49 |
| Page: 1 2 3 4 5 6 7 8 9 10 11 12 13 14 15 16 17 18 19 20 21 22 23 24 25 26 27 28 29 30 31 32 33 34 35 36 37 38 39 40 41 |
| Pathway ID | Tissue | Disease Stage | Description | Gene Ratio | Bg Ratio | pvalue | p.adjust | qvalue | Count |
| Page: 1 |
Top |
Cell-cell communication analysis |
| Identification of potential cell-cell interactions between two cell types and their ligand-receptor pairs for different disease states |
| Ligand | Receptor | LRpair | Pathway | Tissue | Disease Stage |
| Page: 1 |
Top |
Single-cell gene regulatory network inference analysis |
| Find out the significant the regulons (TFs) and the target genes of each regulon across cell types for different disease states |
| TF | Cell Type | Tissue | Disease Stage | Target Gene | RSS | Regulon Activity |
| ∗The dot plots of a searched regulon are shown for all cell subpopulations in each disease state of each tissue based on the regulon specific score inferred using pySCENIC and by calculating the average expression. |
| Page: 1 |
Top |
Somatic mutation of malignant transformation related genes |
| Annotation of somatic variants for genes involved in malignant transformation |
| Hugo Symbol | Variant Class | Variant Classification | dbSNP RS | HGVSc | HGVSp | HGVSp Short | SWISSPROT | BIOTYPE | SIFT | PolyPhen | Tumor Sample Barcode | Tissue | Histology | Sex | Age | Stage | Therapy Types | Drugs | Outcome |
| EPB41 | SNV | Missense_Mutation | rs202197419 | c.1070N>G | p.Pro357Arg | p.P357R | P11171 | protein_coding | deleterious(0) | probably_damaging(0.999) | TCGA-A2-A04W-01 | Breast | breast invasive carcinoma | Female | <65 | I/II | Chemotherapy | cytoxan | SD |
| EPB41 | SNV | Missense_Mutation | c.1412G>A | p.Arg471Gln | p.R471Q | P11171 | protein_coding | deleterious(0) | probably_damaging(0.948) | TCGA-AN-A046-01 | Breast | breast invasive carcinoma | Female | >=65 | I/II | Unknown | Unknown | SD | |
| EPB41 | SNV | Missense_Mutation | c.223N>C | p.Glu75Gln | p.E75Q | P11171 | protein_coding | tolerated(0.06) | benign(0.077) | TCGA-EW-A1J5-01 | Breast | breast invasive carcinoma | Female | <65 | I/II | Chemotherapy | adriamycin | SD | |
| EPB41 | SNV | Missense_Mutation | c.118N>G | p.Gln40Glu | p.Q40E | P11171 | protein_coding | tolerated_low_confidence(0.34) | benign(0.013) | TCGA-GM-A2D9-01 | Breast | breast invasive carcinoma | Female | >=65 | I/II | Hormone Therapy | arimidex | SD | |
| EPB41 | deletion | Frame_Shift_Del | c.1056delN | p.Phe353LeufsTer25 | p.F353Lfs*25 | P11171 | protein_coding | TCGA-B6-A1KI-01 | Breast | breast invasive carcinoma | Female | <65 | I/II | Unknown | Unknown | SD | |||
| EPB41 | SNV | Missense_Mutation | novel | c.1597C>T | p.Arg533Cys | p.R533C | P11171 | protein_coding | deleterious(0) | probably_damaging(1) | TCGA-2W-A8YY-01 | Cervix | cervical & endocervical cancer | Female | <65 | I/II | Chemotherapy | cisplatin | CR |
| EPB41 | SNV | Missense_Mutation | c.868N>G | p.Pro290Ala | p.P290A | P11171 | protein_coding | deleterious(0) | probably_damaging(0.996) | TCGA-DR-A0ZM-01 | Cervix | cervical & endocervical cancer | Female | <65 | III/IV | Unspecific | Cisplatin | SD | |
| EPB41 | SNV | Missense_Mutation | novel | c.1828C>A | p.Pro610Thr | p.P610T | P11171 | protein_coding | deleterious(0.03) | benign(0.001) | TCGA-DS-A1OC-01 | Cervix | cervical & endocervical cancer | Female | <65 | I/II | Chemotherapy | gemcitabine | SD |
| EPB41 | SNV | Missense_Mutation | c.1402N>G | p.Pro468Ala | p.P468A | P11171 | protein_coding | deleterious(0.01) | possibly_damaging(0.453) | TCGA-EK-A2PM-01 | Cervix | cervical & endocervical cancer | Female | >=65 | I/II | Unknown | Unknown | SD | |
| EPB41 | SNV | Missense_Mutation | c.1969N>A | p.Glu657Lys | p.E657K | P11171 | protein_coding | deleterious(0.01) | benign(0.097) | TCGA-LP-A5U2-01 | Cervix | cervical & endocervical cancer | Female | <65 | III/IV | Unknown | Unknown | SD |
| Page: 1 2 3 4 5 6 7 |
Top |
Related drugs of malignant transformation related genes |
| Identification of chemicals and drugs interact with genes involved in malignant transfromation |
| (DGIdb 4.0) |
| Entrez ID | Symbol | Category | Interaction Types | Drug Claim Name | Drug Name | PMIDs |
| 2035 | EPB41 | TRANSPORTER | bupropion | BUPROPION | ||
| 2035 | EPB41 | TRANSPORTER | nicotine | NICOTINE |
| Page: 1 |

Copyright 2023-Present -The University of Texas Health Science Center at Houston |