Schematic overview of the cellular and molecular mechanisms involved in the cancer progression, including the proposed cellular and molecular mechanisms in cancer cells trajectory. AT1: alveolar type 1 cells; AT2: alveolar type 2 cells; AAH: atypical adenomatous hyperplasia; AIS: adenocarcinoma in situ; MIA: minimally invasive adenocarcinoma; IA: invasive adenocarcinoma; EMT: epithelial-mesenchymal transition

Home

Download

Statistics

Help

Contact

Center for Computational Systems Medicine
leaf

Gene summary

leaf

Malignant transformation analysis

leaf

Malignant transformation related pathway analysis

leaf

Cell-cell communication analysis

leaf

Single-cell gene regulatory network inference analysis

leaf

Somatic mutation of malignant transformation related genes

leaf

Related drugs of malignant transformation related genes

Gene: ENOPH1

Gene summary for ENOPH1

check button Gene summary.

Gene informationSpeciesHuman
Gene symbol

ENOPH1

Gene ID

58478

Gene nameenolase-phosphatase 1
Gene AliasE1
Cytomap4q21.22
Gene Typeprotein-coding
GO ID

GO:0000096

UniProtAcc

D6RA00


Top

Malignant transformation analysis

check button Identification of the aberrant gene expression in precancerous and cancerous lesions by comparing the gene expression of stem-like cells in diseased tissues with normal stem cells
check button Malignant transformation involving gene list.
Entrez IDSymbolReplicatesSpeciesOrganTissueAdj P-valueLog2FCMalignancy
58478ENOPH1LZE4THumanEsophagusESCC7.06e-101.66e-010.0811
58478ENOPH1LZE7THumanEsophagusESCC1.22e-096.35e-010.0667
58478ENOPH1LZE24THumanEsophagusESCC1.02e-124.67e-010.0596
58478ENOPH1LZE21THumanEsophagusESCC6.16e-052.77e-010.0655
58478ENOPH1LZE6THumanEsophagusESCC1.32e-026.83e-020.0845
58478ENOPH1P2T-EHumanEsophagusESCC1.85e-408.75e-010.1177
58478ENOPH1P4T-EHumanEsophagusESCC1.46e-338.18e-010.1323
58478ENOPH1P5T-EHumanEsophagusESCC2.18e-143.00e-010.1327
58478ENOPH1P8T-EHumanEsophagusESCC3.61e-243.46e-010.0889
58478ENOPH1P9T-EHumanEsophagusESCC3.64e-112.78e-010.1131
58478ENOPH1P10T-EHumanEsophagusESCC1.79e-205.53e-010.116
58478ENOPH1P11T-EHumanEsophagusESCC3.71e-167.60e-010.1426
58478ENOPH1P12T-EHumanEsophagusESCC1.29e-297.13e-010.1122
58478ENOPH1P15T-EHumanEsophagusESCC1.75e-367.96e-010.1149
58478ENOPH1P16T-EHumanEsophagusESCC6.88e-488.86e-010.1153
58478ENOPH1P17T-EHumanEsophagusESCC1.61e-065.63e-010.1278
58478ENOPH1P19T-EHumanEsophagusESCC2.74e-096.39e-010.1662
58478ENOPH1P20T-EHumanEsophagusESCC4.68e-193.71e-010.1124
58478ENOPH1P21T-EHumanEsophagusESCC1.25e-297.09e-010.1617
58478ENOPH1P22T-EHumanEsophagusESCC1.12e-243.72e-010.1236
Page: 1 2 3 4 5 6 

check button Transcriptomic changes along malignancy continuum.
TissueExpression DynamicsAbbreviation
EsophagusThe image shows the transcriptomic changes along malignancy continuum.log2FC in expression of this searched gene in stem-like cells from each diseased tissue sample relative to stem-like cells in normal samples in each tissue plotted against the malignancy continuum. Samples are colored based on if they are from different disease stage.
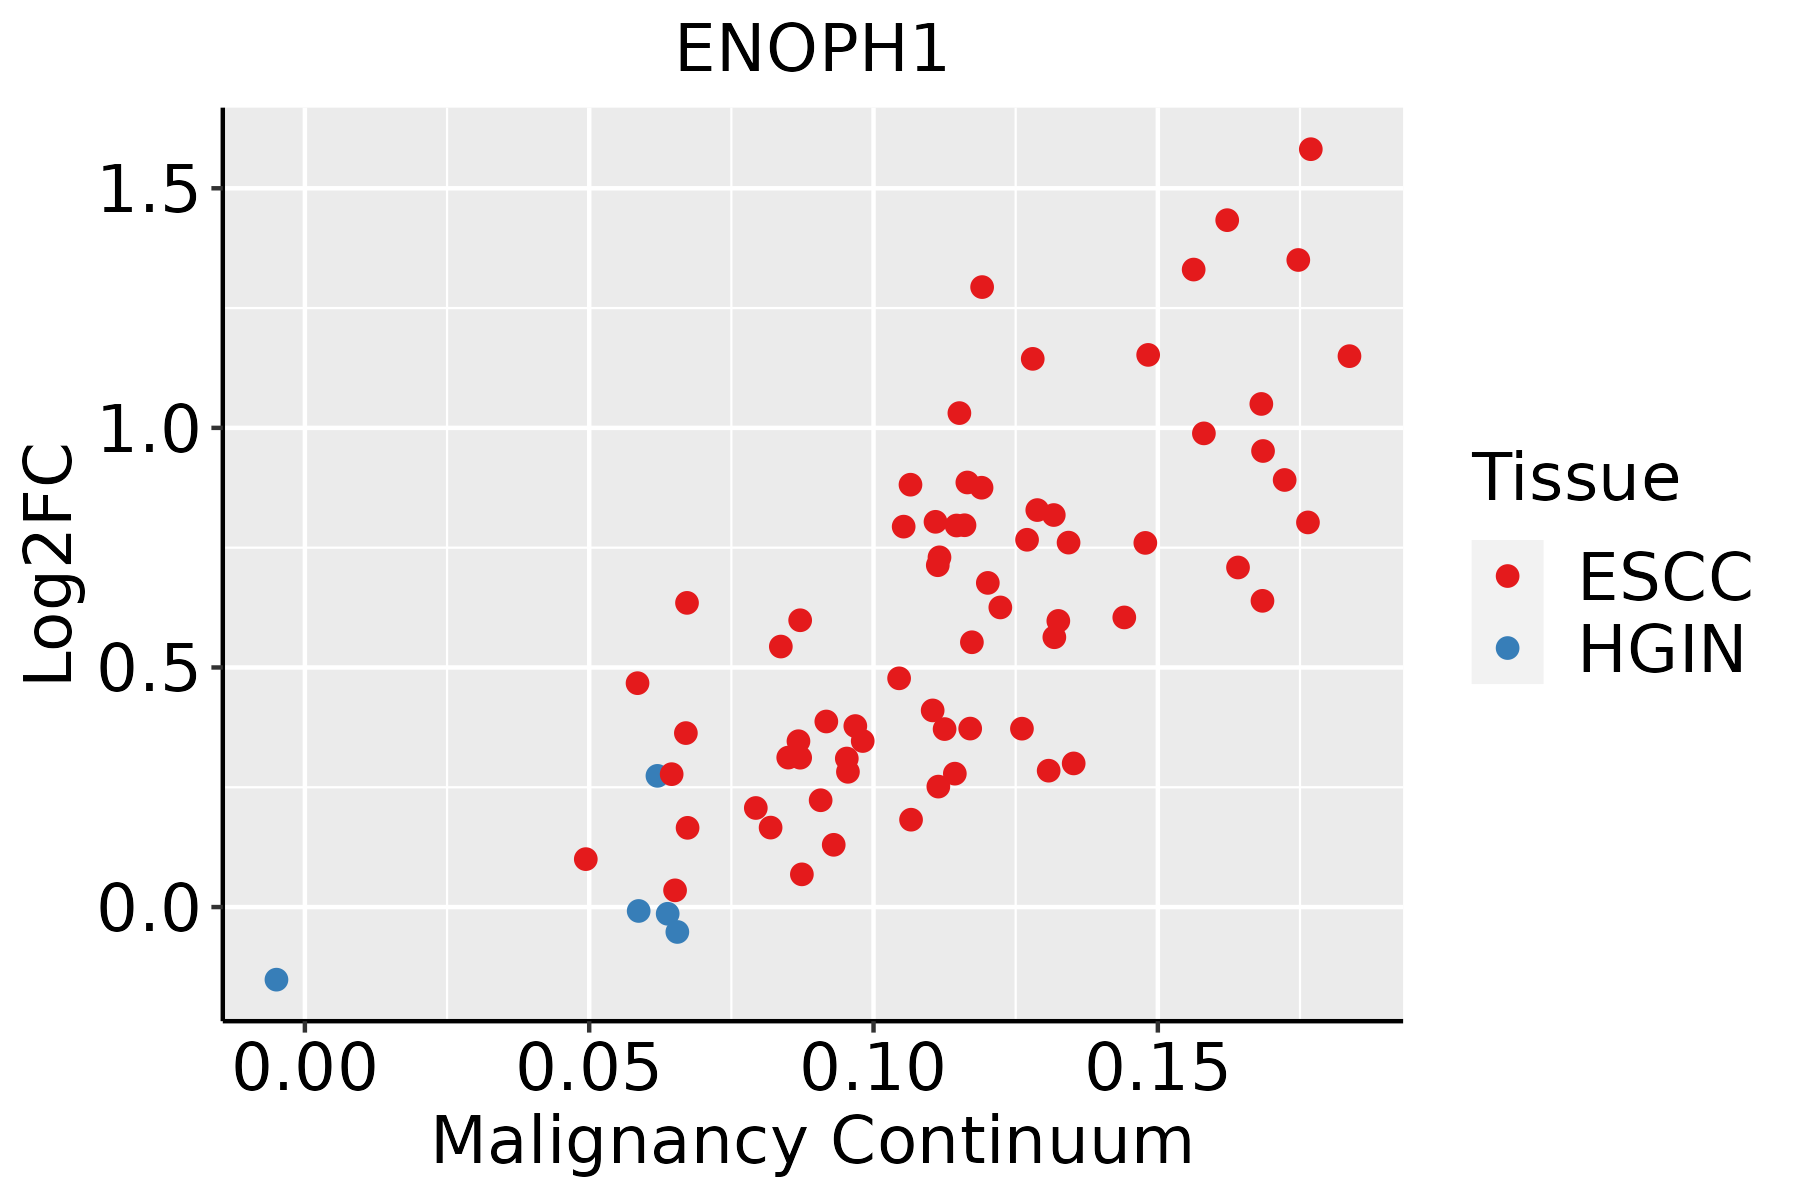
ESCC: Esophageal squamous cell carcinoma
HGIN: High-grade intraepithelial neoplasias
LGIN: Low-grade intraepithelial neoplasias
LiverThe image shows the transcriptomic changes along malignancy continuum.log2FC in expression of this searched gene in stem-like cells from each diseased tissue sample relative to stem-like cells in normal samples in each tissue plotted against the malignancy continuum. Samples are colored based on if they are from different disease stage.HCC: Hepatocellular carcinoma
NAFLD: Non-alcoholic fatty liver disease
Oral CavityThe image shows the transcriptomic changes along malignancy continuum.log2FC in expression of this searched gene in stem-like cells from each diseased tissue sample relative to stem-like cells in normal samples in each tissue plotted against the malignancy continuum. Samples are colored based on if they are from different disease stage.
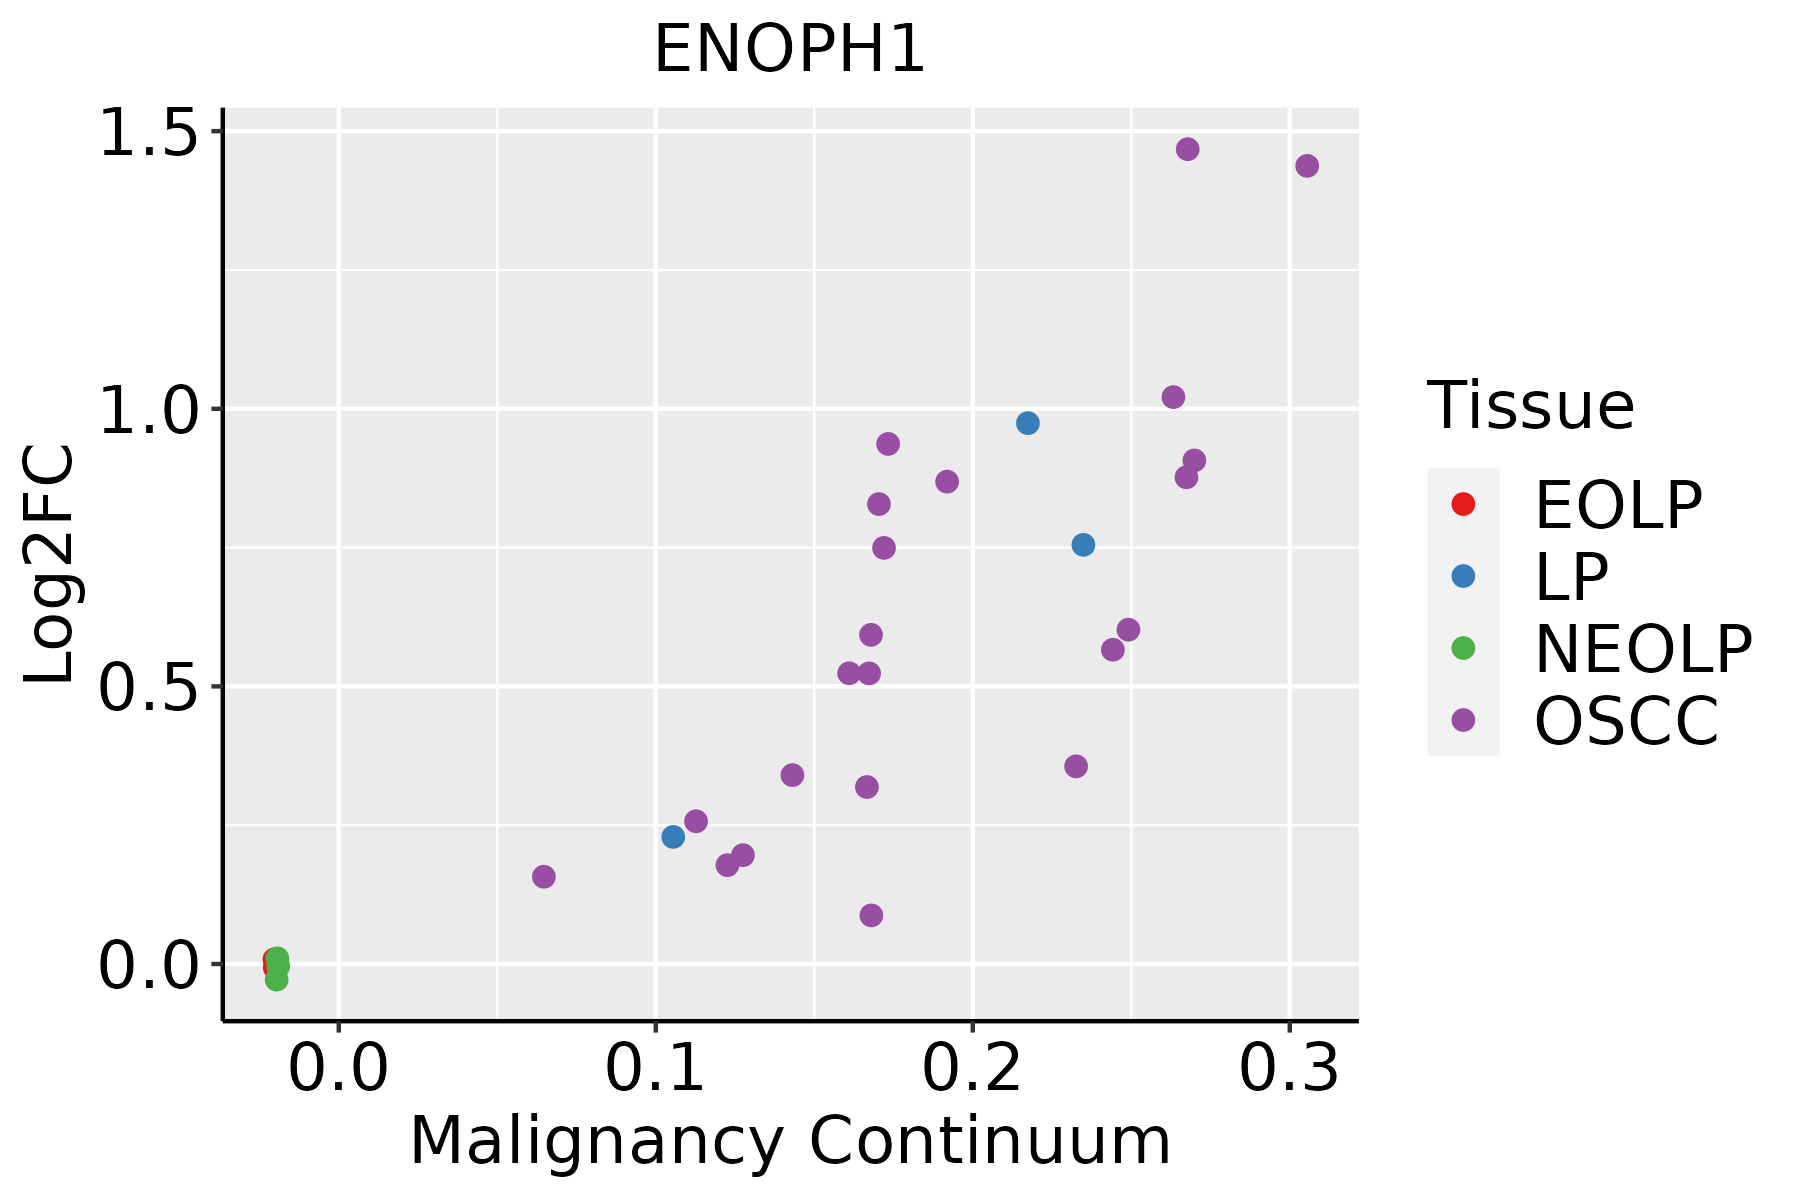
EOLP: Erosive Oral lichen planus
LP: leukoplakia
NEOLP: Non-erosive oral lichen planus
OSCC: Oral squamous cell carcinoma
SkinThe image shows the transcriptomic changes along malignancy continuum.log2FC in expression of this searched gene in stem-like cells from each diseased tissue sample relative to stem-like cells in normal samples in each tissue plotted against the malignancy continuum. Samples are colored based on if they are from different disease stage.
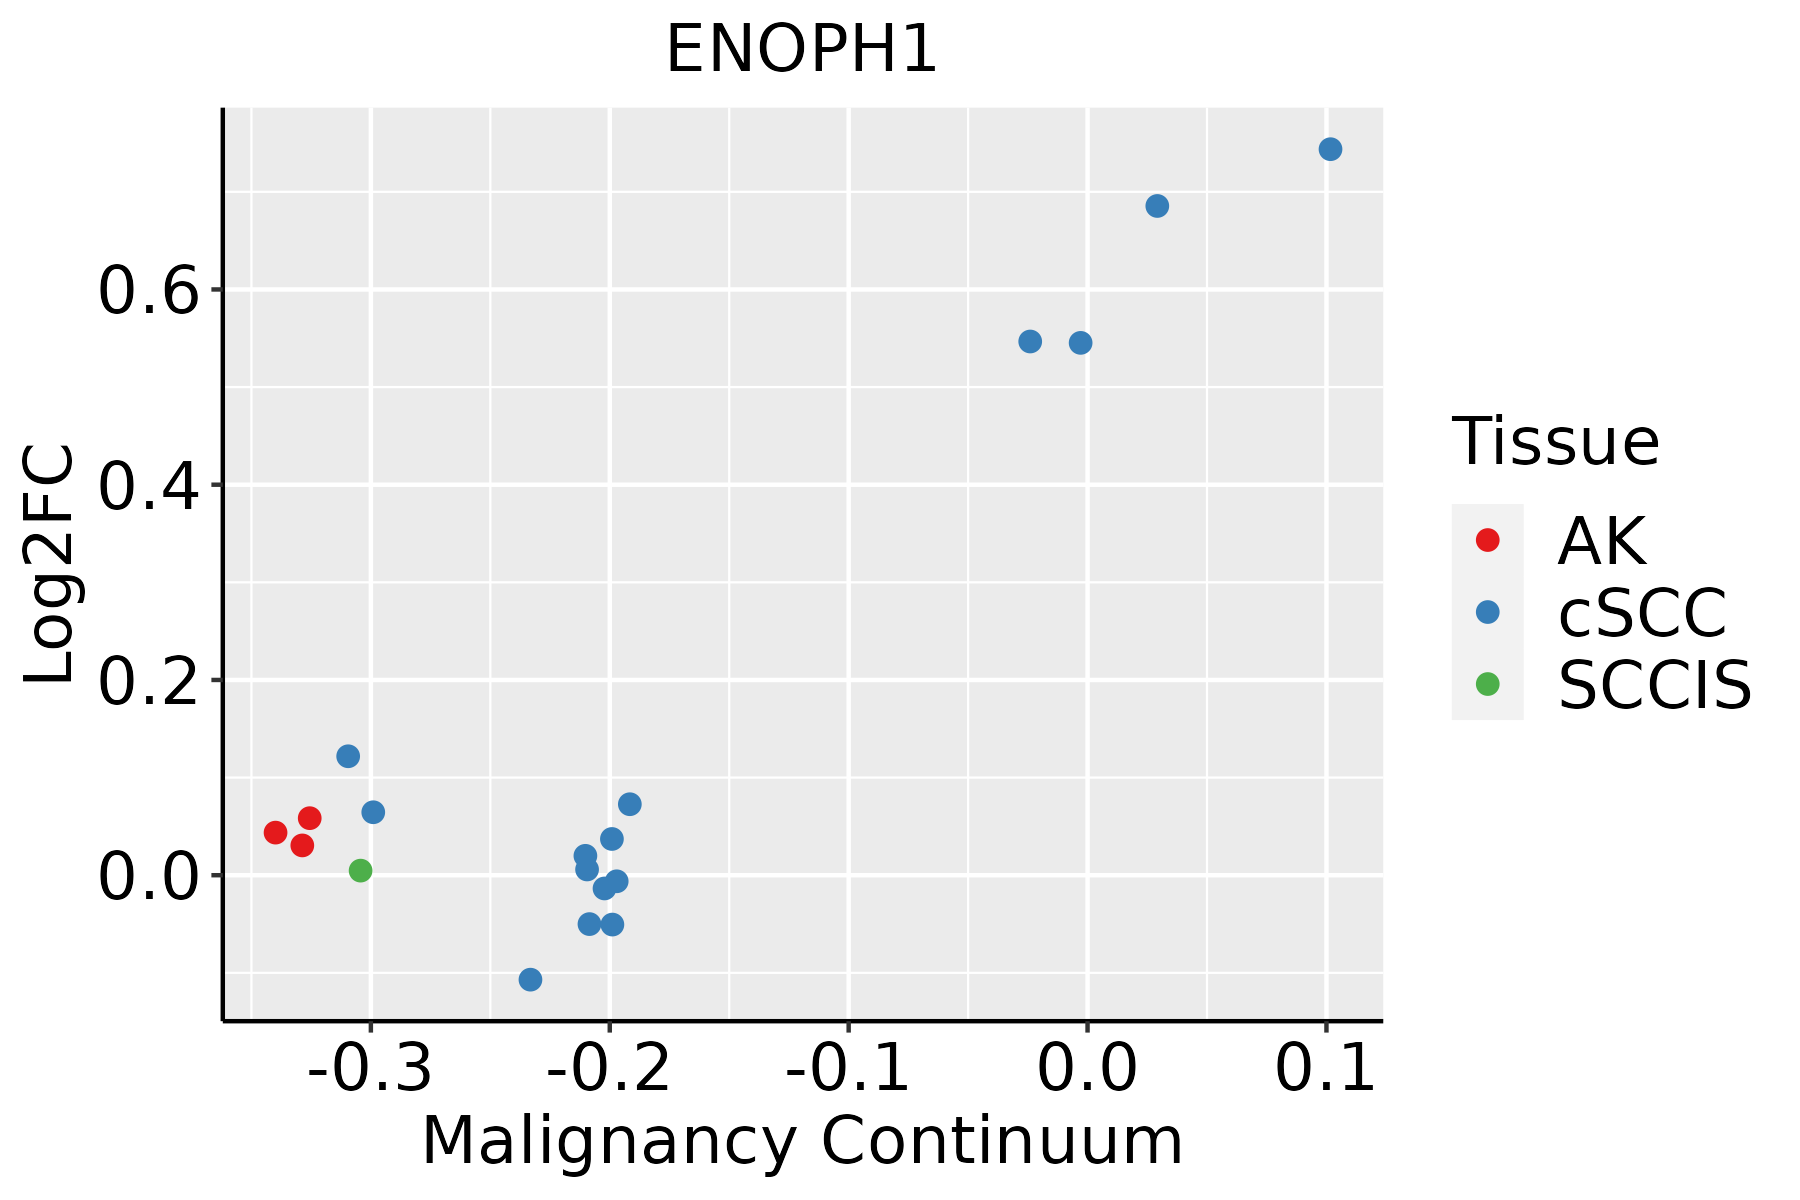
AK: Actinic keratosis
cSCC: Cutaneous squamous cell carcinoma
SCCIS:squamous cell carcinoma in situ
ThyroidThe image shows the transcriptomic changes along malignancy continuum.log2FC in expression of this searched gene in stem-like cells from each diseased tissue sample relative to stem-like cells in normal samples in each tissue plotted against the malignancy continuum. Samples are colored based on if they are from different disease stage.ATC: Anaplastic thyroid cancer
HT: Hashimoto's thyroiditis
PTC: Papillary thyroid cancer
∗log2FC in expression of this searched gene in stem-like cells from each diseased tissue sample relative to stem-like cells in normal samples in each tissue plotted against the malignancy continuum. Samples are colored based on if they are from different disease stage.

Top

Malignant transformation related pathway analysis

check buttonFind out the enriched GO biological processes and KEGG pathways involved in transition from healthy to precancer to cancer
check button Figure of enriched GO biological processes.
TissueDisease StageEnriched GO biological Processes
ColorectumADGO analysis - Figure of enriched GO biological processes: Top 15 enriched GO BP terms are showed in the bar plot of each disease state in each tissue. Each row represents a significant GO biological process which is colored according to the -log10(p.adjust).
ColorectumSERGO analysis - Figure of enriched GO biological processes: Top 15 enriched GO BP terms are showed in the bar plot of each disease state in each tissue. Each row represents a significant GO biological process which is colored according to the -log10(p.adjust).
ColorectumMSSGO analysis - Figure of enriched GO biological processes: Top 15 enriched GO BP terms are showed in the bar plot of each disease state in each tissue. Each row represents a significant GO biological process which is colored according to the -log10(p.adjust).
ColorectumMSI-HGO analysis - Figure of enriched GO biological processes: Top 15 enriched GO BP terms are showed in the bar plot of each disease state in each tissue. Each row represents a significant GO biological process which is colored according to the -log10(p.adjust).
ColorectumFAPGO analysis - Figure of enriched GO biological processes: Top 15 enriched GO BP terms are showed in the bar plot of each disease state in each tissue. Each row represents a significant GO biological process which is colored according to the -log10(p.adjust).
∗Top 15 enriched GO BP terms are showed in the bar plot of each disease state in each tissue. Each row represents a significant GO biological process which is colored according to the -log10(p.adjust).
Page: 1 2 3 4 5 6 7 8 9 

check button Enriched GO biological processes.
GO IDTissueDisease StageDescriptionGene RatioBg Ratiopvaluep.adjustCount
GO:00090672LiverHCCaspartate family amino acid biosynthetic process19/795821/187236.44e-067.84e-0519
GO:00090861LiverHCCmethionine biosynthetic process12/795812/187233.46e-053.45e-0412
GO:00090662LiverHCCaspartate family amino acid metabolic process34/795849/187231.28e-041.06e-0334
GO:00000971LiverHCCsulfur amino acid biosynthetic process15/795817/187231.31e-041.07e-0315
GO:00065551LiverHCCmethionine metabolic process14/795816/187232.73e-041.98e-0314
GO:0043094LiverHCCcellular metabolic compound salvage20/795826/187233.82e-042.61e-0320
GO:0046500LiverHCCS-adenosylmethionine metabolic process13/795815/187235.67e-043.61e-0313
GO:00163119Oral cavityOSCCdephosphorylation220/7305417/187236.33e-091.34e-07220
GO:00442724Oral cavityOSCCsulfur compound biosynthetic process82/7305148/187233.71e-053.31e-0482
GO:00067905Oral cavityOSCCsulfur compound metabolic process168/7305339/187234.50e-053.84e-04168
GO:00160537Oral cavityOSCCorganic acid biosynthetic process155/7305316/187231.64e-041.13e-03155
GO:00463947Oral cavityOSCCcarboxylic acid biosynthetic process154/7305314/187231.73e-041.19e-03154
GO:00086524Oral cavityOSCCcellular amino acid biosynthetic process42/730576/187232.93e-031.27e-0242
GO:19016074Oral cavityOSCCalpha-amino acid biosynthetic process37/730568/187237.09e-032.63e-0237
GO:190160711Oral cavityLPalpha-amino acid biosynthetic process28/462368/187232.01e-031.49e-0228
GO:000865211Oral cavityLPcellular amino acid biosynthetic process30/462376/187233.07e-032.09e-0230
GO:000679012Oral cavityLPsulfur compound metabolic process106/4623339/187233.36e-032.25e-02106
GO:00090673Oral cavityLPaspartate family amino acid biosynthetic process11/462321/187235.78e-033.44e-0211
GO:19016076SkincSCCalpha-amino acid biosynthetic process30/486468/187238.91e-046.10e-0330
GO:00090675SkincSCCaspartate family amino acid biosynthetic process12/486421/187232.40e-031.38e-0212
Page: 1 2 3 

check button Enriched KEGG pathways.
Pathway IDTissueDisease StageDescriptionGene RatioBg Ratiopvaluep.adjustqvalueCount
hsa002702LiverHCCCysteine and methionine metabolism35/402052/84653.03e-039.94e-035.53e-0335
hsa002703LiverHCCCysteine and methionine metabolism35/402052/84653.03e-039.94e-035.53e-0335
Page: 1 

Top

Cell-cell communication analysis

check buttonIdentification of potential cell-cell interactions between two cell types and their ligand-receptor pairs for different disease states
LigandReceptorLRpairPathwayTissueDisease Stage
Page: 1 

Top

Single-cell gene regulatory network inference analysis

check buttonFind out the significant the regulons (TFs) and the target genes of each regulon across cell types for different disease states
TFCell TypeTissueDisease StageTarget GeneRSSRegulon Activity
∗The dot plots of a searched regulon are shown for all cell subpopulations in each disease state of each tissue based on the regulon specific score inferred using pySCENIC and by calculating the average expression.
Page: 1 

Top

Somatic mutation of malignant transformation related genes

check buttonAnnotation of somatic variants for genes involved in malignant transformation
Hugo SymbolVariant ClassVariant ClassificationdbSNP RSHGVScHGVSpHGVSp ShortSWISSPROTBIOTYPESIFTPolyPhenTumor Sample BarcodeTissueHistologySexAgeStageTherapy TypesDrugsOutcome
ENOPH1SNVMissense_Mutationnovelc.575G>Tp.Ser192Ilep.S192IQ9UHY7protein_codingdeleterious(0)probably_damaging(0.991)TCGA-AN-A046-01Breastbreast invasive carcinomaFemale>=65I/IIUnknownUnknownSD
ENOPH1SNVMissense_Mutationc.453N>Gp.Ile151Metp.I151MQ9UHY7protein_codingdeleterious(0.04)possibly_damaging(0.721)TCGA-BH-A18H-01Breastbreast invasive carcinomaFemale<65I/IIChemotherapyadriamycinCR
ENOPH1insertionFrame_Shift_Insnovelc.65_66insTTTAATTGTGCAGTCTACAACTTCCCCAAATp.Pro23LeufsTer28p.P23Lfs*28Q9UHY7protein_codingTCGA-AN-A049-01Breastbreast invasive carcinomaFemale<65I/IIUnknownUnknownSD
ENOPH1insertionNonsense_Mutationnovelc.466_467insCCATCTCTACAAAAAATTAAAAAAAAAAAAAAAAGCTp.Ser156ThrfsTer7p.S156Tfs*7Q9UHY7protein_codingTCGA-AO-A03P-01Breastbreast invasive carcinomaFemale<65I/IIHormone TherapyletrozolePD
ENOPH1insertionNonsense_Mutationnovelc.726_727insGTATCCCATTTCCCACTCTAACTTGCTCCATTCTAGGCTGGGAGTp.Glu242_Lys243insValSerHisPheProLeuTerLeuAlaProPheTerAlaGlySerp.E242_K243insVSHFPL*LAPF*AGSQ9UHY7protein_codingTCGA-B6-A0IK-01Breastbreast invasive carcinomaFemale<65III/IVUnknownUnknownPD
ENOPH1SNVMissense_Mutationc.14C>Tp.Ser5Leup.S5LQ9UHY7protein_codingdeleterious(0.01)benign(0.021)TCGA-DS-A0VM-01Cervixcervical & endocervical cancerFemale<65I/IIChemotherapycisplatinPD
ENOPH1SNVMissense_Mutationrs374821138c.106N>Ap.Glu36Lysp.E36KQ9UHY7protein_codingtolerated(0.48)benign(0)TCGA-AA-A010-01Colorectumcolon adenocarcinomaFemale<65I/IIChemotherapyfolinicCR
ENOPH1SNVMissense_Mutationnovelc.592G>Tp.Asp198Tyrp.D198YQ9UHY7protein_codingdeleterious(0.01)benign(0.185)TCGA-A5-A0G1-01Endometriumuterine corpus endometrioid carcinomaFemale>=65I/IIUnknownUnknownSD
ENOPH1SNVMissense_Mutationnovelc.577T>Cp.Tyr193Hisp.Y193HQ9UHY7protein_codingdeleterious(0)probably_damaging(1)TCGA-AP-A051-01Endometriumuterine corpus endometrioid carcinomaFemale>=65I/IIUnknownUnknownSD
ENOPH1SNVMissense_Mutationc.480N>Tp.Gln160Hisp.Q160HQ9UHY7protein_codingdeleterious(0)probably_damaging(0.995)TCGA-AP-A0LM-01Endometriumuterine corpus endometrioid carcinomaFemale<65III/IVChemotherapycisplatinSD
Page: 1 2 3 4 

Top

Related drugs of malignant transformation related genes

check buttonIdentification of chemicals and drugs interact with genes involved in malignant transfromation
(DGIdb 4.0)
Entrez IDSymbolCategoryInteraction TypesDrug Claim NameDrug NamePMIDs
Page: 1